. 2023 Nov;40(11):2513-2523.
doi: 10.1007/s11095-023-03549-2. Epub 2023 Jun 22.

Application of Pharmacokinetic Modeling to Characterize Hepatobiliary Disposition of Imaging Agents and Alterations due to Liver Injury in Isolated Perfused Rat Livers

Affiliations

Application of Pharmacokinetic Modeling to Characterize Hepatobiliary Disposition of Imaging Agents and Alterations due to Liver Injury in Isolated Perfused Rat Livers

Angela Jeong et al. Pharm Res. 2023 Nov.

Abstract

Background: Understanding the impact of altered hepatic uptake and/or efflux on the hepatobiliary disposition of the imaging agents [99mTc]Mebrofenin (MEB) and [153Gd]Gadobenate dimeglumine (BOPTA) is important for proper estimation of liver function.

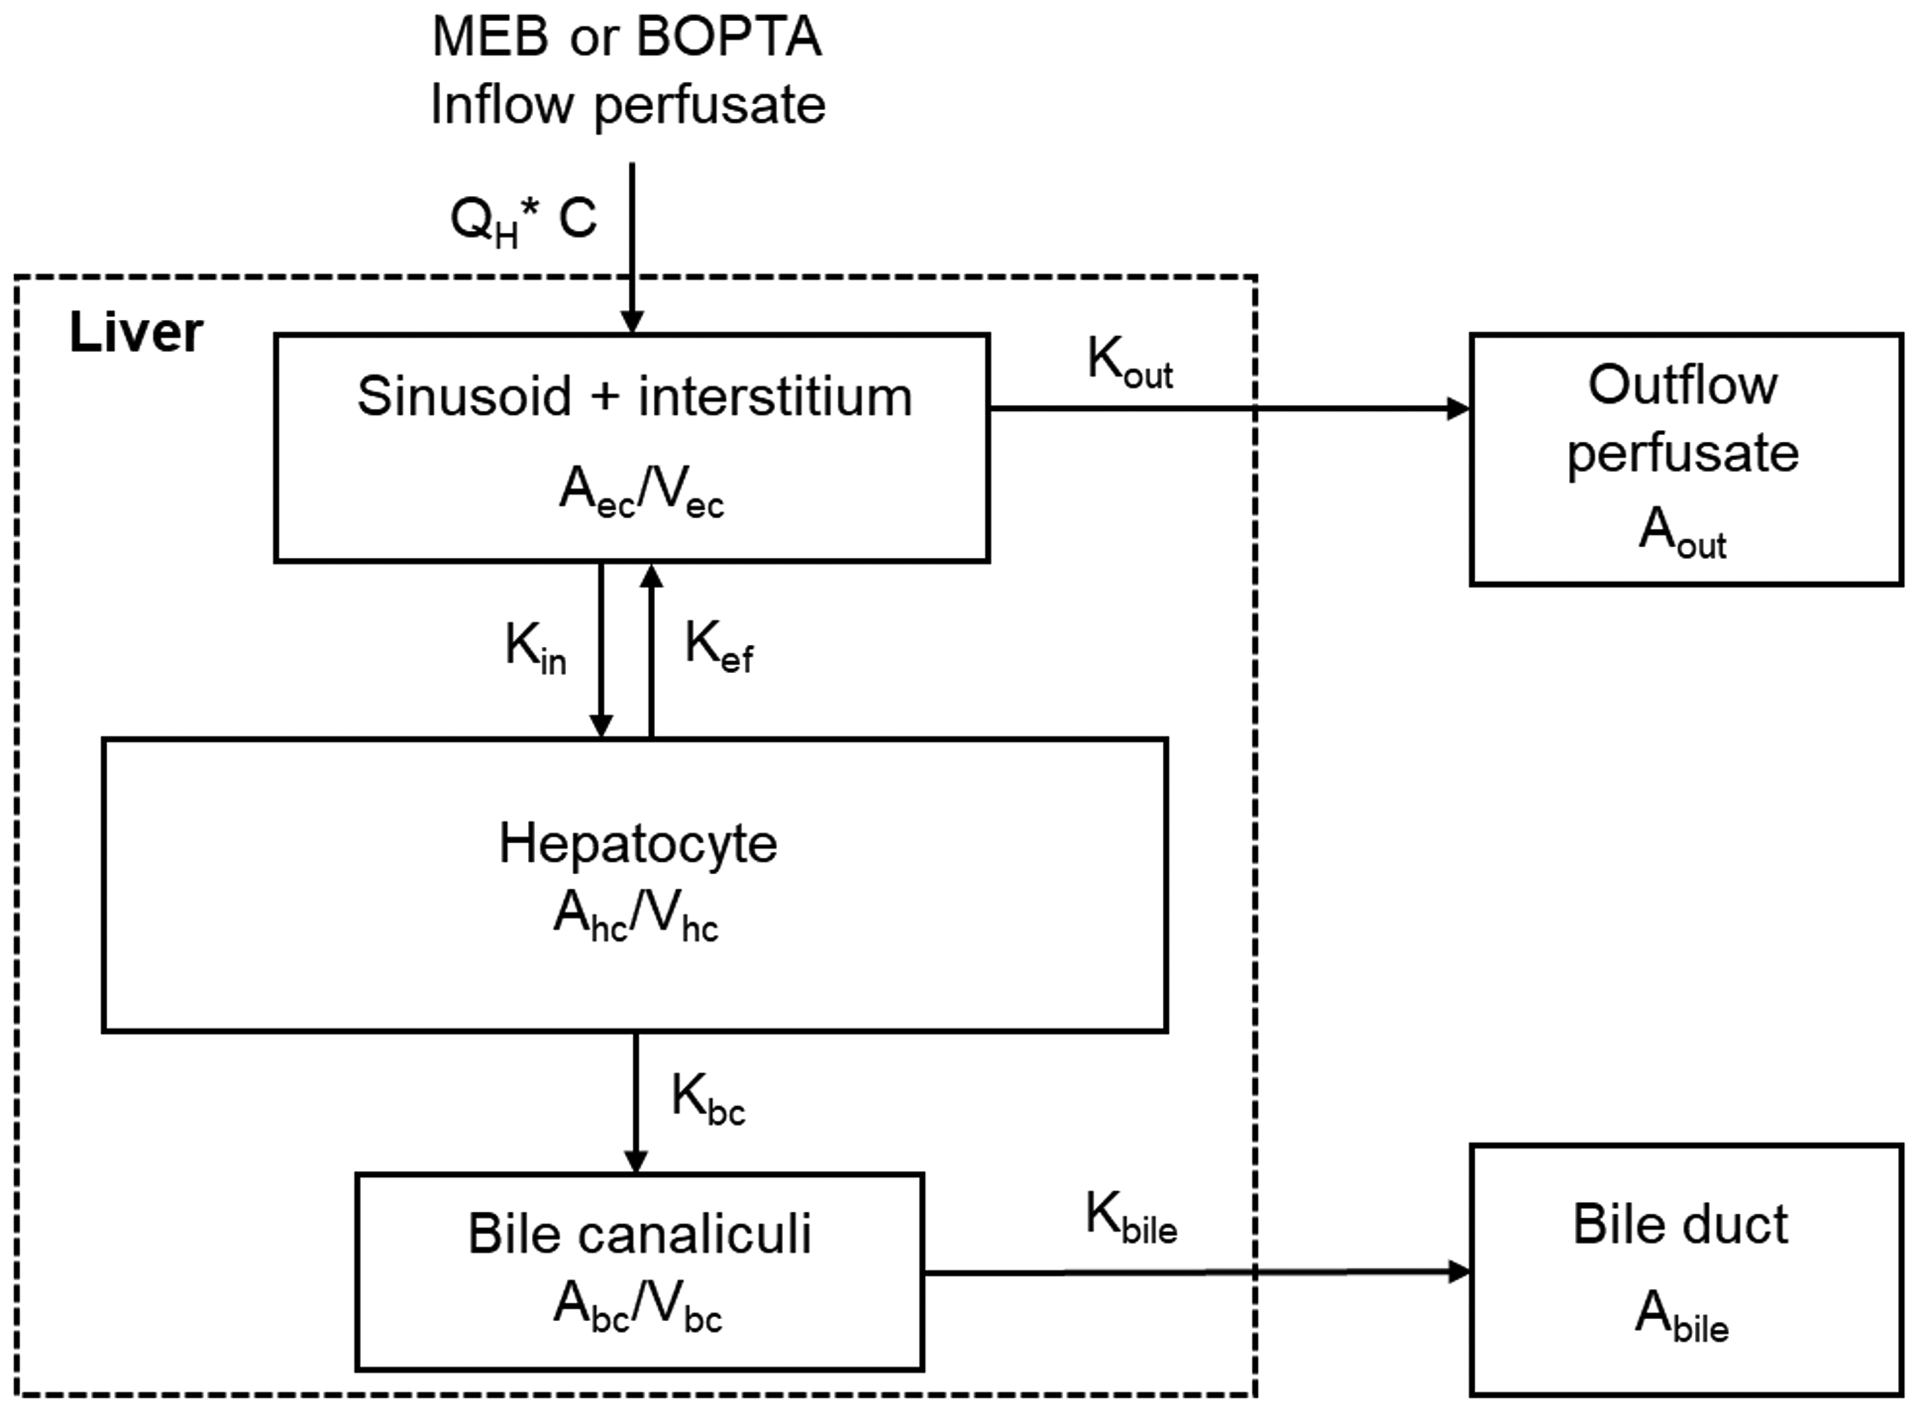
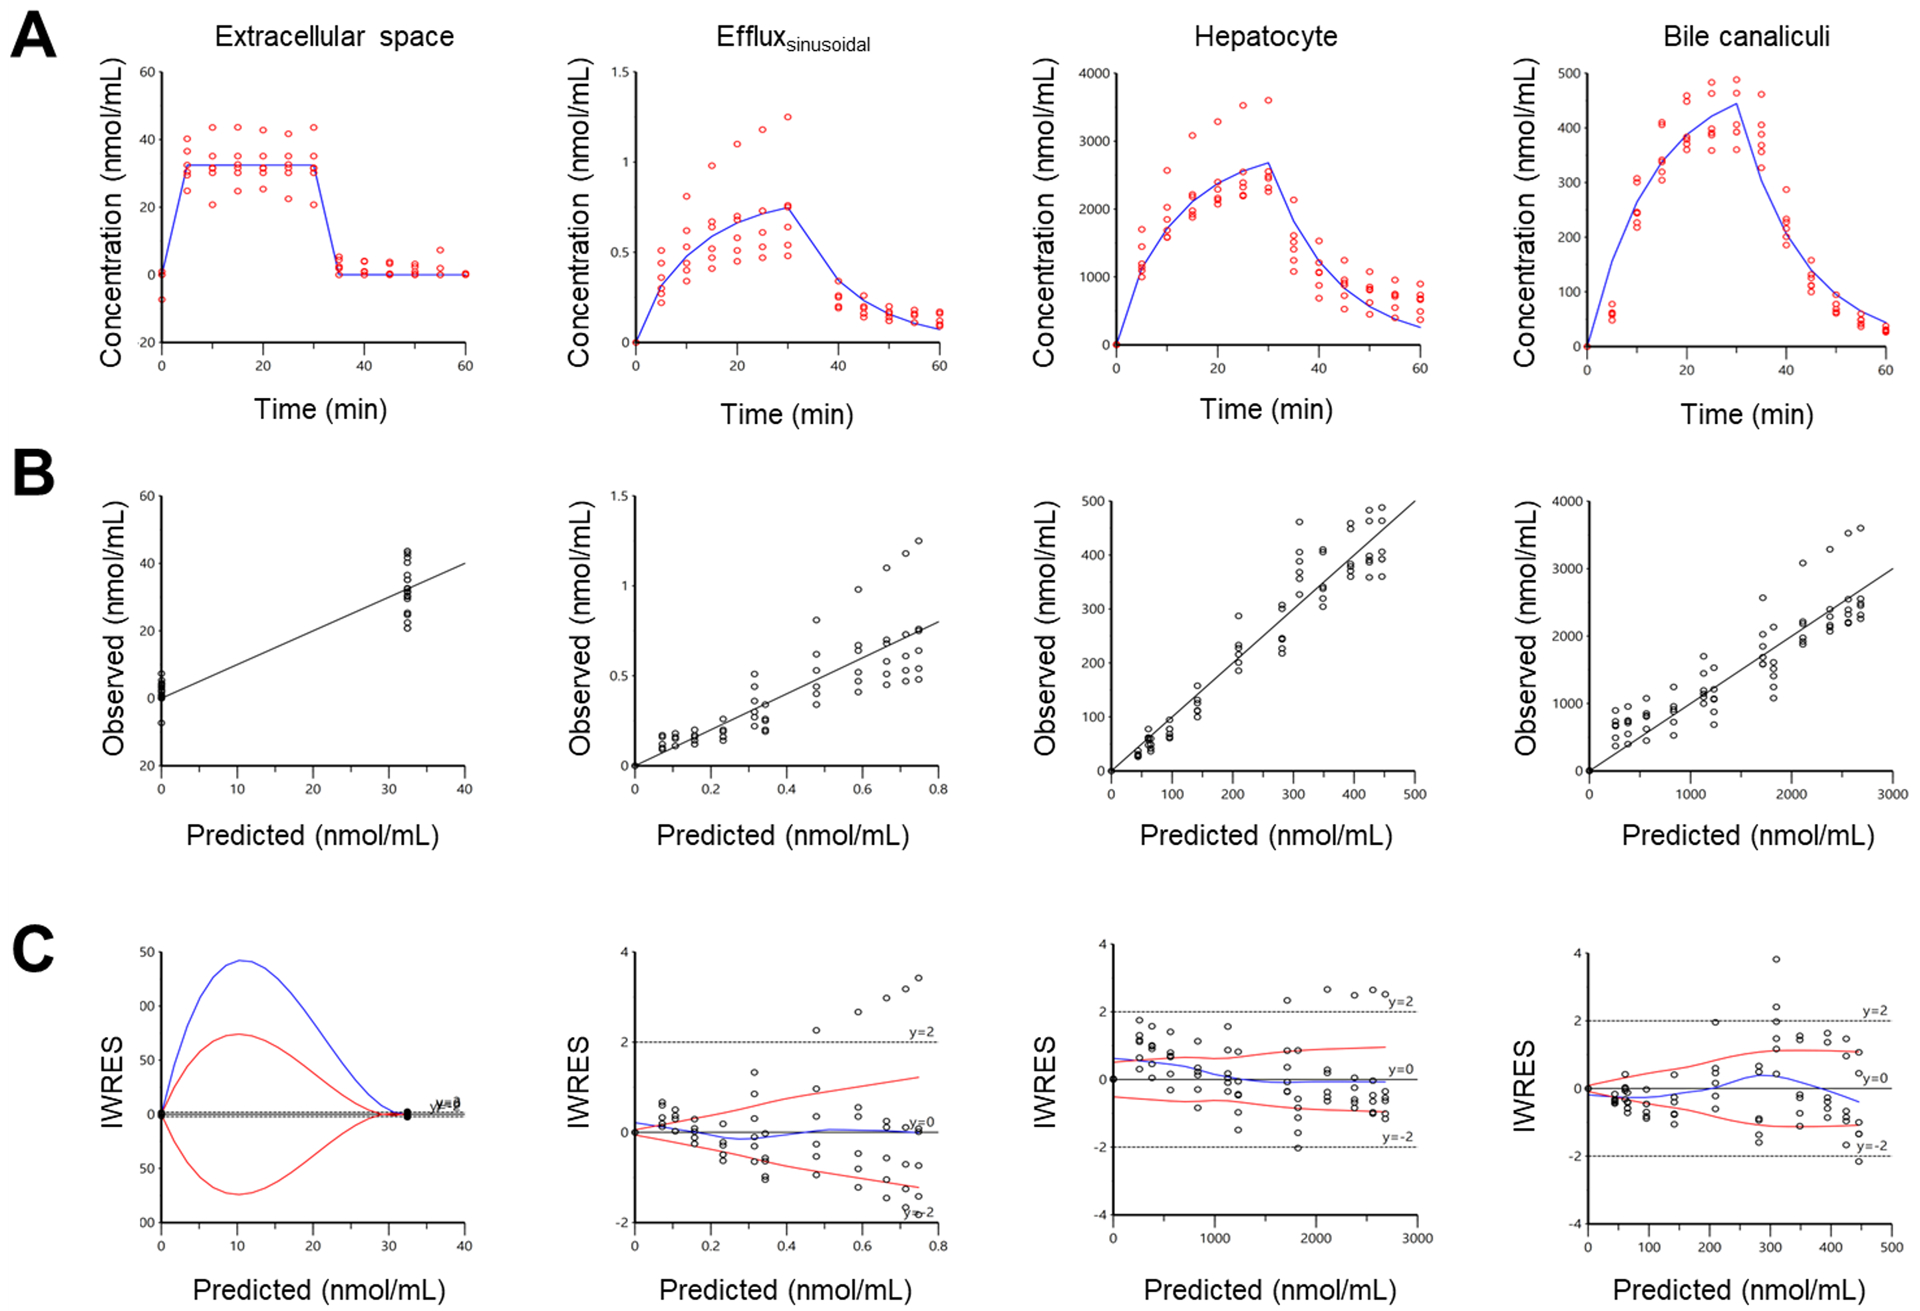
Methods: A multi-compartmental pharmacokinetic (PK) model describing MEB and BOPTA disposition in isolated perfused rat livers (IPRLs) was developed. The PK model was simultaneously fit to MEB and BOPTA concentration-time data in the extracellular space, hepatocytes, bile canaliculi, and sinusoidal efflux in livers from healthy rats, and to BOPTA concentration-time data in rats pretreated with monocrotaline (MCT).

Results: The model adequately described MEB and BOPTA disposition in each compartment. The hepatocyte uptake clearance was much higher for MEB (55.3 mL/min) than BOPTA (6.67 mL/min), whereas the sinusoidal efflux clearance for MEB (0.000831 mL/min) was lower than BOPTA (0.0127 mL/min). The clearance from hepatocytes to bile (CLbc) for MEB (0.658 mL/min) was similar to BOPTA (0.642 mL/min) in healthy rat livers. The BOPTA CLbc was reduced in livers from MCT-pretreated rats (0.496 mL/min), while the sinusoidal efflux clearance was increased (0.0644 mL/min).

Conclusion: A PK model developed to characterize MEB and BOPTA disposition in IPRLs was used to quantify changes in the hepatobiliary disposition of BOPTA caused by MCT pretreatment of rats to induce liver toxicity. This PK model could be applied to simulate changes in the hepatobiliary disposition of these imaging agents in rats in response to altered hepatocyte uptake or efflux associated with disease, toxicity, or drug-drug interactions.

Keywords: hepatobiliary imaging; isolated perfused rat liver; pharmacokinetics; transporters.


Conflict of interest statement

Conflict of interest statement

All authors declare that they have no conflicts of interest to disclose.

Figures

Figure 1.
Figure 1.
Structure of the liver lobule and transporter-mediated hepatobiliary distribution of [99mTc]Mebrofenin (MEB) and [153Gd]Gadobenate dimeglumine (BOPTA). Hepatocytes are aligned radially along the sinusoids. During perfusion, MEB and BOPTA flow into the sinusoids from the portal vein. From sinusoids, MEB and BOPTA enter hepatocytes via the organic anion transporting polypeptides (Oatps) that are expressed on the sinusoidal membrane. Intracellular MEB and BOPTA can either be excreted back to sinusoids via sinusoidal multidrug resistance-associated protein 3 (Mrp3) or into bile via canalicular Mrp2. Compounds that are not taken up into hepatocytes during a single pass, and those that are effluxed back to sinusoids (after previous entry into hepatocytes) flow out of the liver via hepatic veins.
Figure 2.
Figure 2.
Scheme of the single-pass rat liver perfusion. Krebs-Henseleit-bicarbonate (KHB) solution was pumped (30 ml/min) into the liver through a cannula inserted in the portal vein; the solution was discarded through a transection of the abdominal inferior vena cava to avoid liver edema. Then a cannula was introduced in the right atrium to collect the solution flowing through the hepatic veins and the abdominal inferior vena cava was ligated above the transection. Another cannula was placed in the common bile duct. A gamma counter was placed above the liver to quantify the liver concentrations of [99mTc]Mebrofenin (MEB) and [153Gd]Gadobenate dimeglumine (BOPTA). Samples were collected every 5 min in the outflow perfusate and common bile duct to measure the concentrations with a gamma counter.
Figure 3.
Figure 3.
Model representing [99mTc]Mebrofenin (MEB) and [153Gd]Gadobenate dimeglumine (BOPTA) hepatic disposition. QH: perfusate flow rate (30 ml/min), Aec: amount of MEB or BOPTA in the extracellular space, Vec: distribution volume of the extracellular space, Kin: rate constant for hepatocyte uptake, Kout: rate constant for perfusate outflow, Aout: amount in outflow perfusate, Kef: rate constant for efflux from hepatocytes to the extracellular space, Ahc: amount in hepatocytes, Vhc: distribution volume in hepatocytes, Abc: amount excreted into bile canaliculi, Vbc: distribution volume in bile canaliculi, Kbc: rate constant for efflux from hepatocytes to bile canaliculi, Kbile: rate constant for bile flow from bile canaliculi to the common bile duct, Abile: amount in the common bile duct
Figure 4.
Figure 4.
Goodness-of-fit plots of [99mTc]Mebrofenin (MEB) accumulation and elimination in each liver compartment of IPRLs from normal rats. A. Model predicted MEB concentration was overlaid with experimentally determined concentration-time data for extracellular space, sinusoidal efflux, hepatocyte, and bile canaliculi. Blue line corresponds to the naïve-pooled model-predicted MEB concentration, and red dots correspond to observed data. B. Observed MEB concentrations were plotted versus model predictions for each compartment. Solid line represents the line of unity. C. Scatterplots of individual weighted residuals (IWRES) versus the predicted concentrations in each compartment with blue loess line indicating the central tendency of IWRES and the red lines indicating fanning pattern.
Figure 5.
Figure 5.
Goodness-of-fit plots of [153Gd]Gadobenate dimeglumine (BOPTA) accumulation and elimination in each liver compartment of IPRLs from normal rats. A. Model predicted BOPTA concentration was overlaid with experimentally determined concentration-time data for extracellular space, sinusoidal efflux, hepatocyte, and bile canaliculi. Blue line corresponds to the naïve-pooled model-predicted BOPTA concentration, and red dots correspond to observed data. B. Observed BOPTA concentrations were plotted versus model predictions for each compartment. Solid line represents the line of unity. C. Scatterplots of individual weighted residuals (IWRES) versus the predicted concentrations in each compartment with blue loess line indicating the central tendency of IWRES and the red lines indicating fanning pattern.
Figure 6.
Figure 6.
Goodness-of-fit plots of [153Gd]Gadobenate dimeglumine (BOPTA) accumulation and elimination in each liver compartment of IPRLs from MCT-treated rats. A. Model predicted MEB concentration was overlaid with experimentally determined concentration-time data for extracellular space, sinusoidal efflux, hepatocyte, and bile canaliculi. Blue line corresponds to the naïve-pooled model-predicted MEB concentration, and red dots correspond to observed data. B. Observed MEB concentrations were plotted against model predictions for each compartment. Solid line represents the line of unity. C. Scatterplots of individual weighted residuals (IWRES) versus the predicted concentrations in each compartment with blue loess line indicating the central tendency of IWRES and the red lines indicating fanning pattern.

References

    1. Pastor CM, Mullhaupt B, Stieger B. The role of organic anion transporters in diagnosing liver diseases by magnetic resonance imaging. Drug Metab Dispos. 2014; 42:675–684. - PubMed
    1. Kusuhara H Imaging in the study of membrane transporters. Clin Pharmacol Ther. 2013; 94:33–36. - PubMed
    1. Guo Y, Chu X, Parrott NJ, Brouwer KLR, Hsu V, Nagar S et al. Advancing predictions of tissue and intracellular drug concentrations using in vitro, imaging and PBPK modeling approaches. Clin Pharmacol Ther. 2018; 104:865–889. - PMC - PubMed
    1. Hoekstra LT, de Graaf W, Nibourg GA, Heger M, Bennink RJ, Stieger B et al. Physiological and biochemical basis of clinical liver function tests. Ann Surg. 2013; 257:27–36. - PubMed
    1. Giacomini KM, Huang S, Tweedie DJ et al. (The International Transporter Consortium). Membrane transporters in drug development. Nature Reviews Drug Discovery. 2010; 9(3):215–36. - PMC - PubMed

Substances

LinkOut - more resources