. 2023 Jun 22;23(1):575.
doi: 10.1186/s12885-023-11019-6.

Characterization and evaluation of gene fusions as a measure of genetic instability and disease prognosis in prostate cancer

Affiliations

Characterization and evaluation of gene fusions as a measure of genetic instability and disease prognosis in prostate cancer

Carolin Schimmelpfennig et al. BMC Cancer. .

Abstract

Background: Prostate cancer (PCa) is one of the most prevalent cancers worldwide. The clinical manifestations and molecular characteristics of PCa are highly variable. Aggressive types require radical treatment, whereas indolent ones may be suitable for active surveillance or organ-preserving focal therapies. Patient stratification by clinical or pathological risk categories still lacks sufficient precision. Incorporating molecular biomarkers, such as transcriptome-wide expression signatures, improves patient stratification but so far excludes chromosomal rearrangements. In this study, we investigated gene fusions in PCa, characterized potential novel candidates, and explored their role as prognostic markers for PCa progression.

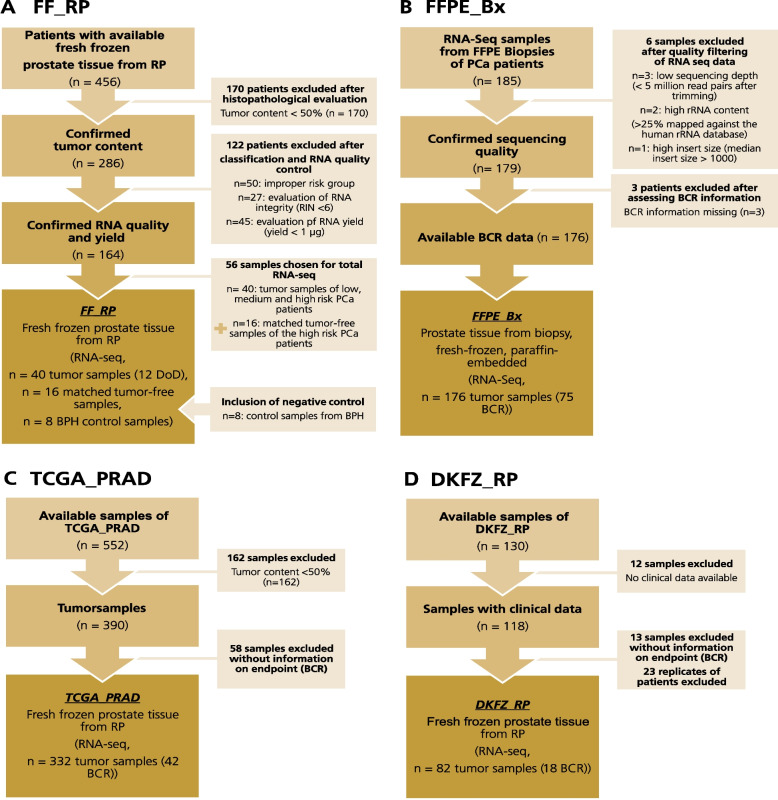
Methods: We analyzed 630 patients in four cohorts with varying traits regarding sequencing protocols, sample conservation, and PCa risk group. The datasets included transcriptome-wide expression and matched clinical follow-up data to detect and characterize gene fusions in PCa. With the fusion calling software Arriba, we computationally predicted gene fusions. Following detection, we annotated the gene fusions using published databases for gene fusions in cancer. To relate the occurrence of gene fusions to Gleason Grading Groups and disease prognosis, we performed survival analyses using the Kaplan-Meier estimator, log-rank test, and Cox regression.

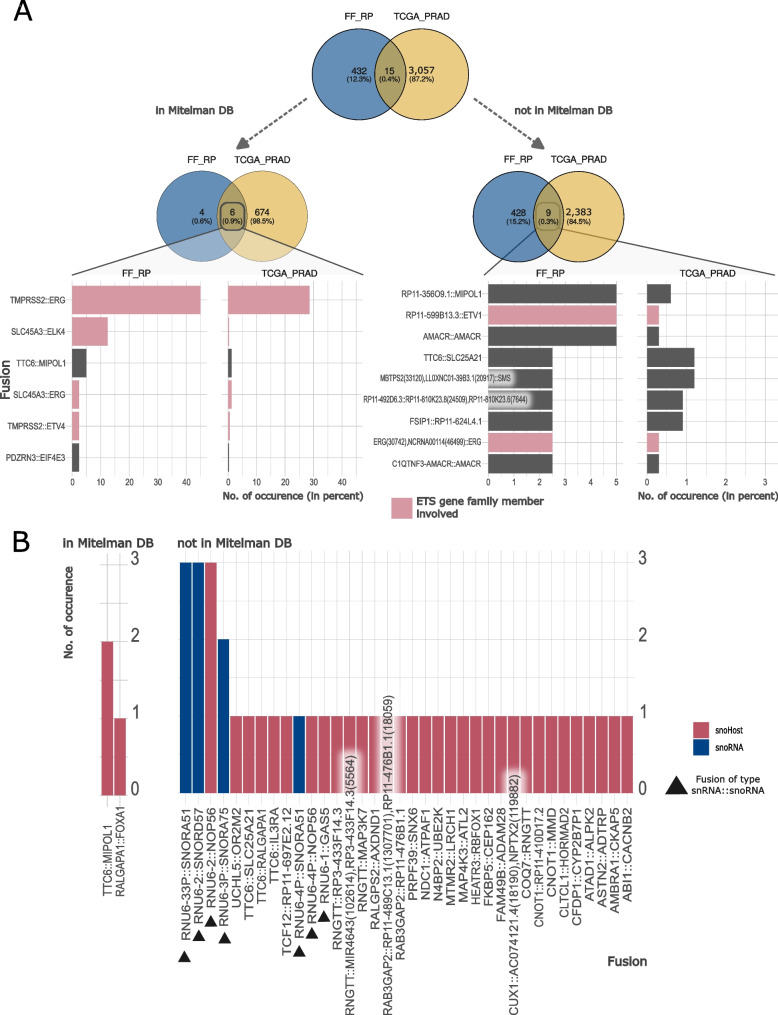
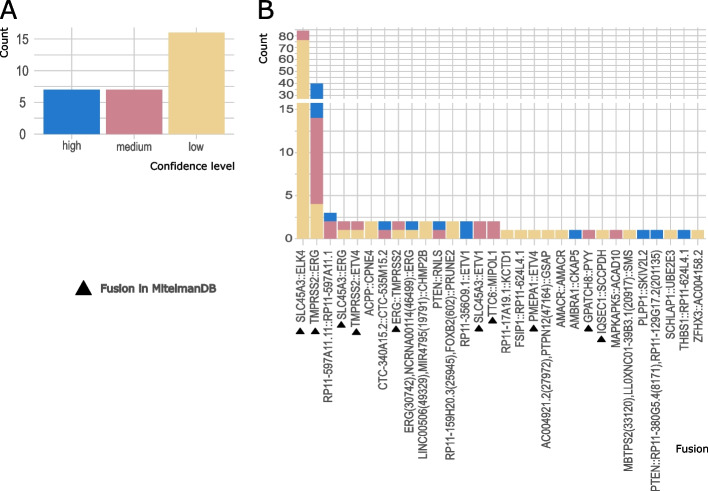
Results: Our analyses identified two potential novel gene fusions, MBTTPS2,L0XNC01::SMS and AMACR::AMACR. These fusions were detected in all four studied cohorts, providing compelling evidence for the validity of these fusions and their relevance in PCa. We also found that the number of gene fusions detected in a patient sample was significantly associated with the time to biochemical recurrence in two of the four cohorts (log-rank test, p-value < 0.05 for both cohorts). This was also confirmed after adjusting the prognostic model for Gleason Grading Groups (Cox regression, p-values < 0.05).

Conclusions: Our gene fusion characterization workflow revealed two potential novel fusions specific for PCa. We found evidence that the number of gene fusions was associated with the prognosis of PCa. However, as the quantitative correlations were only moderately strong, further validation and assessment of clinical value is required before potential application.

Keywords: Biomarker; Gene fusion; Genomic instability; Molecular diagnostic testing; Molecular pathology; Next-generation sequencing; Prognosis; Prostate cancer; Transcriptome.


Conflict of interest statement

The authors declare no competing interests.

Figures

Fig. 1
Fig. 1
Overview of the cohorts included in this study. The flowcharts depict the number of patients included in each cohort as well as exclusion criteria according to REMARK [25]. A FF_RP: 64 samples of the fresh-frozen tissue specimens fulfilled all inclusion criteria. 40 of those samples were tumor samples, and 16 were matched tumor-free samples. The remaining eight samples were tissue specimens from patients with benign prostatic hyperplasia and served as controls. B FFPE_Bx: 176 patients fulfilled all inclusion criteria. All samples were derived from FFPE biopsies. C TCGA_PRAD: Of the initial 552 samples, we included 332 samples that met our inclusion criteria. D DKFZ_RP: We downloaded the data for 130 samples from the EGA archive. Of those, we included 82 samples in our analyses. Patient characteristics of the cohorts are shown in Tables S1 and S2 (Additional file 1). BCR: biochemical recurrence; Bx: biopsy; DoD: Death of Disease; FF: fresh-frozen; FFPE: formalin-fixed paraffin-embedded; RP: radical prostatectomy; RIN:RNA integrity number
Fig. 2
Fig. 2
Numbers of high confidence gene fusions per sample. We plotted the numbers of gene fusions per sample, ordered by the number of fusions for each cohort. Samples are colored according to their TCC. For each plot, the mean number of fusions per sample is shown. A Bar plot of FF_RP control and tumor-free samples, respectively, and (B) FF_RP tumor samples. C Bar plot of the fusion number per sample for TCGA_PRAD. In (D), FFPE_Bx samples were split by specimen age (tertiles). The range of specimen ages is shown per age group
Fig. 3
Fig. 3
Characteristics of detected high confidence fusions for discovery cohorts FF_RP and TCGA_PRAD. A The Venn diagrams show the overlap of gene fusions between the two cohorts for all fusions (top), those fusions that are described in the Mitelman DB (left), as well as those that are not described (right). The overlap of fusions are shown in bar plots below, with their frequency in percent. Red: gene fusions that involve genes from the ETS family. Plot (B) shows the occurrence of gene fusions in FF_RP that involve snoRNAs (blue) or their host genes (red). Triangles highlight fusions of the type snRNA::snoRNA/host gene
Fig. 4
Fig. 4
Genes most frequently involved in gene fusions in the cohorts FF_RP and TCGA_PRAD. A Results for the 5’ gene and (B) results for the 3’ gene. The Venn diagrams show the numbers of different genes involved in gene fusions as well as their overlap between the two cohorts. Plots show the number of occurrences of genes found in both cohorts, divided by sample size for FF_RP (blue, n = 40) and TCGA_PRAD (yellow, n = 332). The black lines depict combined values calculated as the number of occurrences in FF_RP plus the number of occurrences in TCGA_PRAD, divided by the sum of the sample sizes of both cohorts. This value was used to sort the genes
Fig. 5
Fig. 5
Confirmation of gene fusions in FFPE_Bx. Unique gene fusions of discovery cohorts FF_RP and TCGA_PRAD that have been detected in FFPE_Bx. A Distribution of the 30 rediscovered gene fusions per Arriba confidence levels. B Histogram of the numbers of samples in which each gene fusion could be detected. Bars are colored according to confidence level. If a fusion was detected multiple times in one sample, the highest confidence level was assumed, and only one occurrence per sample was counted. Triangles next to the fusion names indicate whether a fusion can be found in the Mitelman DB
Fig. 6
Fig. 6
Prognosis of PCa progression. A Prognosis of PCa for all three cohorts for patients with and without TMPRSS2::ERG fusion. Kaplan–Meier curves and log-rank tests for TCGA_PRAD with n = 332 and 42 events (BCR), as well as FFPE_Bx with n = 176 and 75 events (BCR), and FF_RP with n = 40 and 12 events (DoD). B Kaplan–Meier curves and log-rank tests for TCGA_PRAD (high confidence gene fusions), FFPE_Bx (combined fusions), and FF_RP (high confidence, left to right), grouped by the median of the total number of gene fusions (< median of fusions per sample vs. ≥ median of fusions per sample)

References

    1. Sung H, Ferlay J, Siegel RL, Laversanne M, Soerjomataram I, Jemal A, Bray F. Global Cancer Statistics 2020: GLOBOCAN Estimates of Incidence and Mortality Worldwide for 36 Cancers in 185 Countries. CA Cancer J Clin. 2021;71:209–249. doi: 10.3322/caac.21660. - DOI - PubMed
    1. Wei T, Lu J, Ma T, Huang H, Kocher J-P, Wang L. Re-Evaluate Fusion Genes in Prostate Cancer. Cancer Inform. 2021;20:11769351211027592. doi: 10.1177/11769351211027592. - DOI - PMC - PubMed
    1. Eberli D, De Meerleer G, De Santis M, Gillessen S, Grummet J, Henry AM, et al. EAU - EANM - ESTRO - ESUR - ISUP - SIOG Guidelines on Prostate Cancer. 2023.
    1. Mossanen M, Nepple KG, Grubb RL 3rd, Androile GL, Kallogjeri D, Klein EA, et al. Heterogeneity in definitions of high-risk prostate cancer and varying impact on mortality rates after radical prostatectomy. Eur Urol Oncol. 2018;1:143–8. - PubMed
    1. Sopyllo K, Erickson AM, Mirtti T. Grading evolution and contemporary prognostic biomarkers of clinically significant prostate cancer. Cancers. 2021;13. - PMC - PubMed

Substances