. 2023 Sep;21(9):1839-1859.
doi: 10.1111/pbi.14097. Epub 2023 Jun 22.

Single-cell RNA sequencing profiles reveal cell type-specific transcriptional regulation networks conditioning fungal invasion in maize roots

Affiliations

Single-cell RNA sequencing profiles reveal cell type-specific transcriptional regulation networks conditioning fungal invasion in maize roots

Yanyong Cao et al. Plant Biotechnol J. 2023 Sep.

Abstract

Stalk rot caused by Fusarium verticillioides (Fv) is one of the most destructive diseases in maize production. The defence response of root system to Fv invasion is important for plant growth and development. Dissection of root cell type-specific response to Fv infection and its underlying transcription regulatory networks will aid in understanding the defence mechanism of maize roots to Fv invasion. Here, we reported the transcriptomes of 29 217 single cells derived from root tips of two maize inbred lines inoculated with Fv and mock condition, and identified seven major cell types with 21 transcriptionally distinct cell clusters. Through the weighted gene co-expression network analysis, we identified 12 Fv-responsive regulatory modules from 4049 differentially expressed genes (DEGs) that were activated or repressed by Fv infection in these seven cell types. Using a machining-learning approach, we constructed six cell type-specific immune regulatory networks by integrating Fv-induced DEGs from the cell type-specific transcriptomes, 16 known maize disease-resistant genes, five experimentally validated genes (ZmWOX5b, ZmPIN1a, ZmPAL6, ZmCCoAOMT2, and ZmCOMT), and 42 QTL or QTN predicted genes that are associated with Fv resistance. Taken together, this study provides not only a global view of maize cell fate determination during root development but also insights into the immune regulatory networks in major cell types of maize root tips at single-cell resolution, thus laying the foundation for dissecting molecular mechanisms underlying disease resistance in maize.

Keywords: Fusarium verticillioides; co-expression module; immune regulatory networks; maize stalk rot; scRNA-seq.


Conflict of interest statement

The authors declared that they have no conflict of interest.

Figures
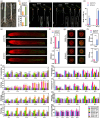
Figure 1
Figure 1
The infection establishment of Fusarium verticillioides (Fv) in maize seedling roots. (a) Images of the longitudinal sections of stalks from resistant (Qi319) and susceptible (B104) maize plants with Fv infection. (b) Comparison of stalk rot resistance in Qi319 and B104 maize plants by calculating the stalk rot score on average (SRSA) and disease severity index (DSI). (c) The rot symptoms of maize seedling roots at 48 hpi with Fv infection. Images in the dashed boxes are magnifications of the diseased root regions that are indicated by red arrows. Scale bars = 2 cm (5 mm in dashed boxes). (d) DSI comparison of Qi319 and B104 at 24 and 48 hpi, respectively. (e–h) The spread of Fv hyphae was monitored by WGA‐AF488 staining at 48 hpi. Staining of the Fv‐inoculated maize roots with WGA‐AF488 results in green‐stained Fv hyphae, whereas staining of cell walls with propidium iodide (PI) results in red color. Observations were performed by staining the 10–12 mm in length and 5 μm in thick longitudinal slitting slices (e) and transverse sections acquired at approximately 7 and 12 mm from the root tips (g), respectively. The longitudinal migration of Fv was evaluated by measuring the distance between the root tip and the hyphae (DTH) advancing frontline (f). The WGA signals of the longitudinal slices (f) and cross sections (h) were evaluated by measuring the area density of the green fluorescence. The area density was indicated as IOD (Integrated Optical Density) per area. Scale bars = 1 mm (e) and 300 μm (g). (i–k) Measurement of physiological and biochemical characters of Qi319 and B104 post Fv inoculation. The Fv and mock (MK)‐inoculated roots (R) and leaves (L) were harvested at 0, 12, 24, 36, and 48 h post‐inoculation, respectively. (i) Contents of hydrogen peroxide (H2O2) (i1) and ROS scavenger proline (i2); (j) Activities of antioxidant enzymes including catalase (CAT) (j1), peroxidase (POD) (j2), superoxide dismutase (SOD) (j3), and polyphenol oxidase (PPO) (j4); (k) Phenylalanine ammonia‐lyase (PAL) activity (k1) and lignin content (k2). Values are mean ± SD. For (b), (d), (f), and (h), *P < 0.05, **P < 0.01, and ***P < 0.001 (paired Student's t‐test). For (i–k), different letters on the columns show a significant difference (P < 0.05) as determined by the Tukey–Kramer test.
Figure 2
Figure 2
Single‐cell RNA‐seq and cluster annotation of cell types in maize root tips. (a) Overview scRNA‐seq of maize root tips and cell type cluster annotation flowchart. Protoplasts were isolated from 5‐mm root tips of maize Qi319 and B104 seedlings at 48 h post‐Fv‐inoculation or mock‐infestation, respectively. The scRNA‐seq libraries were generated using the 10× Genomics platform followed by high‐throughput sequencing. (b) Visualization of 21 cell clusters in maize root tips using t‐SNE. Each dot represents a single cell. Colors represent different cell clusters. (c) Expression patterns of 26 cell cluster‐specific marker genes validated using in situ hybridization. Dot diameter represents the proportion of a given gene expressing in one specific cell cluster, and color represents their relative expression levels in these cell clusters. (d) Expression patterns of 38 representative cell cluster‐specific marker genes in the 21 cell clusters. (e–f) RNA in situ hybridization validation of representative cell type‐specific marker genes for the putative RAM (root apical meristem) and RC (root cap) regions (e), and epidermis, cortex, endodermis, stele, and metaxylem (f) in Qi319 and B104 roots, respectively. Scale bars = 200 μm in (e) and 150 μm in (f). (g) Visualization of seven broad populations and their spatial distribution in maize root tips using t‐SNE.
Figure 3
Figure 3
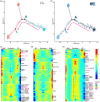
Differentiation trajectories between root apical meristem and root cap in maize roots. (a) Colored pseudotime trajectory of root apical meristem (RAM) and root cap (RC). (b) Distribution of cells on the pseudotime trajectory of RAM and RC. (c–e) Heatmap showing the top 100 significantly changed genes in three branch points during the differentiation trajectory between RAM and RC.
Figure 4
Figure 4
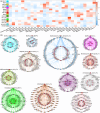
Co‐expression regulatory modules with key gene regulators in seven root cell types in responsive to Fv infection. (a) 16 co‐expression modules associated with each cell type of B104 and Qi319 root tips post Fv infection and mock inoculation. The number in the bracket denotes the number of genes in each module. Red and blue represent high and low correlation coefficient values (Pearson), respectively. M16 denotes an unassigned module. MK, mock; RAM, root apical meristem; RC, root cap. (b) 12 gene regulatory modules harboring key gene regulators in responsive to Fv infection by GENIE3. Each node represents a gene, and genes exhibiting a regulatory relationship are connected with edges. Red color represents Fv‐responsive regulatory modules and key regulators, and other colors represent the predicted target genes regulated by these key regulators. The target genes with annotations are shown using Cytoscape (Table S9). The predicted target genes of five regulatory genes (ZmFNS1, ZmAPX2, INCW1, TUB6, and Zm00001d048667) in Table S7 are not found. The gene regulatory networks of WAT1, Zm00001d032517, Zm00001d016664, Zm00001d048908, and Zm00001d001862 in Table S9 are not shown.
Figure 5
Figure 5
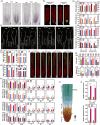
ZmWOX5b and ZmPIN1a suppress Fv invasion in maize RAM via regulating IAA signaling. (a) Transcriptional levels of ZmWOX5b and ZmPIN1a in the RAM of root tips in the enhanced expression transgenic events (WE+ 8‐6 and PE+ 6‐2) and their non‐transgenic ones by RNA in situ hybridization. Scale bars = 205 μm. (b) GFP fluorescence of transgenic seedling roots transformed with ZmWOX5b::GFP and ZmPIN1a::GFP fusion constructs shows their expression in the RAM. Scale bars = 500 μm. (c) The rot symptoms of ZmWOX5b‐ and ZmPIN1a‐transgenic seedling roots (WE+ and PE+ for enhanced expression; WR+ and PR+ for RNAi) at 48 hpi with Fv infection. Images in the dashed boxes are magnifications of the diseased root regions that are indicated by red arrows. Scale bars = 4 cm. (d) Length comparison of primary and seminal roots in ZmWOX5b‐ and ZmPIN1a‐enhanced expression (d1 and d3) and RNAi (d2 and d4) transgenic maize seedlings at 48 hpi. (e) DSI of the ZmWOX5b‐ (e1) and ZmPIN1a‐ (e2) transgenic seedling roots was evaluated and compared at 48 hpi, which was significantly decreased in the WE+ and PE+ plants compared to that in the WR+ and PR+ plants and the transgene‐negative ones (WE, PE, WR, and PR). (f) Fv fungal colonization in the root tips of transgenic seedlings was monitored by WGA‐AF488 staining at 24 hpi. Scale bars = 500 μm. (g) Measurements of Fv hyphal advance distances in the ZmWOX5b‐ and ZmPIN1a‐transgenic seedling roots by measuring the distance between the root tip and the hyphae (DTH) advancing frontline (g1) based on images of longitudinal slices as illustrated in (f). The WGA signals of the longitudinal slices were evaluated by calculating the area density (i.e., IOD) of green fluorescence to shed light on the process of Fv proliferation inside root tips (g2). (h) The enhanced expression of ZmWOX5b and ZmPIN1a increased the IAA content and auxin concentration gradients in maize root tips. Different segments of root tips including RC, RAM, TZ (transition zone), EZ (elongation zone), and MZ (maturation zone) were sampled and used to measure the IAA contents in the ZmWOX5b‐overexpression (h1) and ‐RNAi (h2) lines, and ZmPIN1a‐overexpression (h3) and ‐RNAi (h4) lines by GC‐MS. (i) The cartoon provides a schematic representation of a maize root tip indicating the different segments and IAA concentration gradients. (j) Transcriptional levels of auxin biosynthetic pathway‐related YUC genes in the 5–10 mm region (ZmYUC2) (j1) and 0–5 mm section (ZmYUC6) (j2) of root tips collected from ZmWOX5b enhance‐expression seedlings. For (d), (e), (g), (h), and (j), values are mean ± SD. *P < 0.05, **P < 0.01, and ***P < 0.001 (according to a paired Student's t‐test).
Figure 6
Figure 6
Phenylpropanoid pathway‐related genes participate in Fv defense in several types of root cells. (a–e) Knockdown of expression of phenylpropanoid pathway‐related genes in maize plants through BMV (brome mosaic virus)‐medicated VIGS (virus‐induced gene silencing) facilitates Fv infection. Silencing efficiency and specificity of ZmPAL6 (a1 to a4), ZmCCoAOMT2 (b1, b2), and ZmCOMT (c) in Fv infected leaves and roots were measured at 7 and 14 dpi, respectively. At 7 dpi, the BMV‐GFP and chimeric BMV‐CP5 inoculated cv. Va35 seedlings were challenged with Fv, the inoculated seedling roots were recorded for symptoms in the disease region at 48 hpi (d), and stalk rot DSI for Fv‐inoculated maize seedling roots (e). Scale bars = 4 cm in (d). (f) Transient silencing of ZmPAL6, ZmCOMT, and ZmCCoAOMT2 impairs the lignin accumulation in Fv‐infected maize plants. (g) The histochemical localization of lignin in the ZmPAL6‐, ZmCOMT‐, and ZmCCoAOMT2‐silenced seedling roots after Fv infection. Transverse ultrathin slices were prepared from the lower‐root segments immediately adjacent to the lesions and then subjected to Maüle staining. Red‐purple staining in the cells of hypodermal layers and vascular cylinder indicates the presence of S‐unit lignin. The outermost layer just below the epidermis is stained brown, indicating G‐unit lignin (arrow). Scale bars = 100 μm. (h) The stalk rot DSI of the ZmPAL6‐silenced maize seedling roots that were inoculated with stalk rot fungal pathogens Fusarium proliferatum (Fp) and Pythium aristosporum (Pa) at 48 hpi. (i–j) Knockdown of expression of ZmPAL6 reduced salicylic acid (SA) accumulation and repaired expression of SA‐regulated genes. Samples were harvested from ZmPAL6‐silenced and Fv‐infected maize plants, and BMV‐GFP pre‐inoculated and Fv‐infected plants at 48 hpi and further used to measure SA content (i) and detect expression of pathogenesis‐related (PR) genes (j). For (a–j) except (d and g), values are means ± SD. ***P < 0.001 (according to a paired Student's t‐test) and NS, not significant. Different letters on the columns show significant differences (P < 0.05) (e and f) as determined by Tukey–Kramer test.
Figure 7
Figure 7
Construction of cell type‐specific immune regulatory networks in maize roots. (a) Schematic diagram of transverse and longitudinal sections of maize primary root tip. Different colors of rectangle and circular denote specific cell types and gene co‐expression modules, respectively. Based on our regulatory analyses, known resistance genes and QTL/QTN‐predicted genes that are associated with Fv challenge can be assigned to cell identity or cell type‐specific immunity regulatory networks. (b) The phenylpropanoid pathway‐related immune regulatory network through integrating the M1 (RC_Qi319_MK/Fv), M2 (RC_B104_MK/Fv), and M13 (Epidermis_Qi319_Fv) modules. (c) The cortex‐specific flavonoid pathway‐related immune network based on the M14 (Cortex_Qi319_Fv) module. (d) The immune network of cortex/metaxylem two cell types based on the M9 module (Cortex/Metaxylem_B104_Fv). (e) The stele‐specific immune network based on the M7 module (Stele_B104_MK/Fv‐Qi319_Fv). (f) The crosstalk between the IAA‐mediated disease resistance and SA‐related defense pathways based on the RAM‐specific M6 (RAM_B104_MK/Fv‐Qi319_Fv), metaxylem‐specific M11 (Metaxylem_Qi319_Fv) and M12 (Metaxylem_B104_MK/Fv) modules. (g) The interplay of the M4 (Endodermis_B104_MK/Qi319_Fv) and M5 (RC_Qi319_Fv) modules. Known maize resistance genes, QTL/QTN‐predicted genes (underlined) associated with resistance to Fv and other pathogens, cell types with the top three expression abundance among the seven main cell types, and specific co‐expression modules are indicated with different colors. The pathways or biological functions of known resistance genes are displayed, while the possible pathways or biological functions of QTL/QTN‐predicted genes are labeled by underlining. The known resistance genes‐associated diseases or pathogens are listed in the brackets. The two‐way arrows indicate the known interactions, whereas the double‐way dashed arrows illustrate the interplays predicted by the GENIE3. The details of the abbreviations in this figure are available in Appendix S2.

References

    1. Amorim, L.L.B. , da Fonseca Dos Santos, R. , Neto, J.P.B. , Guida‐Santos, M. , Crovella, S. and Benko‐Iseppon, A.M. (2017) Transcription factors involved in plant resistance to pathogens. Curr. Protein Pept. Sci. 18, 335–351. - PubMed
    1. An, X. , Ma, B. , Duan, M. , Dong, Z. , Liu, R. , Yuan, D. , Hou, Q. et al. (2020) Molecular regulation of ZmMs7 required for maize male fertility and development of a dominant male‐sterility system in multiple species. Proc. Natl. Acad. Sci. USA, 117, 23499–23509. - PMC - PubMed
    1. Campos, M.D. , Félix, M.D.R. , Patanita, M. , Materatski, P. , Albuquerque, A. , Ribeiro, J.A. and Varanda, C. (2022) Defense Strategies: The role of transcription factors in tomato‐pathogen interaction. Biology (Basel), 11, 235. - PMC - PubMed
    1. Chen, H. , Yin, X. , Guo, L. , Yao, J. , Ding, Y. , Xu, X. , Liu, L. et al. (2021) PlantscRNAdb: A database for plant single‐cell RNA analysis. Mol. Plant, 14, 855–857. - PubMed
    1. Cheng, S. , Tan, F. , Lu, Y. , Liu, X. , Li, T. , Yuan, W. , Zhao, Y. et al. (2018) WOX11 recruits a histone H3K27me3 demethylase to promote gene expression during shoot development in rice. Nucleic Acids Res. 46, 2356–2369. - PMC - PubMed

Publication types

Supplementary concepts

LinkOut - more resources