. 2023 Jul 3;16(7):1212-1227.
doi: 10.1016/j.molp.2023.06.004. Epub 2023 Jun 21.

QT-GWAS: A novel method for unveiling biosynthetic loci affecting qualitative metabolic traits

Affiliations

QT-GWAS: A novel method for unveiling biosynthetic loci affecting qualitative metabolic traits

Marlies Brouckaert et al. Mol Plant. .

Abstract

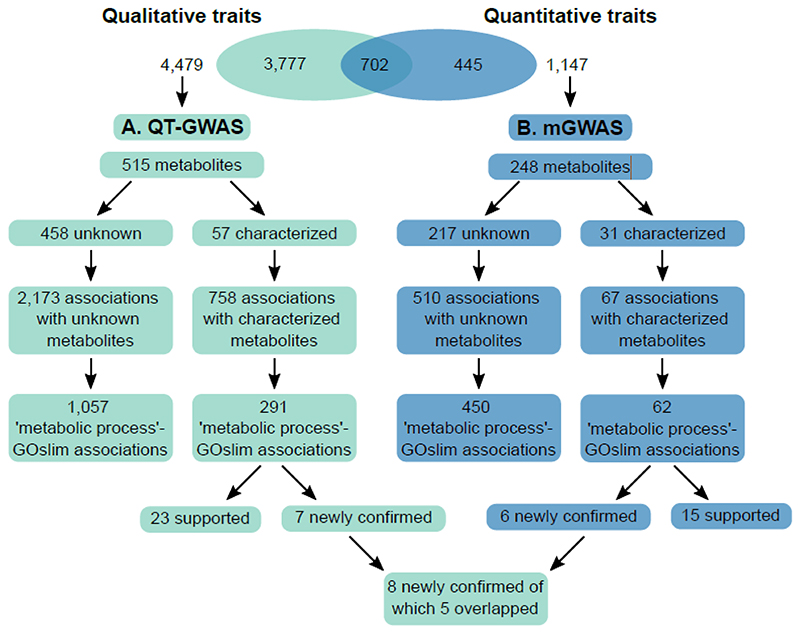
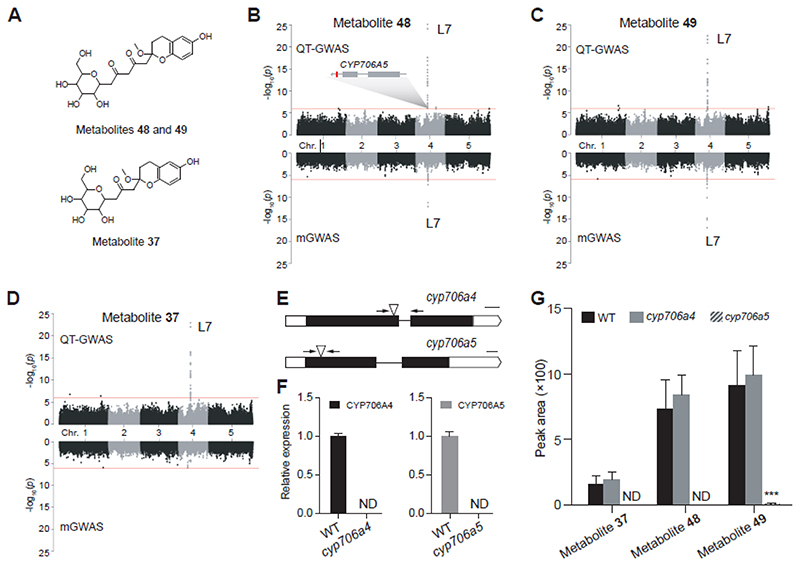
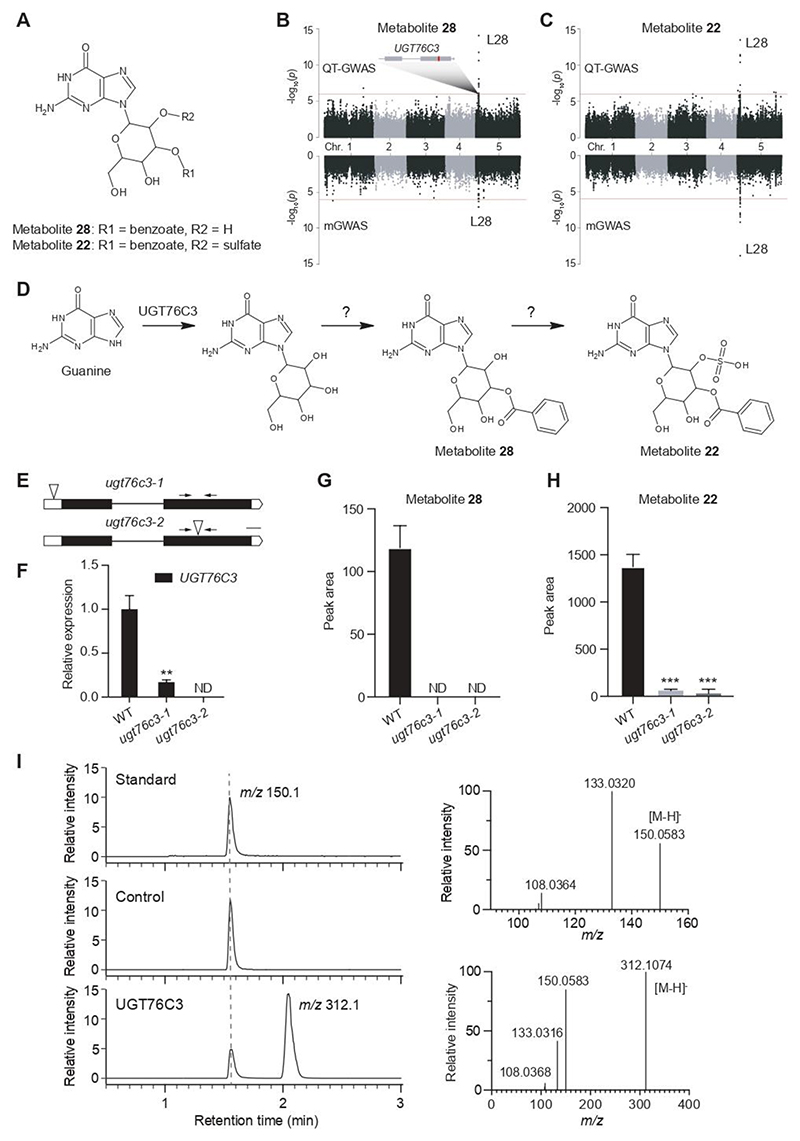
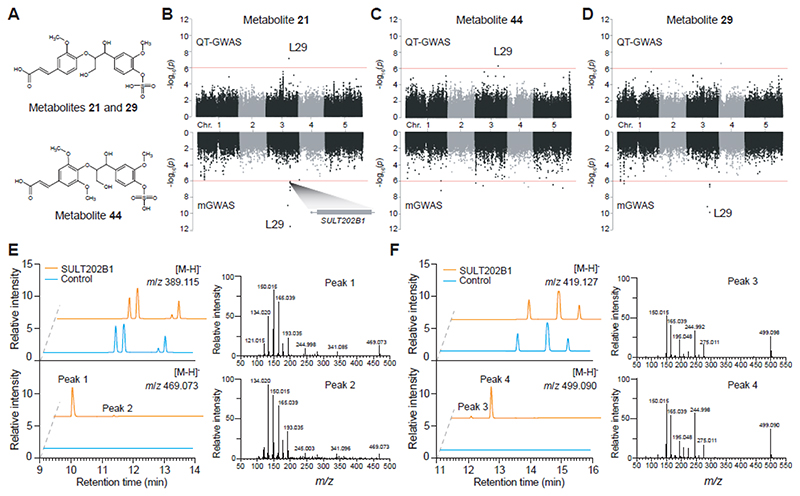
Although the plant kingdom provides an enormous diversity of metabolites with potentially beneficial applications for humankind, a large fraction of these metabolites and their biosynthetic pathways remain unknown. Resolving metabolite structures and their biosynthetic pathways is key to gaining biological understanding and to allow metabolic engineering. In order to retrieve novel biosynthetic genes involved in specialized metabolism, we developed a novel untargeted method designated as qualitative trait GWAS (QT-GWAS) that subjects qualitative metabolic traits to a genome-wide association study, while the conventional metabolite GWAS (mGWAS) mainly considers the quantitative variation of metabolites. As a proof of the validity of QT-GWAS, 23 and 15 of the retrieved associations identified in Arabidopsis thaliana by QT-GWAS and mGWAS, respectively, were supported by previous research. Furthermore, seven gene-metabolite associations retrieved by QT-GWAS were confirmed in this study through reverse genetics combined with metabolomics and/or in vitro enzyme assays. As such, we established that CYTOCHROME P450 706A5 (CYP706A5) is involved in the biosynthesis of chroman derivatives, UDP-GLYCOSYLTRANSFERASE 76C3 (UGT76C3) is able to hexosylate guanine in vitro and in planta, and SULFOTRANSFERASE 202B1 (SULT202B1) catalyzes the sulfation of neolignans in vitro. Collectively, our study demonstrates that the untargeted QT-GWAS method can retrieve valid gene-metabolite associations at the level of enzyme-encoding genes, even new associations that cannot be found by the conventional mGWAS, providing a new approach for dissecting qualitative metabolic traits.


Figures

Figure 1
Figure 1. Schematic overview of the qualitative and quantitative traits and their recorded associations.
A, 4,479 qualitative metabolic traits were used as input for the QT-GWAS. Associations were retrieved for 709 qualitative traits, estimated to correspond to 515 metabolites, of which 57 were characterized and 458 remained unknown. 2,173 associations were retrieved for the unknown metabolites, of which 1,057 involved loci encoding enzymes labeled with ‘metabolic process’-related GOslim categories. The 57 characterized metabolites were involved in 758 associations. In this dataset, 291 loci contained genes labeled with ‘metabolic process’-related GOslim categories. At least 23 of these associations were confirmed or supported by previous research and seven (involving three loci) were newly confirmed in this study. B, 1,147 quantitative traits were used as input for the mGWAS. Associations were retrieved for 288 of estimated to correspond to 248 metabolites. Of these metabolites, 31 were characterized and 217 remained unknown. The unknowns were involved in 510 associations of which 450 encompassed loci containing genes labeled with ‘metabolic process’-related GOslim categories. The 31 characterized metabolites were involved in 67 associations. In this dataset, 62 loci contained genes labeled with ‘metabolic process’-related GOslim categories, of which at least 15 were confirmed or supported by previous research and six (involving 3 loci) were newly confirmed in this study. In total, eight new associations were confirmed in this study of which five overlapped between the two methods.
Figure 2
Figure 2. Distribution plot of the number of associations per metabolite retrieved for the 515 metabolites in the QT-GWAS (blue) and the 248 in the mGWAS (green).
Of the 515 metabolites associated in QT-GWAS, 397 show an association with one locus, 118 with two or more loci. In mGWAS, 223 metabolites showed an association with one locus and 25 to multiple loci.
Figure 3
Figure 3. Overview of the pleiotropic loci (> 10 associations) obtained with the QT-GWAS.
For each locus, the number of associations is represented in dark blue, the negative logarithmic P-value with base 10 (-logP) of the association in green. The dashed line represents the cut-off of ten associations to qualify as a pleiotropic locus. Pleiotropic loci are numbered according to Supplemental Table S3. A locus is defined as the region 10-kb upstream and 10-kb downstream of the most significant SNP (lead SNP) associated with a particular metabolite.
Figure 4
Figure 4. Overview of the CYP706A locus and its associated metabolites.
A: putative structure of associated metabolites 48, 49 and 37. B, C, D: Manhattan plots of metabolites 48, 49 and 37 respectively, for QT-GWAS (upper panel) and mGWAS (lower panel): the x-axis represents the location of the recorded SNPs on the genome, the y-axis represents the negative logarithmic P-value for the association of each SNP to the respective metabolites. E. Schematic representation of CYP706A4 and CYP706A5; intronic regions are represented by a line, exonic regions are indicated in black and UTR regions in white; T-DNA insertion locations of the mutant lines are indicated by the triangles; Scale bar indicates 100 basepair. F. Relative expression of CYP706A4 and CYP706A5 as determined by RT-qPCR, primers are indicated by the arrows. G. Comparative metabolite profiling shows a significant reduction in the abundance of metabolites 37, 48 and 49 in cyp706a5 uniquely. Data are presented as mean ± standard deviation, n = 5; ND, not detected. *** P-value <0.001
Figure 5
Figure 5. Overview of the UGT76C locus and its associated metabolites.
A: putative structure of associated metabolites 28 and 22. The sugar moiety is N-linked, but its exact position and that of the substituents R1 and R2 are unknown. B and C: Manhattan plots of metabolites 28 and 22 respectively, for QT-GWAS (upper panel) and mGWAS (lower panel): the x-axis represents the location of the recorded SNPs on the genome, the y-axis represents the negative logarithmic P-value for the association of each SNP to the respective metabolites. A schematic representation of the candidate gene (UGT76C3) in L28 is shown and the most significantly associated SNP is marked in red within the gene. D. Proposed pathway for the biosynthesis of metabolites 28 and 22 in which UGT76C3 catalyzes the first step, namely the hexosylation of guanine. E. Schematic representation of UGT76C3; intronic regions are represented by a line, exonic regions are indicated in black and UTR regions in white; insertion locations of the mutant lines are indicated by the triangles. F. Relative expression of UGT76C3 as determined by RT-qPCR, primers are indicated by the arrows. G and H. Comparative metabolite profiling shows a significant reduction of metabolites 28 and 22 in both mutant lines. Data are presented as mean ± SD, n = 5; ND, not detected. ***P-value < 0.001, **0.001 < P-value < 0.01. I. In vitro enzyme assays show the conversion of guanine to guanine glucoside in the UGT76C3 reaction exclusively (left panel). GST-tagged RFP was used as negative control. MS/MS spectral data confirmed the characterization of m/z 150.1 as guanine (right upper panel) and m/z 312.1 as guanine glucoside (right lower panel).
Figure 6
Figure 6. Overview of the SULT202B1 locus and its associated metabolites.
A. Putative structure of associated metabolites 21, 29 and 44. The exact position of the sulfate group could not be determined based on MS/MS spectral data. B, C and D: Manhattan plots of metabolites 21, 44 and 29 respectively, for QT-GWAS (upper panel) and mGWAS (lower panel): the x-axis represents the location of the recorded SNPs on the genome, the y-axis represents the negative logarithmic P-value for the association of each SNP to the respective metabolites. The candidate gene (SULT202B1) in L29 is shown. E and F: Chromatograms of in vitro enzymatic reactions of SULT202B1 with chemically synthesized G(8-O-4)FA and G(8-O-4)SA, respectively. GST-tagged RFP was used as negative control. MS/MS spectral data confirmed the characterization of two m/z 469.073 products (peaks 1 and 2) as sulfo-G(8-O-4)FA and two m/z 499.090 products (peaks 3 and 4) as sulfo-G(8-O-4)SA.

References

    1. Allen F, Pon A, Wilson M, Greiner R, Wishart D. CFM-ID: a web server for annotation, spectrum prediction and metabolite identification from tandem mass spectra. Nucleic Acids Res. 2014;42:W94–W99. - PMC - PubMed
    1. Alseekh S, Ofner I, Liu Z, Osorio S, Vallarino J, Last RL, Zamir D, Tohge T, Fernie AR. Quantitative trait loci analysis of seed-specialized metabolites reveals seed-specific flavonols and differential regulation of glycoalkaloid content in tomato. Plant J. 2020;103:2007–2024. - PubMed
    1. Angelovici R, Batushansky A, Deason N, Gonzalez-Jorge S, Gore MA, Fait A, DellaPenna D. Network-guided GWAS improves identification of genes affecting free amino acids. Plant Physiol. 2017;173:872–886. - PMC - PubMed
    1. Arbona V, Gomez-Cadenas A. Metabolomics of disease resistance in crops. Curr Issues Mol Biol. 2016;19:13–30. - PubMed
    1. Barbado C, Córdoba-Cañero D, Ariza RR, Roldán-Arjona T. Nonenzymatic release of N7-methylguanine channels repair of abasic sites into an AP endonuclease-independent pathway inArabidopsis. Proc Natl Acad Sci USA. 2018;115:E916–E924. - PMC - PubMed

Publication types