. 2023 Jun 23:12:e86125.
doi: 10.7554/eLife.86125.

Spatial determination and prognostic impact of the fibroblast transcriptome in pancreatic ductal adenocarcinoma

Affiliations

Spatial determination and prognostic impact of the fibroblast transcriptome in pancreatic ductal adenocarcinoma

Wayne Croft et al. Elife. .

Abstract

Pancreatic ductal adenocarcinoma has a poor clinical outcome and responses to immunotherapy are suboptimal. Stromal fibroblasts are a dominant but heterogenous population within the tumor microenvironment and therapeutic targeting of stromal subsets may have therapeutic utility. Here, we combine spatial transcriptomics and scRNA-Seq datasets to define the transcriptome of tumor-proximal and tumor-distal cancer-associated fibroblasts (CAFs) and link this to clinical outcome. Tumor-proximal fibroblasts comprise large populations of myofibroblasts, strongly expressed podoplanin, and were enriched for Wnt ligand signaling. In contrast, inflammatory CAFs were dominant within tumor-distal subsets and expressed complement components and the Wnt-inhibitor SFRP2. Poor clinical outcome was correlated with elevated HIF-1α and podoplanin expression whilst expression of inflammatory and complement genes was predictive of extended survival. These findings demonstrate the extreme transcriptional heterogeneity of CAFs and its determination by apposition to tumor. Selective targeting of tumor-proximal subsets, potentially combined with HIF-1α inhibition and immune stimulation, may offer a multi-modal therapeutic approach for this disease.

Keywords: NanoString GeoMx; PDAC; cancer biology; cancer-associated fibroblasts; human; pancreatic cancer; tumour microenvironment.

Plain language summary

Pancreatic cancer is one of the deadliest and most difficult cancers to treat. It responds poorly to immunotherapy for instance, despite this approach often succeeding in enlisting immune cells to fight tumours in other organs. This may be due, in part, to a type of cell called fibroblasts. Not only do these wrap pancreatic tumours in a dense, protective layer, they also foster complex relationships with the cancerous cells: some fibroblasts may fuel tumour growth, while other may help to contain its spread. These different roles may be linked to spatial location, with fibroblasts adopting different profiles depending on their proximity with cancer calls. For example, certain fibroblasts close to the tumour resemble the myofibroblasts present in healing wounds, while those at the periphery show signs of being involved in inflammation. Being able to specifically eliminate pro-cancer fibroblasts requires a better understanding of the factors that shape the role of these cells, and how to identify them. To examine this problem, Croft et al. relied on tumour samples obtained from pancreatic cancer patients. They mapped out the location of individual fibroblasts in the vicinity of the tumour and analysed their gene activity. These experiments helped to reveal the characteristics of different populations of fibroblasts. For example, they showed that the myofibroblast-like cells closest to the tumour exhibited signs of oxygen deprivation; they also produced podoplanin, a protein known to promote cancer progression. In contrast, cells further from the cancer produced more immune-related proteins. Combining these data with information obtained from patients’ clinical records, Croft et al. found that samples from individuals with worse survival outcomes often featured higher levels of podoplanin and hypoxia. Inflammatory markers, however, were more likely to be present in individuals with good outcomes. Overall, these findings could help to develop ways to selectively target fibroblasts that support the growth of pancreatic cancer. Weakening these cells could in turn make the tumour accessible to immune cells, and more vulnerable to immunotherapies.


Conflict of interest statement

WC, HP, SM, LL, SN, FZ, DB, FM, SP, BM, RM, JZ, GM, KR, RB, PM No competing interests declared

Figures

Figure 1.
Figure 1.. Schematic representation of experimental approach.
Histological slides of 24 surgical resection specimens from patients with PDAC were stained with DAPI (‘nuclear’), anti-pan-CK (‘epithelial’), anti-α-SMA (‘fibroblast’) and anti-CD45 (‘immune’) to identify tumor cells and primarily to define three domains: ‘tumor-proximal stroma’ (PS), ‘tumor-distant stroma’ (DS) and ‘immune-enriched’ (I). The NanoString Immuno-oncology RNA probe set, in combination with a custom panel of 10 fibroblast-targeted RNA probes, was used to interrogate four areas (termed ‘Regions of Interest’; ROI) from each of the three domains using the NanoString GeoMx Digital Spatial Profiler (DSP) platform. The transcriptional profile of spatially-defined tumor-proximal or tumor-distant fibroblast cells was subsequently aligned to scRNA-Seq datasets from three additional patients with PDAC.
Figure 2.
Figure 2.. Overview of gene expression data from spatially-defined stromal and immune regions within the PDAC tumor microenvironment using NanoString GeoMx DSP.
(A) Expression profile of all endogenous probes across regions of interest (ROI) with hierarchical clustering of ROIs. (B) UMAP embedding from normalized count data showing all ROIs overlaid with ROI-specific annotations of Region (Immune/Stroma/Tumor type) and Survival (1 yr/3 yr). (C) Mean normalized count of cell type marker genes within regions. Lines indicate regions from the same patient; dashed line represents mean background threshold from negative probes; Mean +/-SE of mean shown in red. (D) Differential expression analysis to identift genes expressed differentially between Immune and Stroma ROIs. Colored points indicate differentially expressed genes (DEG) (BH adjusted p<0.05 and absolute log2FC >0.25). (E) Immune and Stroma expression signatures from DEGs identified in D.
Figure 2—figure supplement 1.
Figure 2—figure supplement 1.. Raw count expression profiles.
(A) Heatmap of raw expression profile for the complete probeset (colour scale = raw count). (B) Per patient (scan) expression distributions for PanCK+ (tumor) and PanCK- (non-tumor) regions of interest. (C) Per patient (scan) expression profiles (mean +/-SE) for Endogenous, Housekeeping and Negative control probesets.
Figure 2—figure supplement 2.
Figure 2—figure supplement 2.. Housekeeping gene correlations and data normalisation.
(A) Pairwise correlation scatter plots for 6 housekeeping control probes. Raw housekeeping gene counts from all regions of interest (ROIs) were correlated against each other. Plots display the scatter, distribution histogram and Pearson correlation coefficient and significance (***p<0.001). (B) Relative log expression plots of raw count data and post normalization with the top two most-correlated housekeeping genes (H3F3A and UBB) to remove unwanted variation (RUV method).
Figure 2—figure supplement 3.
Figure 2—figure supplement 3.. Correlation matrix of endogenous probes.
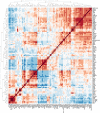
Pairwise correlations of normalized gene count data represented as a matrix of Pearson correlation coefficients.
Figure 2—figure supplement 4.
Figure 2—figure supplement 4.. Individual gene expression profiles on UMAP embeddings of all regions of interest (ROIs).
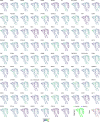
UMAP embedding generated from normalized count data of all probes in all REIs overlaid with ROI-specific normalized gene count.
Figure 2—figure supplement 5.
Figure 2—figure supplement 5.. High level cell type contexture of PDAC tumor microenvironment.
(A) (left), UMAP embedding of transcriptional data for 17,958 cells in the tumor microenvironment of 3 x PDAC patient tissue samples overlaid with high level cell type identified from unsupervised clustering. A (right), UMAP embedding overlaid with source sample identifier. (B) UMAP embedding overlaid with the expression profile of canonical high level cell type marker genes. (C) Average scRNA expression profile of spatial profiling defined Immune and Stroma ROI type-associated genes within high level cell types defined by scRNA-seq (n=3 PDAC samples).
Figure 3.
Figure 3.. Expression signature of PDAC tumor-proximal and tumor-distal stromal cells.
(A) Differentially expressed genes (DEGs) between stroma regions proximal (P) or distal (D) from tumor. Colored points indicate differentially expressed genes (BH adjusted P<0.05 & absolute log2FC >0.25). (B) Stroma proximity-to-tumor expression signature from DEGs identified in A. (C) Relative expression of genes within four PDAC regions: Tumor (T), proximal-tumor stroma (PS), distal-tumor stromal (DS) and immune (I). Lines indicate paired regions from the same patient; dashed line represents mean background threshold from negative probes; Mean +/-SE of mean shown in red. Shown as within patient mean normalized count vs region type for DEG identified in A. (D) Representative immunohistochemical staining of podoplanin, DKK3 and C3 proteins in relation to tumor cells (T) in PDAC tissue.
Figure 3—figure supplement 1.
Figure 3—figure supplement 1.. Correlations of proximity specific markers DKK3 and C3.
Pairwise Pearson correlations of tumor-proximity specific markers C3 and DKK3 against marker genes for Lymphocytes, Monocytes and Fibroblast cells. Coefficients are highlighted where there are significant correlations of either DKK3 or C3 within Proximal (green) or Distant (orange) Stroma ROIs.
Figure 4.
Figure 4.. Proximal and Distal Fibroblast populations identified in single cell transcriptome data of PDAC.
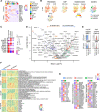
(A) Average expression of spatially defined tumor-proximal or tumor-distant stromal genes within cell types defined by scRNA-seq (n=3). (B) UMAP embedding of scRNA-Seq data from fibroblasts overlaid with (left to right) expression of the canonical fibroblast marker genes DCN, LUM and THY1; COL1A2 found in CAFs; gene set variation analysis (GSVA) signature score for tumor-proximal (DKK3, PDPN, PTENSTAT2, B2 and STAT1) or tumor-distal (STAT3, IL6, C3, VSIR, CD34, CSF1R, THY1, SFRP2) associated stromal genes; Clustering based on unsupervised Louvain assignment. n=229 Fibroblast cells.(C) Average cluster-wise expression profile of selected proximal and distant stroma associated genes as identified by spatial profiling. (D) Differential expression analysis between sc-proximal and sc-distant fibroblast cells. Colored points indicate differentially expressed genes (BH adjusted p<0.05 & absolute log2FC >0.5). (E) Violin plots depicting cluster-wise expression distribution of canonical myCAF and iCAF marker genes. (F) GSVA score profiles identified as differentially enriched (BH adjusted p<0.001) in sc-distant vs sc-proximal cells. (G) Average within-cluster expression profile of Complement, Retinoic acid metabolism and Wnt ligand biogenesis gene sets. Grey = no detectable expression.
Figure 5.
Figure 5.. Survival expression signatures within spatially defined regions of PDAC.
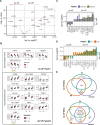
(A) Differential gene expression from all regions in relation to poor (<1 year) or good (3+year) survival. Coloured points indicate differentially expressed genes (BH adjusted p<0.05 and absolute log2FC >0.25). (B) Regional expression of survival-associated genes identified in A. Mean +/-SE of mean. PS = Proximal Stroma; DS = Distant Stroma; I=Immune. (C) 3 yr/1 yr fold change in expression of survival-associated genes within Immune and Stroma regions. (BH adjusted p<0.05 and absolute log2FC >0.25). (D) 3 yr/1 yr fold change in expression of survival-associated genes within Tumor-Proximal and Tumor-Distal regions. (BH adjusted p<0.05 and absolute log2FC >0.25). (E) Venn displaying overlaps of 3 yr vs 1 yr survival DEGs (BH adjusted p<0.05 and absolute log2FC >0.25) within tumor-proximal stroma (PS), tumor-distal stroma (DS) and Immune (I) regions.
Figure 5—figure supplement 1.
Figure 5—figure supplement 1.. Profile of Survival expression signatures within PDAC TME.
(A) Average scRNA expression profile of Survival associated genes within high level cell types of scRNA-seq dataset (n=3). (B) Expression profile of Survival associated genes identified by 3 yr vs 1 yr differential expression analysis. (C) Proximal Stroma (PS): Distant Stroma (DS) ratios stratified by survival outcome for selected genes with significant difference in ratio when stratified by survival.
Figure 6.
Figure 6.. Graphical summary of the transcriptional features of spatially defined regions in the PDAC tumor microenvironment.

Update of

  • doi: 10.1101/2023.01.20.524883

References

    1. Albrengues J, Meneguzzi G, Gaggioli C. Carcinoma-associated fibroblasts in cancer: the great escape. Medecine Sciences. 2014;30:391–397. doi: 10.1051/medsci/20143004012. - DOI - PubMed
    1. Arnold M, Rutherford MJ, Bardot A, Ferlay J, Andersson TM-L, Myklebust TÅ, Tervonen H, Thursfield V, Ransom D, Shack L, Woods RR, Turner D, Leonfellner S, Ryan S, Saint-Jacques N, De P, McClure C, Ramanakumar AV, Stuart-Panko H, Engholm G, Walsh PM, Jackson C, Vernon S, Morgan E, Gavin A, Morrison DS, Huws DW, Porter G, Butler J, Bryant H, Currow DC, Hiom S, Parkin DM, Sasieni P, Lambert PC, Møller B, Soerjomataram I, Bray F. Progress in cancer survival, mortality, and incidence in seven high-income countries 1995-2014 (ICBP SURVMARK-2): a population-based study. The Lancet. Oncology. 2019;20:1493–1505. doi: 10.1016/S1470-2045(19)30456-5. - DOI - PMC - PubMed
    1. Augsten M, Sjöberg E, Frings O, Vorrink SU, Frijhoff J, Olsson E, Borg Å, Östman A. Cancer-associated fibroblasts expressing CXCL14 rely upon NOS1-derived nitric oxide signaling for their tumor-supporting properties. Cancer Research. 2014;74:2999–3010. doi: 10.1158/0008-5472.CAN-13-2740. - DOI - PubMed
    1. Bhattacharya A, Hamilton AM, Furberg H, Pietzak E, Purdue MP, Troester MA, Hoadley KA, Love MI. An approach for normalization and quality control for nanostring RNA expression data. Briefings in Bioinformatics. 2021;22:bbaa163. doi: 10.1093/bib/bbaa163. - DOI - PMC - PubMed
    1. Biffi G, Oni TE, Spielman B, Hao Y, Elyada E, Park Y, Preall J, Tuveson DA. IL1-induced JAK/STAT signaling is antagonized by TGFβ to shape CAF heterogeneity in pancreatic ductal adenocarcinoma. Cancer Discovery. 2019;9:282–301. doi: 10.1158/2159-8290.CD-18-0710. - DOI - PMC - PubMed

Publication types

Associated data