

Covid-19 affects taste independent of taste-smell confusions: results from a combined chemosensory home test and online survey from a large global cohort
- PMID: 37350646
- PMCID: PMC10396355
- DOI: 10.1093/chemse/bjad020
Covid-19 affects taste independent of taste-smell confusions: results from a combined chemosensory home test and online survey from a large global cohort
Abstract
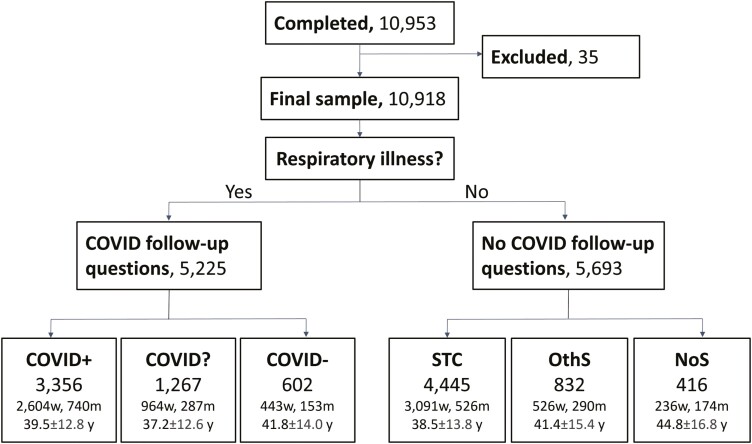
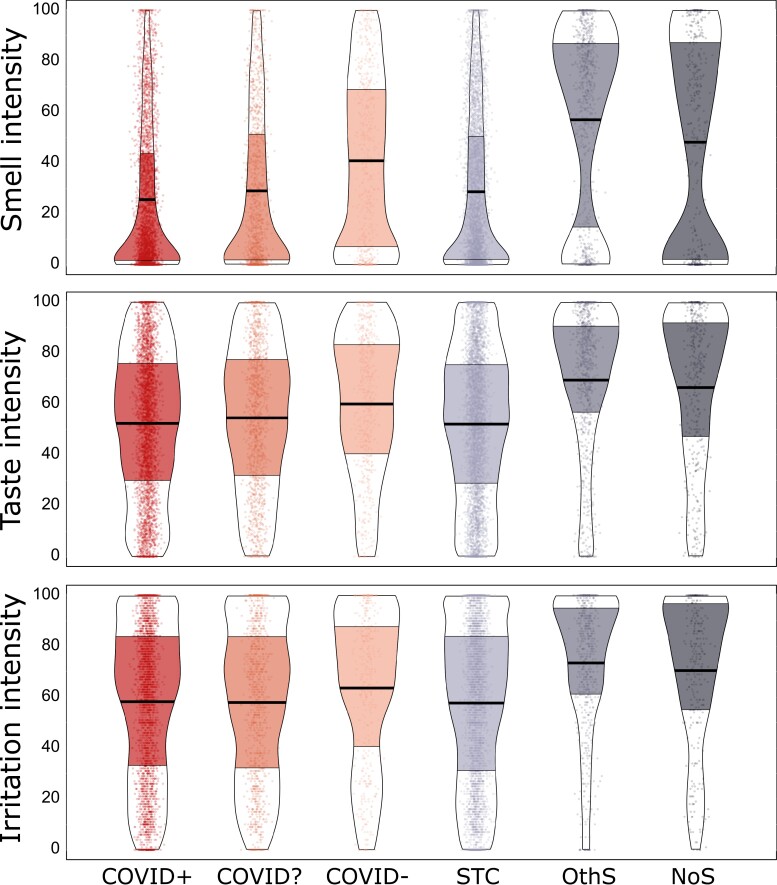
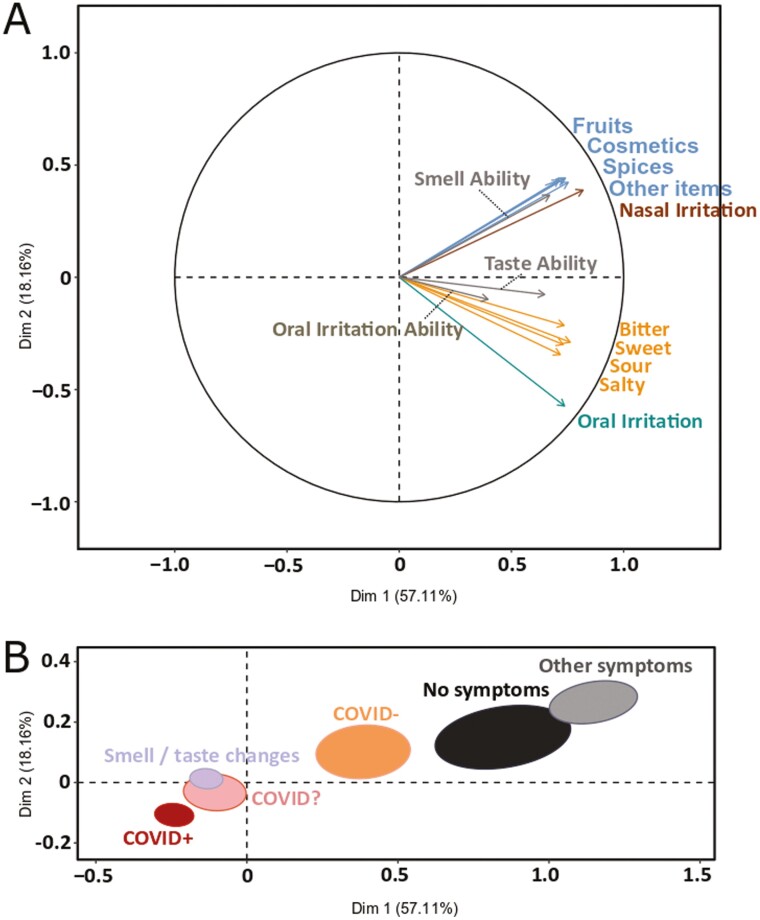
People often confuse smell loss with taste loss, so it is unclear how much gustatory function is reduced in patients self-reporting taste loss. Our pre-registered cross-sectional study design included an online survey in 12 languages with instructions for self-administering chemosensory tests with 10 household items. Between June 2020 and March 2021, 10,953 individuals participated. Of these, 5,225 self-reported a respiratory illness and were grouped based on their reported COVID test results: COVID-positive (COVID+, N = 3,356), COVID-negative (COVID-, N = 602), and COVID unknown for those waiting for a test result (COVID?, N = 1,267). The participants who reported no respiratory illness were grouped by symptoms: sudden smell/taste changes (STC, N = 4,445), other symptoms excluding smell or taste changes (OthS, N = 832), and no symptoms (NoS, N = 416). Taste, smell, and oral irritation intensities and self-assessed abilities were rated on visual analog scales. Compared to the NoS group, COVID+ was associated with a 21% reduction in taste (95% confidence interval (CI): 15-28%), 47% in smell (95% CI: 37-56%), and 17% in oral irritation (95% CI: 10-25%) intensity. There were medium to strong correlations between perceived intensities and self-reported abilities (r = 0.84 for smell, r = 0.68 for taste, and r = 0.37 for oral irritation). Our study demonstrates that COVID-19-positive individuals report taste dysfunction when self-tested with stimuli that have little to none olfactory components. Assessing the smell and taste intensity of household items is a promising, cost-effective screening tool that complements self-reports and may help to disentangle taste loss from smell loss. However, it does not replace standardized validated psychophysical tests.
Keywords: ageusia; anosmia; chemesthesis; gustation; olfaction; taste–smell confusion.
© The Author(s) 2023. Published by Oxford University Press. All rights reserved. For permissions, please e-mail: journals.permissions@oup.com.
Conflict of interest statement
J.E.H. holds equity in Redolynt, LLC, which he co-founded in 2021. This company was granted an option to license technology covered by a provisional patent application filed jointly by the Pennsylvania State University, the University of Florida, and Arizona State University. This financial interest has been reviewed by the Conflict Interest Committee at Penn State and is subject to an active management plan. Redolynt has no direct involvement in the present work. K.O. is currently employed by dsm-firmenich; the company had no influence on the study design or interpretation of the results.
Figures
Update of
-
Covid-19 affects taste independently of smell: results from a combined chemosensory home test and online survey from a global cohort (N=10,953).medRxiv [Preprint]. 2023 Jan 18:2023.01.16.23284630. doi: 10.1101/2023.01.16.23284630. medRxiv. 2023. Update in: Chem Senses. 2023 Jan 1;48:bjad020. doi: 10.1093/chemse/bjad020. PMID: 36711499 Free PMC article. Updated. Preprint.
Similar articles
-
Covid-19 affects taste independently of smell: results from a combined chemosensory home test and online survey from a global cohort (N=10,953).medRxiv [Preprint]. 2023 Jan 18:2023.01.16.23284630. doi: 10.1101/2023.01.16.23284630. medRxiv. 2023. Update in: Chem Senses. 2023 Jan 1;48:bjad020. doi: 10.1093/chemse/bjad020. PMID: 36711499 Free PMC article. Updated. Preprint.
-
Association of chemosensory dysfunction and COVID-19 in patients presenting with influenza-like symptoms.Int Forum Allergy Rhinol. 2020 Jul;10(7):806-813. doi: 10.1002/alr.22579. Epub 2020 Jun 1. Int Forum Allergy Rhinol. 2020. PMID: 32279441 Free PMC article.
-
Prevalence of Chemosensitive Neurological Disorders of Smell and Taste and Association with Blood Groups in SARS-CoV-2 Patients: Cross-Sectional Study.Viruses. 2023 May 30;15(6):1277. doi: 10.3390/v15061277. Viruses. 2023. PMID: 37376577 Free PMC article.
-
The role of self-reported smell and taste disorders in suspected COVID‑19.Eur Arch Otorhinolaryngol. 2020 Sep;277(9):2625-2630. doi: 10.1007/s00405-020-06069-6. Epub 2020 May 23. Eur Arch Otorhinolaryngol. 2020. PMID: 32447496 Free PMC article.
-
Taste and smell as chemosensory dysfunctions in COVID-19 infection.Am J Dent. 2020 Jun;33(3):135-137. Am J Dent. 2020. PMID: 32470238
Cited by
-
Neurological Impact of SARS-CoV-2 Changing Variants: A 4-Year DW-MRI Study on Olfactory and Taste-Related Brain Regions.Int J Mol Sci. 2025 Mar 29;26(7):3164. doi: 10.3390/ijms26073164. Int J Mol Sci. 2025. PMID: 40243943 Free PMC article.
-
Transient loss and recovery of oral chemesthesis, taste and smell with COVID-19: A small case-control series.Physiol Behav. 2023 Nov 1;271:114331. doi: 10.1016/j.physbeh.2023.114331. Epub 2023 Aug 16. Physiol Behav. 2023. PMID: 37595820 Free PMC article.
-
Evaluation of Olfactory Dysfunction Among COVID-19 Patients in Baghdad, Iraq.Cureus. 2024 Feb 6;16(2):e53721. doi: 10.7759/cureus.53721. eCollection 2024 Feb. Cureus. 2024. PMID: 38455837 Free PMC article.
-
Transient loss and recovery of oral chemesthesis, taste and smell with COVID-19: a small case-control series.medRxiv [Preprint]. 2023 Mar 29:2023.03.27.23287763. doi: 10.1101/2023.03.27.23287763. medRxiv. 2023. Update in: Physiol Behav. 2023 Nov 1;271:114331. doi: 10.1016/j.physbeh.2023.114331. PMID: 37034638 Free PMC article. Updated. Preprint.
-
Mechanisms of COVID-19-associated olfactory dysfunction.Neuropathol Appl Neurobiol. 2024 Apr;50(2):e12960. doi: 10.1111/nan.12960. Neuropathol Appl Neurobiol. 2024. PMID: 38419211 Free PMC article. Review.
References
-
- Ai Y, Han P.. Neurocognitive mechanisms of odor-induced taste enhancement: a systematic review. Int J Gastron Food Sci. 2022:28:100535. doi:10.1016/j.ijgfs.2022.100535 - DOI
-
- Brislin RW. Back-translation for cross-cultural research. J Cross-Cult Psychol. 1970:1(3):185–216. doi:10.1177/135910457000100301. - DOI
Publication types
MeSH terms
Grants and funding
LinkOut - more resources
Full Text Sources
Medical
