. 2023 Sep 1;83(17):2873-2888.
doi: 10.1158/0008-5472.CAN-23-0356.

Preexisting Immunity Drives the Response to Neoadjuvant Chemotherapy in Esophageal Adenocarcinoma

Affiliations

Preexisting Immunity Drives the Response to Neoadjuvant Chemotherapy in Esophageal Adenocarcinoma

Giuseppina Arbore et al. Cancer Res. .

Abstract

Current treatment for patients with locally advanced esophageal adenocarcinoma (EAC) is neoadjuvant chemotherapy (nCT), alone or combined with radiotherapy, before surgery. However, fewer than 30% of treated patients show a pathologic complete response to nCT, which correlates with increased 5-year survival compared with nonresponders. Understanding the mechanisms of response to nCT is pivotal to better stratify patients and inform more efficacious therapies. Here, we investigated the immune mechanisms involved in nCT response by multidimensional profiling of pretreatment tumor biopsies and blood from 68 patients with EAC (34 prospectively and 34 retrospectively collected), comparing complete responders versus nonresponders to nCT. At the tumor level, complete response to nCT was associated with molecular signatures of immune response and proliferation, increased putative antitumor tissue-resident memory CD39+ CD103+ CD8+ T cells, and reduced immunosuppressive T regulatory cells (Treg) and M2-like macrophages. Systemically, complete responders showed higher frequencies of immunostimulatory CD14+ CD11c+ HLA-DRhigh cells, and reduced programmed cell death ligand 1-positive (PD-L1+) monocytic myeloid-derived suppressor cells, along with high plasma GM-CSF (proinflammatory) and low IL4, CXCL10, C3a, and C5a (suppressive). Plasma proinflammatory and suppressive cytokines correlated directly and inversely, respectively, with the frequency of tumor-infiltrating CD39+ CD103+ CD8+ T cells. These results suggest that preexisting immunity in baseline tumor drives the clinical activity of nCT in locally advanced EAC. Furthermore, it may be possible to stratify patients based on predictive immune signatures, enabling tailored neoadjuvant and/or adjuvant regimens.

Significance: Multidimensional profiling of pretreatment esophageal adenocarcinoma shows patient response to nCT is correlated with active preexisting immunity and indicates molecular pathways of resistance that may be targeted to improve clinical outcomes.


Figures

None
Graphical abstract
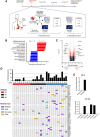
Figure 1. Baseline higher immune gene signatures and reduced resistance to stress are associated with response to nCT. A, Schematic overview of the study design showing our multidimensional analysis of pre-nCT tumor biopsies (WES, RNA-seq, IHC, proteome DSP, and flow cytometry analysis) and blood (flow cytometry analysis, plasma cytokines) collected prospectively from patients diagnosed with locally advanced EAC (n = 34); an additional cohort of archived pretreatment EAC tumors (n = 34) was analyzed by IHC and DSP. B, Hallmark GSEA comparison of CRs (n = 9) versus NRs (n = 9) showing normalized enrichment scores for gene sets with FDR < 0.01. C, Volcano plot of genes enriched in CRs versus NRs from bulk RNA-seq. The volcano plot reports the name of genes selected on the basis of their participation in pathways differentially enriched in GSEA analysis, as discussed in the Results section. D, Oncoplot of somatic mutations in Reactome pathway MHC class I antigen processing and presentation genes, with respective percentages of mutated genes for each EAC sample. E, HLA LOH events represented as imbalanced HLA copy numbers observed in two patients, N 20 (PR) and N 8 (NR).
Figure 1.
Baseline higher immune gene signatures and reduced resistance to stress are associated with response to nCT. A, Schematic overview of the study design showing our multidimensional analysis of pre-nCT tumor biopsies (WES, RNA-seq, IHC, proteome DSP, and flow cytometry analysis) and blood (flow cytometry analysis, plasma cytokines) collected prospectively from patients diagnosed with locally advanced EAC (n = 34); an additional cohort of archived pretreatment EAC tumors (n = 34) was analyzed by IHC and DSP. B, Hallmark GSEA comparison of CRs (n = 9) versus NRs (n = 9) showing normalized enrichment scores for gene sets with FDR < 0.01. C, Volcano plot of genes enriched in CRs versus NRs from bulk RNA-seq. The volcano plot reports the name of genes selected on the basis of their participation in pathways differentially enriched in GSEA analysis, as discussed in the Results section. D, Oncoplot of somatic mutations in Reactome pathway MHC class I antigen processing and presentation genes, with respective percentages of mutated genes for each EAC sample. E, HLA LOH events represented as imbalanced HLA copy numbers observed in two patients, N 20 (PR) and N 8 (NR).
Figure 2. Increased baseline infiltration of FOXP3+ and CD163+ cells in EACs of NRs is associated with reduced OS. A, CIBERSORT scores for EAC-infiltrating immune cell populations were calculated from RNA-seq data for CRs, PRs, and NRs. Bar graphs represent mean ± SEM. *, P <0.05; **, P <0.01; one-way ANOVA. NV B, naïve B; ME B, memory B; P, plasma cells; CD8, CD8+; NV CD4, naïve CD4+; ME CD4 R, memory CD4+ resting; ME CD4 A, memory CD4+ activated; TFH, follicular T helper; γδT, gamma delta T; NK R, natural killer resting; NK A, natural killer activated; MONO, monocytes; M0, M0 macrophages; M1, M1 macrophages; M2, M2 macrophages; DC R, dendritic cells resting; DC A, dendritic cells activated; MC R, mast cells resting; MC A, mast cells activated; EO, eosinophils; NEU, neutrophils. B, Representative immunostaining of pretreatment EACs for FOXP3, CD163, and CD45RO. Scale bar, 50 μm. C, Staining scores for intratumoral (intra Tum) and peritumoral regions (peri Tum) in CRs (n = 15), PRs (n = 16), and NRs (n = 33). Semiquantitative h scores (0 = no staining to 3 = strongest staining) were assigned by an expert pathologist. Data are presented as mean ± SEM. *, P <0.05; one-way ANOVA. D, OS of patients with high versus low FOXP3 IHC staining scores in intratumor EAC infiltrates before neoadjuvant chemotherapy (high score, h ≥ 1; low score, h < 1). *, P <0.05; log-rank test. E and F, OS of patients with high versus low CD163 IHC staining scores in peritumoral (E) and intratumoral (F) EAC infiltrates before neoadjuvant chemotherapy (high score, h ≥ 2; low score, h < 2). *, P < 0.05; **, P < 0.01; log-rank test.
Figure 2.
Increased baseline infiltration of FOXP3+ and CD163+ cells in EACs of NRs is associated with reduced OS. A, CIBERSORT scores for EAC-infiltrating immune cell populations were calculated from RNA-seq data for CRs, PRs, and NRs. Bar graphs represent mean ± SEM. *, P <0.05; **, P <0.01; one-way ANOVA. NV B, naïve B; ME B, memory B; P, plasma cells; CD8, CD8+; NV CD4, naïve CD4+; ME CD4 R, memory CD4+ resting; ME CD4 A, memory CD4+ activated; TFH, follicular T helper; γδT, gamma delta T; NK R, natural killer resting; NK A, natural killer activated; MONO, monocytes; M0, M0 macrophages; M1, M1 macrophages; M2, M2 macrophages; DC R, dendritic cells resting; DC A, dendritic cells activated; MC R, mast cells resting; MC A, mast cells activated; EO, eosinophils; NEU, neutrophils. B, Representative immunostaining of pretreatment EACs for FOXP3, CD163, and CD45RO. Scale bar, 50 μm. C, Staining scores for intratumoral (intra Tum) and peritumoral regions (peri Tum) in CRs (n = 15), PRs (n = 16), and NRs (n = 33). Semiquantitative h scores (0 = no staining to 3 = strongest staining) were assigned by an expert pathologist. Data are presented as mean ± SEM. *, P <0.05; one-way ANOVA. D, OS of patients with high versus low FOXP3 IHC staining scores in intratumor EAC infiltrates before neoadjuvant chemotherapy (high score, h ≥ 1; low score, h < 1). *, P <0.05; log-rank test. E and F, OS of patients with high versus low CD163 IHC staining scores in peritumoral (E) and intratumoral (F) EAC infiltrates before neoadjuvant chemotherapy (high score, h ≥ 2; low score, h < 2). *, P < 0.05; **, P < 0.01; log-rank test.
Figure 3. DSP confirms distinct baseline functional immune contexture in EACs of CRs and NRs. A, Experimental design: spatial proteomic profiling of 53 tumor and immune markers was conducted on FFPE EAC biopsy sections; selection of multiple ROIs per tissue sample was based on immunofluorescent staining for PanCK (tumor epithelial marker), CD68 (macrophages), and CD3 (T lymphocytes); nuclei were stained with 4',6-diamidino-2-phenylindole (DAPI). Protein counts were measured within PanCK+-enriched tumor regions (masks) and PanCK− stromal regions (inverted masks). B, Volcano plot of proteins enriched in PanCK+ (n = 72) versus PanCK− (n = 72) areas showing statistical significance for proteins with P < 0.05; P values were calculated using the linear mixed model. C, Representative immunofluorescent staining for PanCK, CD68, and CD3 in tumor tissue from CRs and NRs. Scale bar, 100 μm. D, CD3 PanCK+/PanCK− ratios for each ROI (normalized by area) for CRs and NRs (calculated from DSP reads). *, P <0.05, unpaired t test. E and G, Volcano plots of proteins enriched in PanCK− (E) and PanCK+ (G) areas in tumors from CRs (n = 33 ROIs) versus NRs (n = 39 ROIs), showing statistical significance for proteins with P <0.05; P values were calculated using the linear mixed model. F and H, Corresponding box plots representing read numbers (N) normalized to the area for proteins differentially enriched in PanCK− (F) and PanCK+ areas (H), presented as mean ± SEM. *, P < 0.05; **, P < 0.01, unpaired t test.
Figure 3.
DSP confirms distinct baseline functional immune contexture in EACs of CRs and NRs. A, Experimental design: spatial proteomic profiling of 53 tumor and immune markers was conducted on FFPE EAC biopsy sections; selection of multiple ROIs per tissue sample was based on immunofluorescent staining for PanCK (tumor epithelial marker), CD68 (macrophages), and CD3 (T lymphocytes); nuclei were stained with 4',6-diamidino-2-phenylindole (DAPI). Protein counts were measured within PanCK+-enriched tumor regions (masks) and PanCK stromal regions (inverted masks). B, Volcano plot of proteins enriched in PanCK+ (n = 72) versus PanCK (n = 72) areas showing statistical significance for proteins with P < 0.05; P values were calculated using the linear mixed model. C, Representative immunofluorescent staining for PanCK, CD68, and CD3 in tumor tissue from CRs and NRs. Scale bar, 100 μm. D, CD3 PanCK+/PanCK ratios for each ROI (normalized by area) for CRs and NRs (calculated from DSP reads). *, P <0.05, unpaired t test. E and G, Volcano plots of proteins enriched in PanCK (E) and PanCK+ (G) areas in tumors from CRs (n = 33 ROIs) versus NRs (n = 39 ROIs), showing statistical significance for proteins with P <0.05; P values were calculated using the linear mixed model. F and H, Corresponding box plots representing read numbers (N) normalized to the area for proteins differentially enriched in PanCK (F) and PanCK+ areas (H), presented as mean ± SEM. *, P < 0.05; **, P < 0.01, unpaired t test.
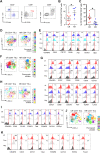
Figure 4. Responder EACs show reduced baseline infiltration of FOXP3+ Tregs and an increased frequency of tissue-resident CD8+CD39+ T cells. A, Representative flow cytometry plots of tumor single-cell suspensions (CD3+ viable cells) stained for nine surface markers, showing the gating strategy for CD25+ CD127low Tregs and CD8+ CD39+ CD103+ T cells. B and C, Dot plots showing frequencies expressed as percentage of CD25+ CD127low CD4+ cells (B) and CD39+ CD103+ CD8+ cells (C) in pretreatment EAC tumor cell suspensions from CRs (n = 9) and NRs (n = 6), determined by manual gating. Data are presented as mean ± SEM. *, P < 0.05, unpaired t test. D, Exemplified t-SNE visualization of 17 surface markers representing 6,000 merged CD3+ CD4+ cells in tumor cell suspensions from CRs (n = 3) and NRs (n = 3); 13 clusters were predicted by unsupervised PhenoGraph analysis. E, Histograms showing the expression of six surface markers in clusters #4 and #5, concatenated CD3+ CD4+ events (Conc), and negative control (Neg); relative fluorescence intensity (RFI) values are shown. F, Exemplified t-SNE visualization of 17 surface markers representing 6,000 merged CD3+ CD8+ cells in tumor cell suspensions from CRs (n = 3) and NRs (n = 3); 11 clusters were predicted by unsupervised PhenoGraph analysis. G, Histograms showing the expression (RFI values) of 12 surface markers in clusters #1 and #2, concatenated CD3+ CD8+ events, and negative control. H, Exemplified t-SNE visualization of eight markers, including three surface markers and five nuclear transcription factors, representing 6,000 merged CD3+ CD4+ cells in tumor cell suspensions from CRs (n = 3) and NRs (n = 3); nine clusters were predicted by unsupervised PhenoGraph analysis. I, Histograms showing the expression (RFI values) of seven markers in cluster #6, (CD25+ CD127low FOXP3+ Treg-like cells), concatenated CD3+ CD4+ events, and negative control. J, Exemplified t-SNE visualization of 8 markers (three surface markers and five nuclear transcription factors), representing 6,000 merged CD3+ CD4− cells in tumor cell suspensions from CRs (n = 3) and NRs (n = 3); nine clusters were predicted by unsupervised PhenoGraph analysis. K, Histograms showing the expression (RFI values) of eight markers in cluster #3, concatenated CD3+ CD4− events, and negative control.
Figure 4.
Responder EACs show reduced baseline infiltration of FOXP3+ Tregs and an increased frequency of tissue-resident CD8+CD39+ T cells. A, Representative flow cytometry plots of tumor single-cell suspensions (CD3+ viable cells) stained for nine surface markers, showing the gating strategy for CD25+ CD127low Tregs and CD8+ CD39+ CD103+ T cells. B and C, Dot plots showing frequencies expressed as percentage of CD25+ CD127low CD4+ cells (B) and CD39+ CD103+ CD8+ cells (C) in pretreatment EAC tumor cell suspensions from CRs (n = 9) and NRs (n = 6), determined by manual gating. Data are presented as mean ± SEM. *, P < 0.05, unpaired t test. D, Exemplified t-SNE visualization of 17 surface markers representing 6,000 merged CD3+ CD4+ cells in tumor cell suspensions from CRs (n = 3) and NRs (n = 3); 13 clusters were predicted by unsupervised PhenoGraph analysis. E, Histograms showing the expression of six surface markers in clusters #4 and #5, concatenated CD3+ CD4+ events (Conc), and negative control (Neg); relative fluorescence intensity (RFI) values are shown. F, Exemplified t-SNE visualization of 17 surface markers representing 6,000 merged CD3+ CD8+ cells in tumor cell suspensions from CRs (n = 3) and NRs (n = 3); 11 clusters were predicted by unsupervised PhenoGraph analysis. G, Histograms showing the expression (RFI values) of 12 surface markers in clusters #1 and #2, concatenated CD3+ CD8+ events, and negative control. H, Exemplified t-SNE visualization of eight markers, including three surface markers and five nuclear transcription factors, representing 6,000 merged CD3+ CD4+ cells in tumor cell suspensions from CRs (n = 3) and NRs (n = 3); nine clusters were predicted by unsupervised PhenoGraph analysis. I, Histograms showing the expression (RFI values) of seven markers in cluster #6, (CD25+ CD127low FOXP3+ Treg-like cells), concatenated CD3+ CD4+ events, and negative control. J, Exemplified t-SNE visualization of 8 markers (three surface markers and five nuclear transcription factors), representing 6,000 merged CD3+ CD4 cells in tumor cell suspensions from CRs (n = 3) and NRs (n = 3); nine clusters were predicted by unsupervised PhenoGraph analysis. K, Histograms showing the expression (RFI values) of eight markers in cluster #3, concatenated CD3+ CD4 events, and negative control.
Figure 5. NR EACs show increased baseline infiltration of protumor M2-like macrophages. A, Exemplified tSNE visualization of 20 surface markers representing 7,000 merged CD45+ CD3− tumor cells from CRs (n = 3) and NRs (n = 4); cells are colored according to the 10 clusters assigned by PhenoGraph and manual annotation; the corresponding heatmap shows median marker intensity normalized to a 0 to 1 range. B, Frequencies of the clusters in CR (n = 3) and NR (n = 4) CD45+ CD3− cells presented as mean ± SEM. *, P < 0.05; one-way ANOVA. C, Histograms showing the expression of six surface markers in cluster #3 (assigned as M2-like macrophages), concatenated CD45+ CD3− events (Conc), and negative control (Neg) relative fluorescence intensity (RFI) values are shown.
Figure 5.
NR EACs show increased baseline infiltration of protumor M2-like macrophages. A, Exemplified tSNE visualization of 20 surface markers representing 7,000 merged CD45+ CD3 tumor cells from CRs (n = 3) and NRs (n = 4); cells are colored according to the 10 clusters assigned by PhenoGraph and manual annotation; the corresponding heatmap shows median marker intensity normalized to a 0 to 1 range. B, Frequencies of the clusters in CR (n = 3) and NR (n = 4) CD45+ CD3 cells presented as mean ± SEM. *, P < 0.05; one-way ANOVA. C, Histograms showing the expression of six surface markers in cluster #3 (assigned as M2-like macrophages), concatenated CD45+ CD3 events (Conc), and negative control (Neg) relative fluorescence intensity (RFI) values are shown.
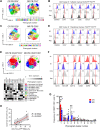
Figure 6. Increased frequency of circulating exhausted T cells and myeloid-derived suppressor MDSC cells in NRs to nCT prior to treatment. A, Exemplified t-SNE visualization of 17 surface markers representing 32,000 merged CD3+ CD4+ cells PBMCs from CRs (n = 8) and NRs (n = 8) before nCT; 18 clusters were predicted by unsupervised PhenoGraph analysis. B, Histograms showing the expression of six markers in cluster #6 (T effector memory KLRG1high PD-1high), concatenated CD3+ CD4+ events (Conc), and negative control (Neg); relative fluorescence intensity (RFI) values are shown. C, Exemplified t-SNE visualization of 17 surface markers representing 16,000 merged CD3+CD8+ pre-nCT PBMCs from CRs (n = 8) and NRs (n = 8); 14 clusters were predicted by unsupervised PhenoGraph analysis. D, Histograms showing the expression (RFI values) of six markers in cluster #8 (T transitional memory TIGIThigh PD-1high), concatenated CD3+ CD8+ events (Conc), and negative control (Neg). E, Exemplified t-SNE visualization of 20 surface markers representing 15,000 merged CD45+ CD3− pre-nCT PBMCs from CRs (n = 7) and NRs (n = 8). Cells are colored according to the 11 clusters assigned by PhenoGraph and manual annotation; the corresponding heat map shows median marker intensity normalized to a 0 to 1 range. F, Histograms showing the expression (RFI values) of five surface markers in PhenoGraph clusters #1 and #4, concatenated CD45+ CD3− events, and Neg; clusters #1 and #4 were assigned as monocytes HLA-DRhigh (enriched in CRs) and MO-MDSC CCR7+ (enriched in NRs), respectively. G, Frequencies of CD45+CD3− cells in 11 PhenoGraph clusters (determined by 20 surface markers) in CRs (n = 7) and NRs (n = 8), presented as mean ± SEM. **, P < 0.01; one-way ANOVA. H, Correlation between the flow cytometry frequency (%) of CD14+HLA-DRhigh PBMCs and CD39+CD103+CD8+ TILs for n = 12 patients; 95% confidence interval is shaded in gray (R, Spearman correlation; P value).
Figure 6.
Increased frequency of circulating exhausted T cells and myeloid-derived suppressor MDSC cells in NRs to nCT prior to treatment. A, Exemplified t-SNE visualization of 17 surface markers representing 32,000 merged CD3+ CD4+ cells PBMCs from CRs (n = 8) and NRs (n = 8) before nCT; 18 clusters were predicted by unsupervised PhenoGraph analysis. B, Histograms showing the expression of six markers in cluster #6 (T effector memory KLRG1high PD-1high), concatenated CD3+ CD4+ events (Conc), and negative control (Neg); relative fluorescence intensity (RFI) values are shown. C, Exemplified t-SNE visualization of 17 surface markers representing 16,000 merged CD3+CD8+ pre-nCT PBMCs from CRs (n = 8) and NRs (n = 8); 14 clusters were predicted by unsupervised PhenoGraph analysis. D, Histograms showing the expression (RFI values) of six markers in cluster #8 (T transitional memory TIGIThigh PD-1high), concatenated CD3+ CD8+ events (Conc), and negative control (Neg). E, Exemplified t-SNE visualization of 20 surface markers representing 15,000 merged CD45+ CD3 pre-nCT PBMCs from CRs (n = 7) and NRs (n = 8). Cells are colored according to the 11 clusters assigned by PhenoGraph and manual annotation; the corresponding heat map shows median marker intensity normalized to a 0 to 1 range. F, Histograms showing the expression (RFI values) of five surface markers in PhenoGraph clusters #1 and #4, concatenated CD45+ CD3 events, and Neg; clusters #1 and #4 were assigned as monocytes HLA-DRhigh (enriched in CRs) and MO-MDSC CCR7+ (enriched in NRs), respectively. G, Frequencies of CD45+CD3 cells in 11 PhenoGraph clusters (determined by 20 surface markers) in CRs (n = 7) and NRs (n = 8), presented as mean ± SEM. **, P < 0.01; one-way ANOVA. H, Correlation between the flow cytometry frequency (%) of CD14+HLA-DRhigh PBMCs and CD39+CD103+CD8+ TILs for n = 12 patients; 95% confidence interval is shaded in gray (R, Spearman correlation; P value).
Figure 7. Differential circulating proinflammatory cytokines and complement anaphylatoxins in responders and NRs to nCT. A, Baseline plasma concentrations of GM-CSF, IL4, CXCL10, C3a, and C5a in CRs (n = 12) and NRs(n = 14); bars represent mean ± SEM. *, P < 0.05; **, P < 0.01; unpaired t test. B, Spearman correlation coefficients for the 30 circulating cytokines analyzed and frequency of tumor-infiltrating CD8+ CD39+ CD103+ cells (calculated by flow cytometry manual gating on 15 baseline EACs; *, P < 0.05; **, P < 0.01). C, Correlation between the baseline plasma concentration of RANTES, IL1RA, GM-CSF, and IL4 and flow cytometry frequency (%) of CD39+ CD103+ CD8+ TILs for n = 15 patients; 95% confidence interval (CI) is shaded in gray (R, Spearman correlation; P value). D, Correlation between the baseline plasma concentration of GM-CSF and flow cytometry frequency (%) of circulating CD14+ HLA-DRhigh cells for n = 15 patients; 95% CI is shaded in gray (R, Spearman correlation; P value).
Figure 7.
Differential circulating proinflammatory cytokines and complement anaphylatoxins in responders and NRs to nCT. A, Baseline plasma concentrations of GM-CSF, IL4, CXCL10, C3a, and C5a in CRs (n = 12) and NRs(n = 14); bars represent mean ± SEM. *, P < 0.05; **, P < 0.01; unpaired t test. B, Spearman correlation coefficients for the 30 circulating cytokines analyzed and frequency of tumor-infiltrating CD8+ CD39+ CD103+ cells (calculated by flow cytometry manual gating on 15 baseline EACs; *, P < 0.05; **, P < 0.01). C, Correlation between the baseline plasma concentration of RANTES, IL1RA, GM-CSF, and IL4 and flow cytometry frequency (%) of CD39+ CD103+ CD8+ TILs for n = 15 patients; 95% confidence interval (CI) is shaded in gray (R, Spearman correlation; P value). D, Correlation between the baseline plasma concentration of GM-CSF and flow cytometry frequency (%) of circulating CD14+ HLA-DRhigh cells for n = 15 patients; 95% CI is shaded in gray (R, Spearman correlation; P value).

References

    1. Smyth EC, Lagergren J, Fitzgerald RC, Lordick F, Shah MA, Lagergren P, et al. . Oesophageal cancer. Nat Rev Dis Primers 2017;3:17048. - PMC - PubMed
    1. Shapiro J, van Lanschot JJB, Hulshof M, van Hagen P, van Berge Henegouwen MI, Wijnhoven BPL, et al. . Steyerberg EW, van der Gaast A; CROSS study group. Neoadjuvant chemoradiotherapy plus surgery versus surgery alone for oesophageal or junctional cancer (CROSS): long-term results of a randomised controlled trial. Lancet Oncol 2015;16:1090–8. - PubMed
    1. Obermannová R, Alsina M, Cervantes A, Leong T, Lordick F, Nilsson M, et al. . Oesophageal cancer: ESMO Clinical Practice Guideline for diagnosis, treatment and follow-up. Ann Oncol 2022;33:992–1004. - PubMed
    1. Fridman WH, Pagès F, Sautès-Fridman C, Galon J. The immune contexture in human tumours: impact on clinical outcome. Nat Rev Cancer 2012;12:298–306. - PubMed
    1. Mennonna D, Maccalli C, Romano MC, Garavaglia C, Capocefalo F, Bordoni R, et al. . T cell neoepitope discovery in colorectal cancer by high throughput profiling of somatic mutations in expressed genes. Gut 2017;66:454–63. - PMC - PubMed

Publication types

Supplementary concepts