. 2023 Sep 14;44(35):3339-3353.
doi: 10.1093/eurheartj/ehad396.

Histological validation of atrial structural remodelling in patients with atrial fibrillation

Affiliations

Histological validation of atrial structural remodelling in patients with atrial fibrillation

Yuya Takahashi et al. Eur Heart J. .

Abstract

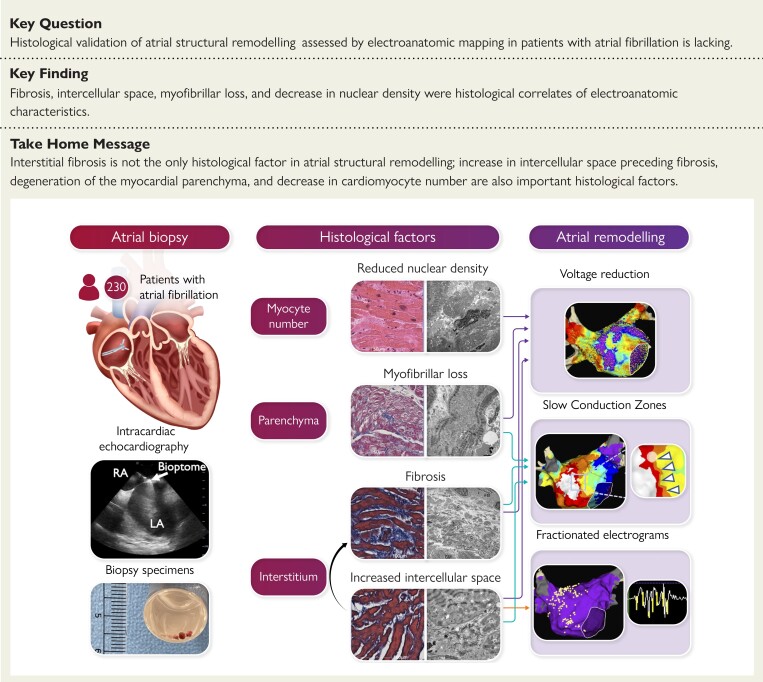
Background and aims: This study aimed to histologically validate atrial structural remodelling associated with atrial fibrillation.

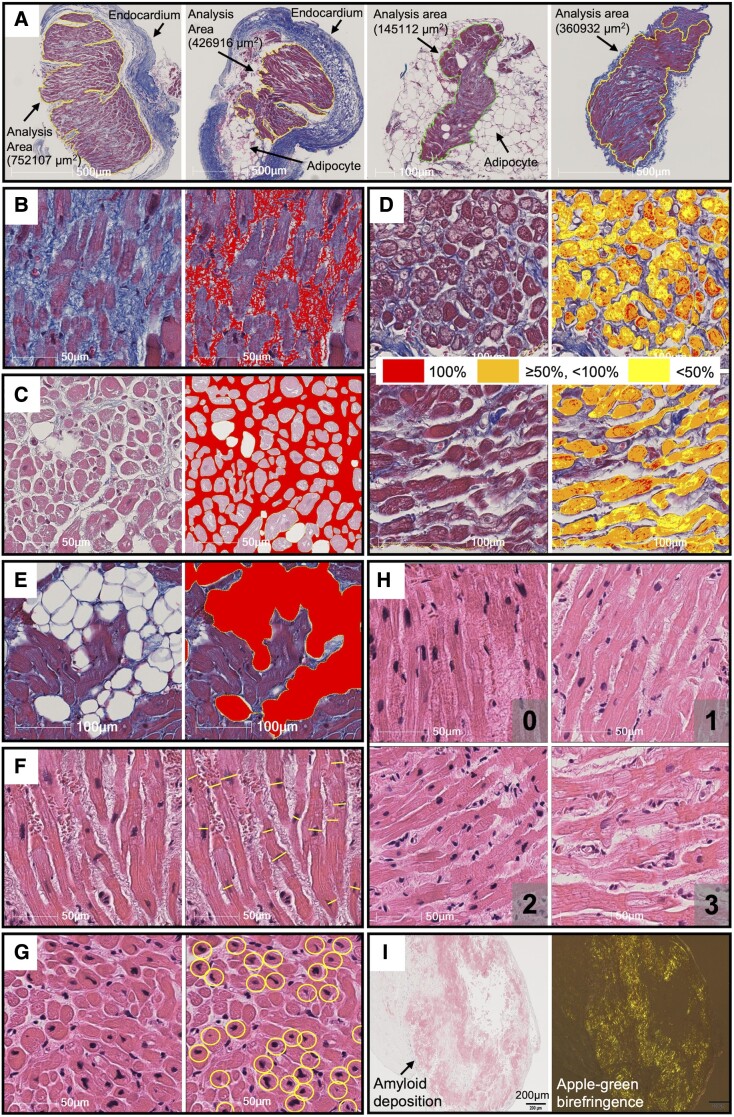
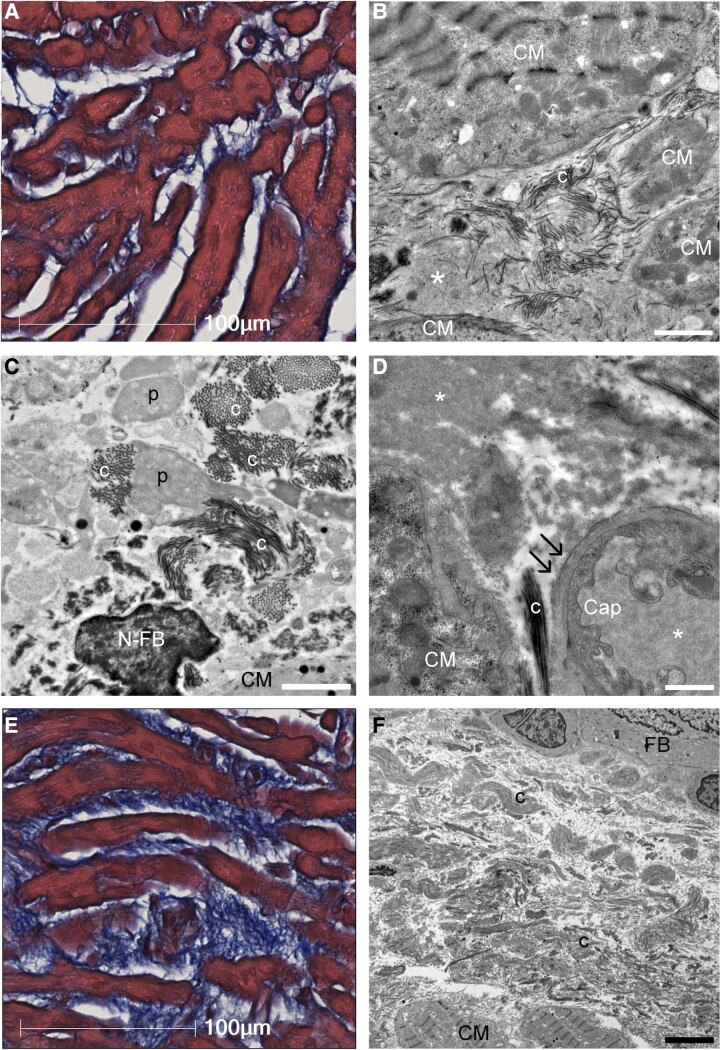
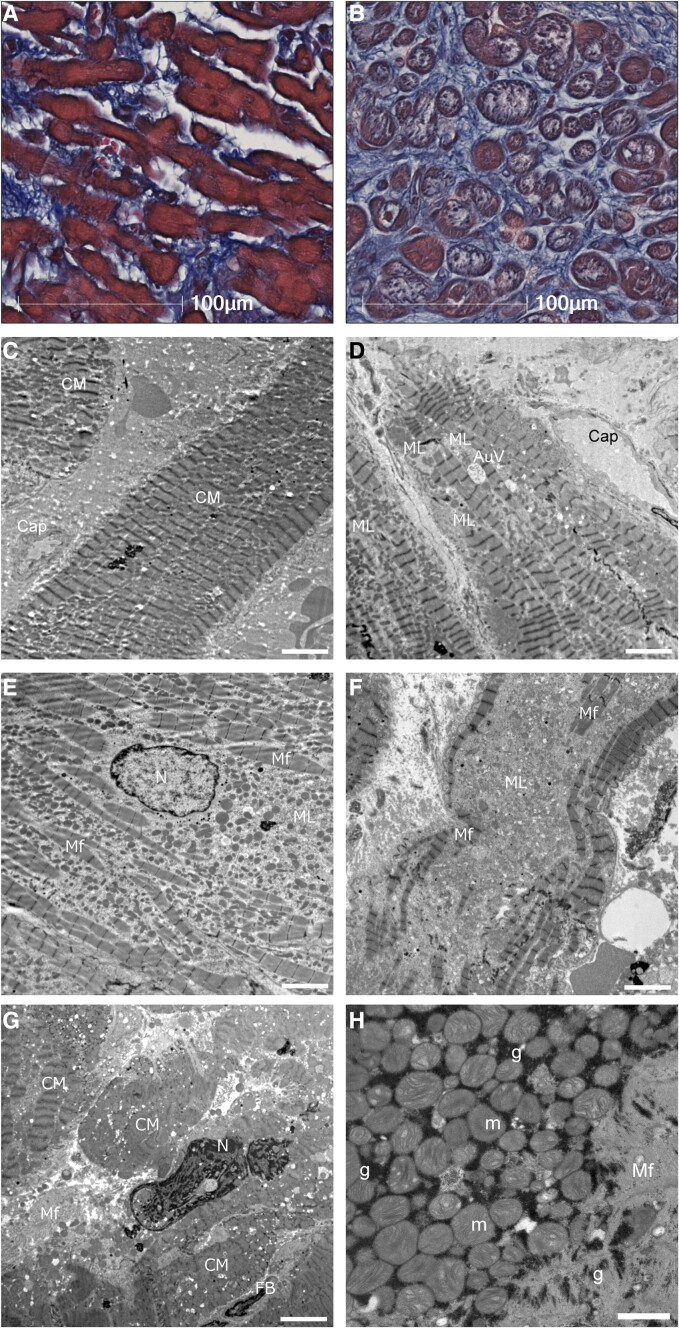
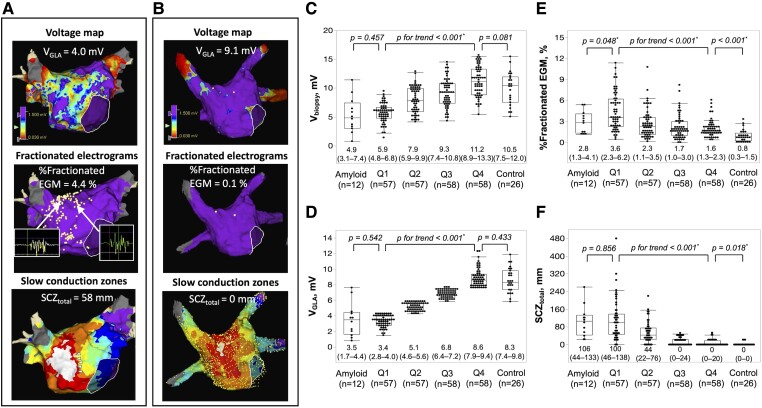
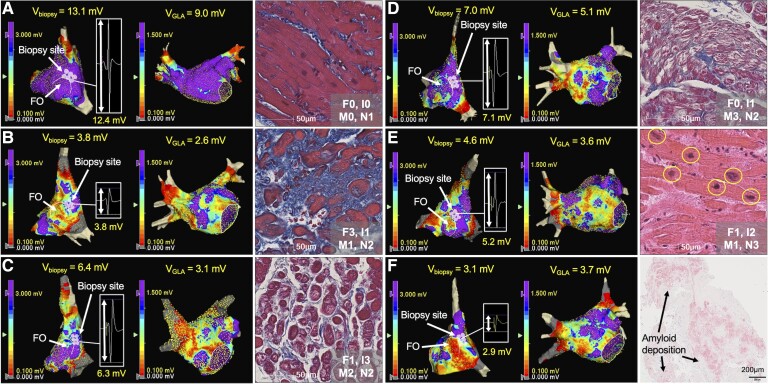
Methods and results: Patients undergoing atrial fibrillation ablation and endomyocardial atrial biopsy were included (n = 230; 67 ± 12 years old; 69 women). Electroanatomic mapping was performed during right atrial pacing. Voltage at the biopsy site (Vbiopsy), global left atrial voltage (VGLA), and the proportion of points with fractionated electrograms defined as ≥5 deflections in each electrogram (%Fractionated EGM) were evaluated. SCZtotal was calculated as the total width of slow conduction zones, defined as regions with a conduction velocity of <30 cm/s. Histological factors potentially associated with electroanatomic characteristics were evaluated using multiple linear regression analyses. Ultrastructural features and immune cell infiltration were evaluated by electron microscopy and immunohistochemical staining in 33 and 60 patients, respectively. Fibrosis, intercellular space, myofibrillar loss, and myocardial nuclear density were significantly associated with Vbiopsy (P = .014, P < .001, P < .001, and P = .002, respectively) and VGLA (P = .010, P < .001, P = .001, and P < .001, respectively). The intercellular space was associated with the %Fractionated EGM (P = .001). Fibrosis, intercellular space, and myofibrillar loss were associated with SCZtotal (P = .028, P < .001, and P = .015, respectively). Electron microscopy confirmed plasma components and immature collagen fibrils in the increased intercellular space and myofilament lysis in cardiomyocytes, depending on myofibrillar loss. Among the histological factors, the severity of myofibrillar loss was associated with an increase in macrophage infiltration.

Conclusion: Histological correlates of atrial structural remodelling were fibrosis, increased intercellular space, myofibrillar loss, and decreased nuclear density. Each histological component was defined using electron microscopy and immunohistochemistry studies.

Keywords: Atrial biopsy; Atrial fibrillation; Electroanatomic mapping; Fibrosis; Histology; Structural remodelling.


Figures

Structural Graphical Abstract
Histological factors associated with atrial structural remodelling in patients with atrial fibrillation. LA, left atrium; RA, right atrium.
Figure 1
Figure 1
Examples of measurement of histological factors. Analysis area was defined as the area surrounded by the solid lines excluding the endocardium and large adipose tissues (A). On Masson’s trichrome staining, fibrosis extent (B), intercellular space extent (C), myofibrillar loss severity (D), and adipocyte extent (E) were evaluated. On hematoxylin and eosin staining, myocyte size (F), and number of myocardial nuclei (G) were evaluated. Myocyte disarray was semi-quantitatively analysed and classified as minimal (0), mild (1), moderate (2), or severe (3) (H). Amyloid deposition was identified by Congo red staining and birefringence under polarizing microscope (I). See Supplementary data online, Appendix for the details.
Figure 2
Figure 2
Ultrastructural characteristics of interstitial structures in atrial biopsy samples. (A) Light microscopy image of atrial tissue with mild fibrosis and increased interstitial space. Masson’s trichrome staining. (B) Transmission electron microscopy showed that the intercellular space, which was considered as structureless by light microscopy, was filled with plasma components (*) and interspersed with immature collagen fibrils (c). (C) Collagen fibrils extended toward the intercellular space from the surface of pseudopodia-like projections (p) of fibroblasts. (D) Laminarization of the capillary basement membrane (double arrow) was observed, indicating increased vascular permeability. The electron densities of intracapillary plasma components and interstitial plasma components were consistent (*). (E) Light microscopy image of atrial tissue with severe intercellular fibrosis. (F) Transmission electron microscopy image of (E). The intercellular area was filled with tight collagen fibrils. Scale bars = 2 μm in (B and C), 1 μm in (D), and 5 μm in (F). Cap, capillary; CM, cardiomyocyte; N-FB, nucleus of fibroblast; FB, fibroblast.
Figure 3
Figure 3
Ultrastructural characteristics of cardiomyocytes in atrial biopsy samples. (A) In light microscopy, no or mild myofibrillar loss; (B) moderate to severe myofibrillar loss. (C) This case had no or minimum myofilament lysis in electron microscopy. (D) An example classified as mild myofilament lysis. An autophagic vacuole was near myofilament lysis area. (E) An example classified as moderate myofilament lysis. Area of myofilament lysis was spread out with preserved and scattered myofilaments. The shape of the nucleus (N) and chromatin are almost normal. (F) An example classified as severe myofilament lysis, disappeared myofilament. (G) A degenerated cardiomyocyte had swollen nuclei with chromatin aggregation. (H) Glycogen granules (g) were found between mitochondria (m) and myofilament. Scale bars = 5 μm in (C to G) and 1 μm in (H). CM, cardiomyocyte; Cap, capillary; ML, myofilament lysis; Mf, myofilaments; FB, fibroblast; AuV, autophagic vacuole.
Figure 4
Figure 4
Examples of electroanatomic maps of a patient with persistent atrial fibrillation with reduced VGLA, high %fractionated EGM, and long SCZtotal (A) and a patient in the control group with preserved VGLA, very low %fractionated EGM, and no SCZ (B). White dots in the middle panels show the sites with fractionated electrograms. Examples of fractionated electrograms are shown. White arrow heads indicate local slow conduction zones at the anterior wall. The relationship between the quartile category of VGLA and Vbiopsy (C), VGLA (D), %Fractionated EGM (E), and SCZtotal (F). Comparisons between Q1 category vs. the amyloid group and Q4 category vs. the control group are also shown. * P < .05; LA, left atrium; SCZ, slow conduction zones; SCZtotal, total width of slow conduction zones; Vbiopsy, voltage at the biopsy site; VGLA, global LA voltage; %Fractionated EGM, proportion of fractionated electrograms.
Figure 5
Figure 5
Examples of voltage map of the right atrium septum and the whole left atrium, and histology. A patient without voltage reduction on Vbiopsy or VGLA showed no significant histological changes except mild reduction of nuclear density (A). Patients with reduction on Vbiopsy and VGLA mainly due to increased %Fibrosis (B), increased %Intercellular space (C), increased %Myofibrillar loss (D), decreased nuclear density (E), and amyloid deposition (F) are shown. F0–3, I0–3, M0–3, and N0–3 show semi-quantification of %Fibrosis, %Intercellular space, %Myofibrillar loss, and myocardial nuclear density as shown in the Supplementary data online, Figure S14. FO, fossa ovalis; Vbiopsy, voltage at the biopsy site; VGLA, global LA voltage; %Fibrosis, extent of fibrosis; %Intercellular space, extent of intercellular space; %Myofibrillar loss, severity of myofibrillar loss.
Figure 6
Figure 6
Relationship between inflammatory cell infiltration and histological factors. The counts of CD45- (A), CD3- (B), CD11c- (C), and CD163-positive cells (D) per unit area (mm2) were compared between two groups: high vs. low %Fibrosis, high vs. low %Intercellular space, high vs. low %Myofibrillar loss, and high vs. low nuclear density groups. * P < .05; Arrows indicate positive cells in each immunohistochemical stain; F, %Fibrosis; I, %Intercellular space; M, %Myofibrillar loss; N, nuclear density.

Comment in

References

    1. Wolf PA, Mitchell JB, Baker CS, Kannel WB, D’Agostino RB. Impact of atrial fibrillation on mortality, stroke, and medical costs. Arch Intern Med 1998;158:229–234. 10.1001/archinte.158.3.229 - DOI - PubMed
    1. Pappone C, Rosanio S, Augello G, Gallus G, Vicedomini G, Mazzone P, et al. . Mortality, morbidity, and quality of life after circumferential pulmonary vein ablation for atrial fibrillation: outcomes from a controlled nonrandomized long-term study. J Am Coll Cardiol 2003;42:185–197. 10.1016/S0735-1097(03)00577-1 - DOI - PubMed
    1. Allessie M, Ausma J, Schotten U. Electrical, contractile and structural remodeling during atrial fibrillation. Cardiovasc Res 2002;54:230–246. 10.1016/S0008-6363(02)00258-4 - DOI - PubMed
    1. Wijffels MCEF, Kirchhof CJHJ, Dorland R, Allessie MA. Atrial fibrillation begets atrial fibrillation. A study in awake chronically instrumented goats. Circulation 1995;92:1954–1968. 10.1161/01.CIR.92.7.1954 - DOI - PubMed
    1. Weber KT, Sun Y, Tyagi SC, Cleutjens JPM. Collagen network of the myocardium: function, structural remodeling and regulatory mechanisms. J Mol Cell Cardiol 1994;26:279–292. 10.1006/jmcc.1994.1036 - DOI - PubMed

Publication types

Associated data