

Comparing Amyloid Imaging Normalization Strategies for Alzheimer's Disease Classification using an Automated Machine Learning Pipeline
- PMID: 37350880
- PMCID: PMC10283108
Comparing Amyloid Imaging Normalization Strategies for Alzheimer's Disease Classification using an Automated Machine Learning Pipeline
Abstract
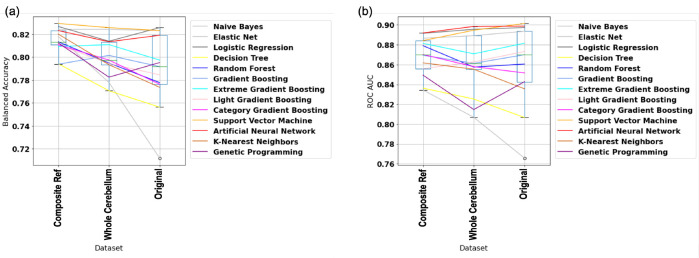
Amyloid imaging has been widely used in Alzheimer's disease (AD) diagnosis and biomarker discovery through detecting the regional amyloid plaque density. It is essential to be normalized by a reference region to reduce noise and artifacts. To explore an optimal normalization strategy, we employ an automated machine learning (AutoML) pipeline, STREAMLINE, to conduct the AD diagnosis binary classification and perform permutation-based feature importance analysis with thirteen machine learning models. In this work, we perform a comparative study to evaluate the prediction performance and biomarker discovery capability of three amyloid imaging measures, including one original measure and two normalized measures using two reference regions (i.e., the whole cerebellum and the composite reference region). Our AutoML results indicate that the composite reference region normalization dataset yields a higher balanced accuracy, and identifies more AD-related regions based on the fractioned feature importance ranking.
©2023 AMIA - All rights reserved.
Figures


Similar articles
-
Exploring Automated Machine Learning for Cognitive Outcome Prediction from Multimodal Brain Imaging using STREAMLINE.AMIA Jt Summits Transl Sci Proc. 2023 Jun 16;2023:544-553. eCollection 2023. AMIA Jt Summits Transl Sci Proc. 2023. PMID: 37350896 Free PMC article.
-
Classification of 18F-Flutemetamol scans in cognitively normal older adults using machine learning trained with neuropathology as ground truth.Eur J Nucl Med Mol Imaging. 2022 Sep;49(11):3772-3786. doi: 10.1007/s00259-022-05808-7. Epub 2022 May 6. Eur J Nucl Med Mol Imaging. 2022. PMID: 35522322 Free PMC article.
-
Accurate Blood-Based Diagnostic Biosignatures for Alzheimer's Disease via Automated Machine Learning.J Clin Med. 2020 Sep 18;9(9):3016. doi: 10.3390/jcm9093016. J Clin Med. 2020. PMID: 32962113 Free PMC article.
-
An Artificial Neural Network Integrated Pipeline for Biomarker Discovery Using Alzheimer's Disease as a Case Study.Comput Struct Biotechnol J. 2018 Feb 21;16:77-87. doi: 10.1016/j.csbj.2018.02.001. eCollection 2018. Comput Struct Biotechnol J. 2018. PMID: 29977480 Free PMC article. Review.
-
Automated machine learning: Review of the state-of-the-art and opportunities for healthcare.Artif Intell Med. 2020 Apr;104:101822. doi: 10.1016/j.artmed.2020.101822. Epub 2020 Feb 21. Artif Intell Med. 2020. PMID: 32499001 Review.
Cited by
-
SLR: A Modified Logistic Regression Model with Sinkhorn Divergence for Alzheimer's Disease Classification.AMIA Jt Summits Transl Sci Proc. 2025 Jun 10;2025:634-643. eCollection 2025. AMIA Jt Summits Transl Sci Proc. 2025. PMID: 40502270 Free PMC article.
-
PFERM: A Fair Empirical Risk Minimization Approach with Prior Knowledge.AMIA Jt Summits Transl Sci Proc. 2024 May 31;2024:211-220. eCollection 2024. AMIA Jt Summits Transl Sci Proc. 2024. PMID: 38827072 Free PMC article.
-
Ensuring Fairness in Detecting Mild Cognitive Impairment with MRI.AMIA Annu Symp Proc. 2025 May 22;2024:1119-1128. eCollection 2024. AMIA Annu Symp Proc. 2025. PMID: 40417489 Free PMC article.
-
A Practical Approach for Targeting Structural Variants Genome-wide in Plasma Cell-free DNA.Res Sq [Preprint]. 2024 Jan 5:rs.3.rs-3492157. doi: 10.21203/rs.3.rs-3492157/v1. Res Sq. 2024. PMID: 38260372 Free PMC article. Preprint.
-
Class-Balanced Deep Learning with Adaptive Vector Scaling Loss for Dementia Stage Detection.Mach Learn Med Imaging. 2024;14349:144-154. doi: 10.1007/978-3-031-45676-3_15. Epub 2023 Oct 15. Mach Learn Med Imaging. 2024. PMID: 38463442 Free PMC article.
References
-
- Association A. 2019 Alzheimer’s disease facts and figures. Alzheimer’s & dementia. 2019;15(3):321–87.
-
- da Rosa MM, de Aguiar Ferreira M, de Oliveira Lima CA, Mendonça ACS, Silva YM, Sharjeel M, et al. Alzheimer’s disease: Is there a role for galectins? European Journal of Pharmacology. 2021;909:174437. - PubMed
-
- Ashrafian H, Zadeh EH, Khan RH. Review on Alzheimer’s disease: inhibition of amyloid beta and tau tangle formation. International journal of biological macromolecules. 2021;167:382–94. - PubMed
Grants and funding
LinkOut - more resources
Full Text Sources