. 2023 Jun 4;13(10):3434-3450.
doi: 10.7150/thno.81951. eCollection 2023.

High-intensity interval training ameliorates Alzheimer's disease-like pathology by regulating astrocyte phenotype-associated AQP4 polarization

Affiliations

High-intensity interval training ameliorates Alzheimer's disease-like pathology by regulating astrocyte phenotype-associated AQP4 polarization

Shu Feng et al. Theranostics. .

Abstract

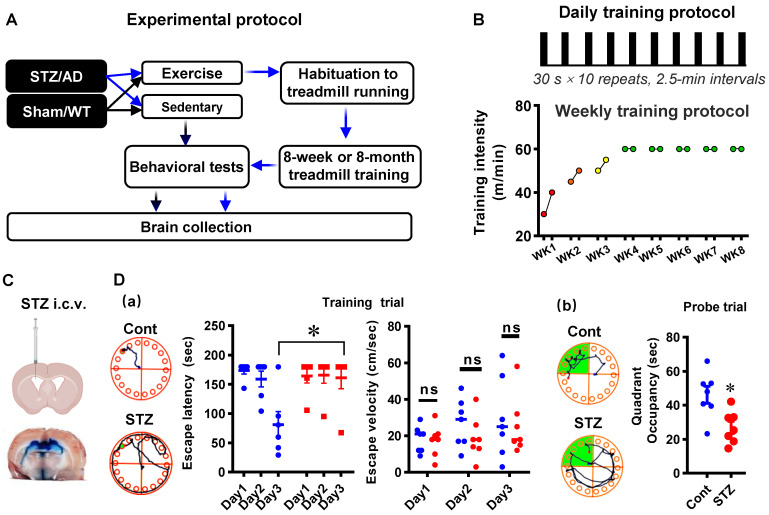
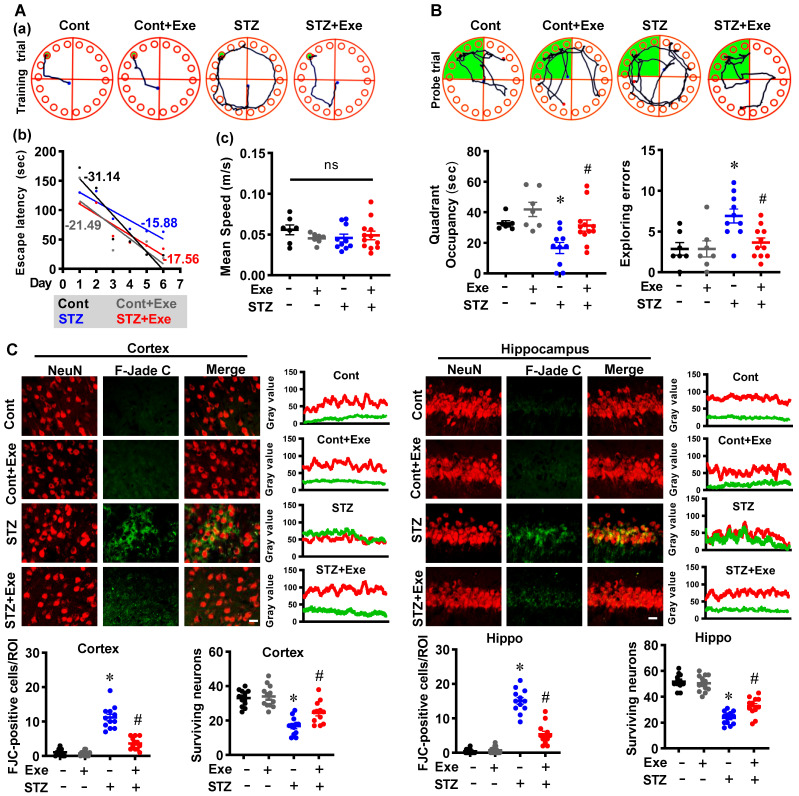
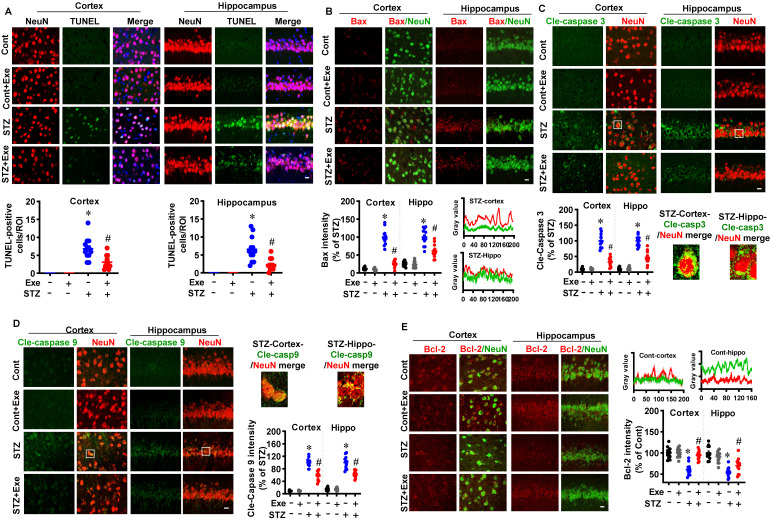
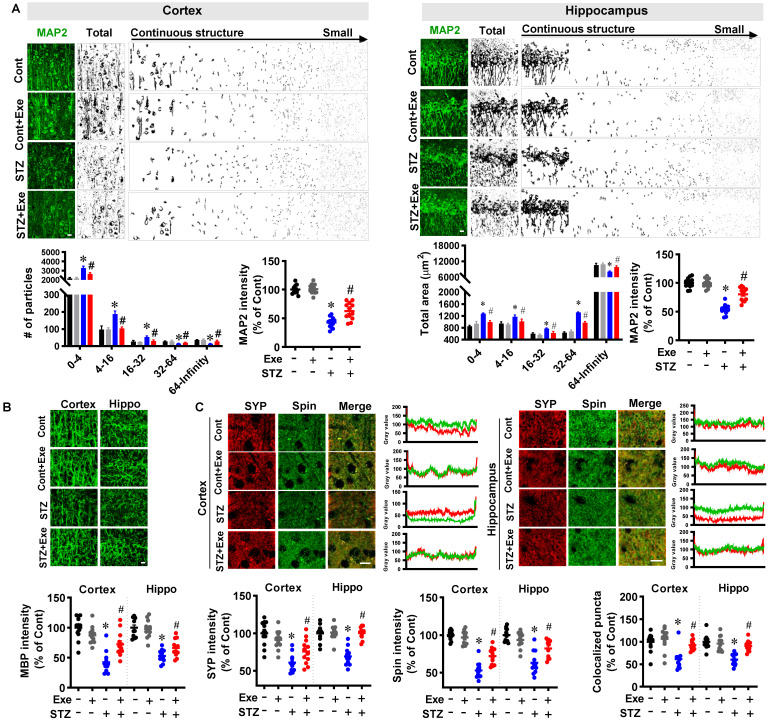
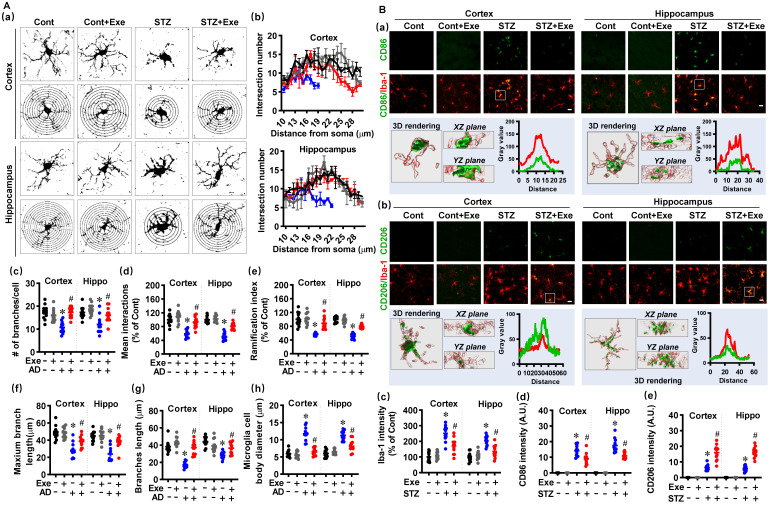
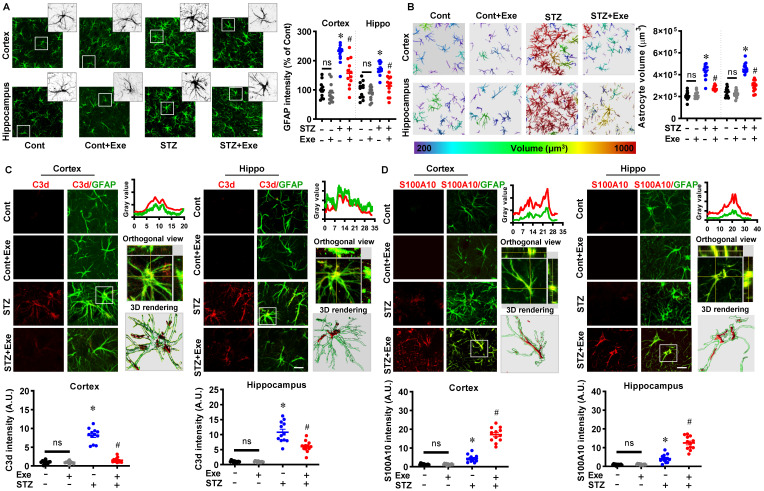
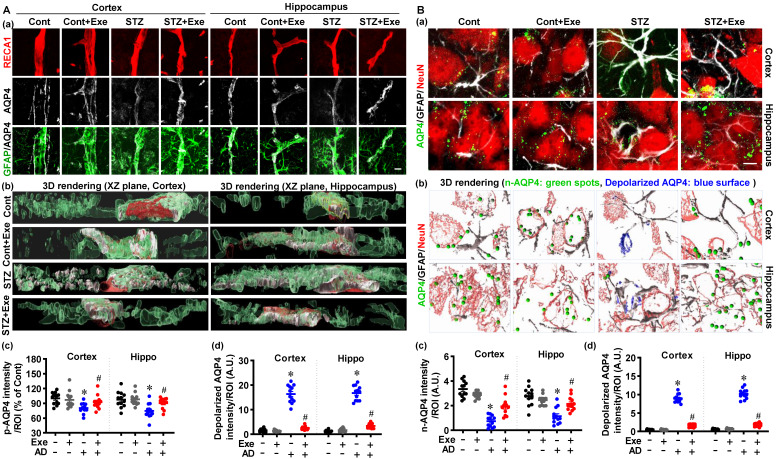
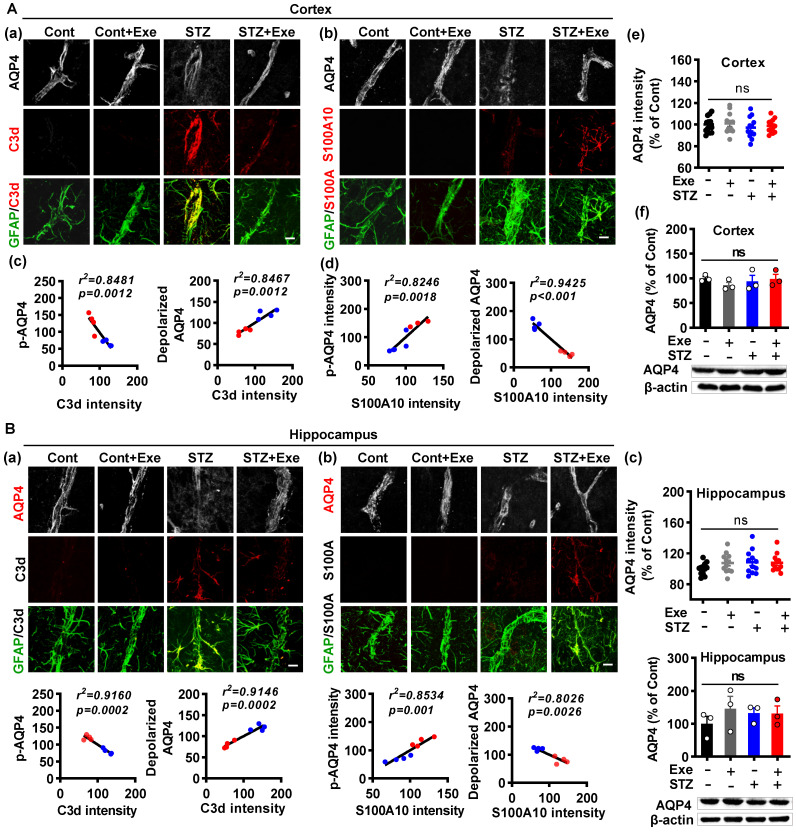
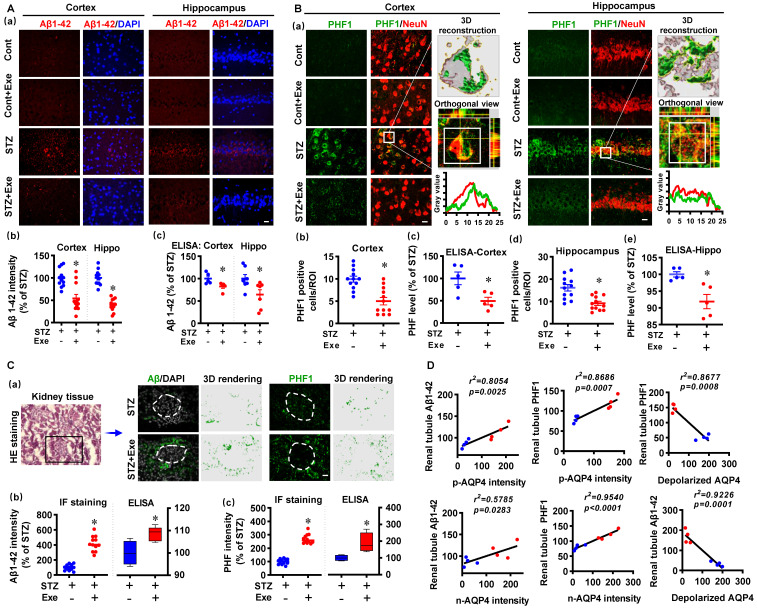
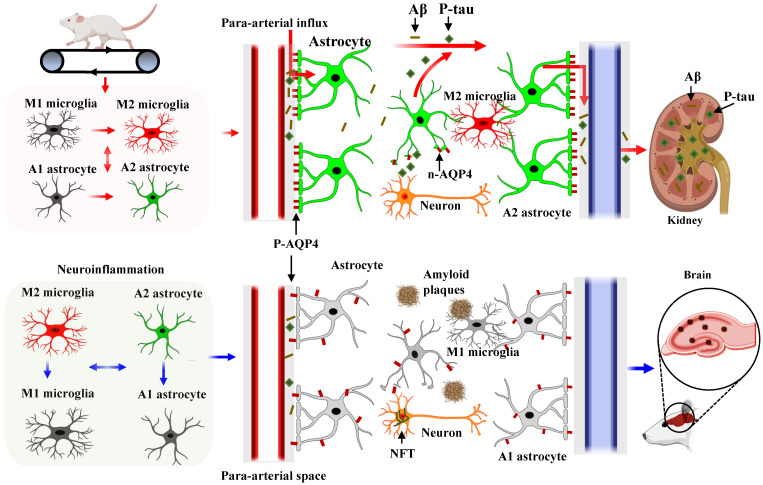
Background: Alzheimer's disease (AD), one of the most common forms of dementia, is a widely studied neurodegenerative disease characterized by Aβ accumulation and tau hyperphosphorylation. Currently, there is no effective cure available for AD. The astrocyte AQP4 polarized distribution-mediated glymphatic system is essential for Aβ and abnormal tau clearance and is a potential therapeutic target for AD. However, the role of exercise on the AQP4 polarized distribution and the association between the AQP4 polarized distribution and astrocyte phenotype polarization are poorly understood. Methods: Using a streptozotocin (STZ)-induced sporadic AD rat model, we investigated the effects of high-intensity interval training on AD pathologies. The Branes maze task was conducted to measure spatial learning and memory. Immunofluorescence staining of NeuN with TUNEL, Fluoro-Jade C, and relative neuronal damage markers was applied to measure neuronal apoptosis, neurodegeneration, and damage. Sholl analysis was carried out to analyze the morphology of microglia. Line-scan analysis, 3D rendering, and the orthogonal view were applied to analyze the colocalization. Western blot analysis and enzyme-linked immunosorbent assay (ELISA) analysis were conducted to examine AQP4 and Aβ, respectively. An APP/PS1 transgenic AD mice model was used to confirm the key findings. Results: High-intensity interval training (HIIT) alleviates cognitive dysfunction in STZ-induced AD-like rat models and provides neuroprotection against neurodegeneration, neuronal damage, and neuronal loss. Additionally, HIIT improved the drainage of abnormal tau and Aβ from the cortex and hippocampus via the glymphatic system to the kidney. Further mechanistic studies support that the beneficial effects of HIIT on AD might be due, in part, to the polarization of glial cells from a neurotoxic phenotype towards a neuroprotective phenotype. Furthermore, an intriguing finding of our study is that the polarized distribution of AQP4 was strongly correlated with astrocyte phenotype. We found A2 phenotype exhibited more evident AQP4 polarization than the A1 phenotype. Conclusion: Our findings indicate that HIIT ameliorates Alzheimer's disease-like pathology by regulating astrocyte phenotype and astrocyte phenotype-associated AQP4 polarization. These changes promote Aβ and p-tau clearance from the brain tissue through the glymphatic system and the kidney.

Keywords: Alzheimer's disease; Astrocyte AQP4; Aβ clearance; Glymphatic system; High-intensity interval training.


Conflict of interest statement

Competing Interests: The authors have declared that no competing interest exists.

Figures

Figure 1
Figure 1
Diagram of the experimental design and high-intensity interval training protocol. (A) The control and STZ-injected rats were each randomized into sedentary and exercise groups. Behavioral tests were performed following an 8-week HIIT treatment. Brain collections were initiated after the behavioral test. (B) The 8-week HIIT training was performed at 30-40 m/min in the first week, 45-50 m/min in the second week, 50-55 m/min in the third week, and 60 m/min from the fourth to the eighth week. The 30-minute HIIT was carried out 5 days/week with 10 bouts of 30-s sprinting and 2.5 min intervals between each episode. For the transgenic AD mouse model, the 6-month exercise training was initiated at 2 months old and ended at 8 months old with a similar habituation period and training stage. (C) Schematic diagram depicting STZ injection into the lateral cerebral ventricle of rats. (D) Barnes Maze tests in the established STZ rat model. Data represent mean ± SEM, n = 7. *P < 0.05 vs. Cont group. ns, no significant difference.
Figure 2
Figure 2
HIIT ameliorates STZ-induced learning and memory deficits and neuronal degeneration. (A) Representative tracking plots and results of rats in the training trials of the Barnes maze tests. The slope of line (b) and the mean speed (c) were analyzed. (B) Results of the probe test in the Barnes maze tests (n = 7-12). (C) Representative immunofluorescence images of NeuN (red) and Fluoro-Jade C staining (green). The scale bar represents 10 μm. Line-scan analysis was performed to analyze the colocalization. The Fluoro-Jade C-positive neurons and surviving neurons were analyzed. Data represent mean ± SEM, n = 12 slices from 6 animals. *P < 0.05 vs. Cont group, #P < 0.05 vs. STZ group. ns represents no significant difference.
Figure 3
Figure 3
HIIT reduces neuronal apoptosis following STZ administration. (A) Representative immunofluorescence images of NeuN (red) and TUNEL staining (green). White arrows indicate TUNEL+ neurons. TUNEL-positive cells were counted and analyzed in the cortex and hippocampus. (B) Representative confocal images showed NeuN (green) and Bax (red) fluorescent signals in the cortex and hippocampus. Bax intensity was analyzed and shown as a percentage of control. Line-scan analysis of representative images was conducted to analyze the colocalization of Bax and NeuN signals. (C) Representative confocal images of Cle-caspase 3 (Green) and NeuN (Red). The white square marked an enlarged view of the area. Cle-Caspase 3 intensity was analyzed as a percentage of STZ. (D) Representative confocal images of Cle-caspase 9 (Green) and NeuN (Red). An enlarged view of the area was marked by the white square. Cle-Caspase 9 intensity was analyzed as a percentage of STZ. (E) Representative confocal images showed NeuN (green) and Bax (red) fluorescent signals in the cortex and hippocampus. Bax intensity was analyzed and shown as a percentage of control. Line-scan analysis of representative images was conducted to analyze the colocalization of Bax and NeuN signals. The scale bar represents 10 μm. Data represent mean ± SEM, n = 12 slices from 6 animals. *P < 0.05 vs. Cont group, #P < 0.05 vs. STZ group.
Figure 4
Figure 4
HIIT alleviates neuronal damage induced by STZ administration. (A) Representative confocal microscopy images of MAP2. The acquired images of MAP2 were thresholded, median filtered, and binarized using Image J software. The MAP2 segments were size-separated from the continuous structure to small particles. The number of different sizes of particles was analyzed. MAP2 intensity was analyzed as a percentage of control. The scale bar represents 10 μm. The MAP2 segments were area-separated and analyzed. (B) Representative confocal microscopy images of MBP. MBP intensity was calculated as a percentage of control. (C) Representative immunofluorescence images of synaptophysin (SYP, red, presynaptic marker) and spinophilin (Spin, green, dendritic spine marker). Line-scan analysis was performed to analyze the colocalization of spinophilin and synaptophysin. Immunoactivity intensity analyses of spinophilin and synaptophysin and the colocalized puncta between the two channels were qualified and analyzed using Image J software. The scale bar represents 10 μm. Data represent mean ± SEM, n = 12 slices from 6 animals. *P < 0.05 vs. Cont group, #P < 0.05 vs. STZ group.
Figure 5
Figure 5
HIIT reduces the over-activation of microglia and induces microglia polarization toward the M2 phenotype. (A) Representative images of Iba1+ microglia and the Sholl analysis (a). The intersection number per radius over the distance from the cell body was displayed graphically in the curve. (b). The number of branches (c), mean interactions (d), ramification index (e), maximum branch length (f), average branch length (g), and cell body diameter (h) was analyzed. (B) Representative confocal microscopy shows co-staining of CD86 (green, M1 marker) and Iba-1 (red). 3D reconstruction and line-scan analysis of the representative cells (white square) in the STZ group were conducted (a). Representative confocal microscopy shows co-staining of CD206 (green) and Iba-1 (red). 3D reconstruction and line-scan analysis of the representative cells (white square) were conducted (b). Iba-1 (c), CD86 (d), and CD206 intensities were analyzed. The scale bar represents 10 μm. Data represent mean ± SEM, n = 12 slices from 6 animals. *P < 0.05 vs. Cont group, #P < 0.05 vs. STZ group.
Figure 6
Figure 6
HIIT reduces the over-activation of astrocytes and induces astrocyte polarization toward the A2 phenotype. (A) Representative images of GFAP+ astrocyte. An enlarged view of the white square-marked astrocyte was shown at the top right corner. The GFAP intensity was quantified and analyzed. (B) Representative 3D reconstruction images of astrocytes with the cellular volumes distinguished with different colors. Astrocyte volumes were quantified and analyzed. (C) Representative confocal microscopy shows co-staining of C3d (red, A1 marker) and GFAP (green). Line-scan analysis, orthogonal view, and 3D reconstruction of the representative cells (white square) in the STZ group were conducted to confirm the colocalization of C3d and GFAP. C3d intensities in the cortex and hippocampus were measured and analyzed. (D) Representative confocal microscopy shows co-staining of S100A10 (red, A2 marker) and GFAP (green). Line-scan analysis, orthogonal view, and 3D reconstruction of the representative cells (white square) in the exercise group were conducted to confirm the colocalization of S100A10 and GFAP. S100A10 intensities in the cortex and hippocampus were measured. The scale bar represents 10 μm. Data represent mean ± SEM, n = 12 slices from 6 animals. *P < 0.05 vs. Cont group, #P < 0.05 vs. STZ group.
Figure 7
Figure 7
HIIT preserves astrocyte p-AQP4 and n-AQP4 polarity. (A) Confocal immunofluorescence triple staining for RECA1 (red), AQP4 (white), and GFAP (green) (a). XZ-plane view of the 3D rendering images (b). p-AQP4 and depolarized AQP4 intensities were analyzed (c and d). The scale bar represents 10 μm. (B) Confocal immunofluorescence triple staining for NeuN (red), AQP4 (green), and GFAP (white) (a). 3D rendering images of the NueN/GFAP/AQP4. The green ball represents n-AQP4, and the blue surface represents depolarized AQP4 (b). n-AQP4 and depolarized AQP4 intensities were analyzed (c and d). A.U. indicates arbitrary units. The scale bar represents 5 μm. Data represent mean ± SEM, n = 12 slices from 6 animals. *P < 0.05 vs. Cont group, #P < 0.05 vs. STZ group.
Figure 8
Figure 8
HIIT-induced AQP4 polarized distribution correlates closely with astrocyte phenotype without affecting AQP4 expression. (A) Representative immunofluorescence images of AQP4 (white), C3d (red), and GFAP (green) in the cortex (a). Representative immunofluorescence images of AQP4 (white), S100A10 (red), and GFAP (green) in the cortex (b). Linear regression analysis of the association between AQP4 (p-AQP4 or depolarized AQP4) and C3d (c) or S100A10 (d). The levels of AQP4 in the cortex were measured by quantitative analysis of AQP4 immunofluorescence intensity (e, n = 12 slices from 6 animals) and western blot (f, n = 3). Data represent mean ± SEM. The scale bar represents 10 μm. (B) Representative immunofluorescence images of AQP4 (white), C3d (red), and GFAP (green) in the hippocampus (a). Representative immunofluorescence images of AQP4 (white), S100A10 (red), and GFAP (green) in the hippocampus (b). Linear regression analysis of the association between AQP4 (p-AQP4 or depolarized AQP4) and C3d (c) or S100A10 (d). The levels of AQP4 in the hippocampus were measured by quantitative analysis of AQP4 immunofluorescence intensity (e, n = 12 slices from 6 animals) and western blot (f, n = 3). Data represent mean ± SEM. The scale bar represents 10 μm. *P < 0.05 vs. Cont group, #P < 0.05 vs. STZ group.
Figure 9
Figure 9
HIIT attenuates amyloid load and abnormal tau hyperphosphorylation through kidney-mediated clearance and polarized AQP4. (A) Representative immunofluorescence images of Aβ1-42 (red) and DAPI (blue) in the cortex and hippocampus (a). The Aβ1-42 intensities in the cortex and hippocampus were quantified and analyzed (b, n = 12 slices from 6 animals). The scale bar represents 10 μm. The levels of Aβ1-42 in the cortex and hippocampus were measured by ELISA (c, n = 5). The Aβ1-42 intensity was presented as a percentage of the STZ group. (B) Representative immunofluorescence images of PHF1 (green) and NeuN (red) in the cortex and hippocampus (a). 3D reconstruction of the neuron (white square), orthogonal view, and line-scan analysis in the STZ group were conducted to confirm the colocalization of PHF1 and NeuN (a). Numbers of PHF1 positive cells in the region of interest (b and d, n =12 slices from 6 animals). The PHF level in the cortex and hippocampus were measured by ELISA (c and e, n = 5). (C) Representative immunofluorescence and 3D rendering images of Aβ1-42 and PHF1 in the kidney tissue (a). The images of HE staining showed the glomerulus and kidney tubule marked by a box where the immunofluorescence images were taken (a). Immunofluorescence intensity and ELISA analysis results of Aβ1-42 (b) and PHF (c) were displayed as a percentage of the STZ group. (D) Linear regression analysis of the association between AQP4 (n-AQP4, p-AQP4, and depolarized AQP4) and the levels of Aβ or PHF1 in the renal tubule. P < 0.05 vs. STZ group.
Figure 10
Figure 10
Diagram of the mechanism of action of HIIT on Aβ and p-tau clearance in STZ-induced AD-like rat models. HIIT promotes astrocyte polarization from A1 to the A2 phenotype, wherein the AQP4 exhibits polarized distribution in the A2 phenotype and depolarizes in the A1 phenotype. The polarized AQP4 promotes Aβ and p-tau clearance from the brain tissue through the glymphatic system and the kidney.

References

    1. Yang L, Wu C, Parker E, Li Y, Dong Y, Tucker L. et al. Non-invasive photobiomodulation treatment in an Alzheimer Disease-like transgenic rat model. Theranostics. 2022;12:2205–31. - PMC - PubMed
    1. Weller J, Budson A. Current understanding of Alzheimer's disease diagnosis and treatment. F1000Res. 2018. 7. - PMC - PubMed
    1. Kinney JW, Bemiller SM, Murtishaw AS, Leisgang AM, Salazar AM, Lamb BT. Inflammation as a central mechanism in Alzheimer's disease. Alzheimers Dement (N Y) 2018;4:575–90. - PMC - PubMed
    1. Yang L, Wu C, Li Y, Dong Y, Wu CY, Lee RH. et al. Long-term exercise pre-training attenuates Alzheimer's disease-related pathology in a transgenic rat model of Alzheimer's disease. Geroscience. 2022;44:1457–77. - PMC - PubMed
    1. Yang L, Youngblood H, Wu C, Zhang Q. Mitochondria as a target for neuroprotection: role of methylene blue and photobiomodulation. Transl Neurodegener. 2020;9:19. - PMC - PubMed