. 2023 Jun 7:14:1109460.
doi: 10.3389/fpls.2023.1109460. eCollection 2023.

Metabolomics reveals the response of hydroprimed maize to mitigate the impact of soil salinization

Affiliations

Metabolomics reveals the response of hydroprimed maize to mitigate the impact of soil salinization

Enying Zhang et al. Front Plant Sci. .

Abstract

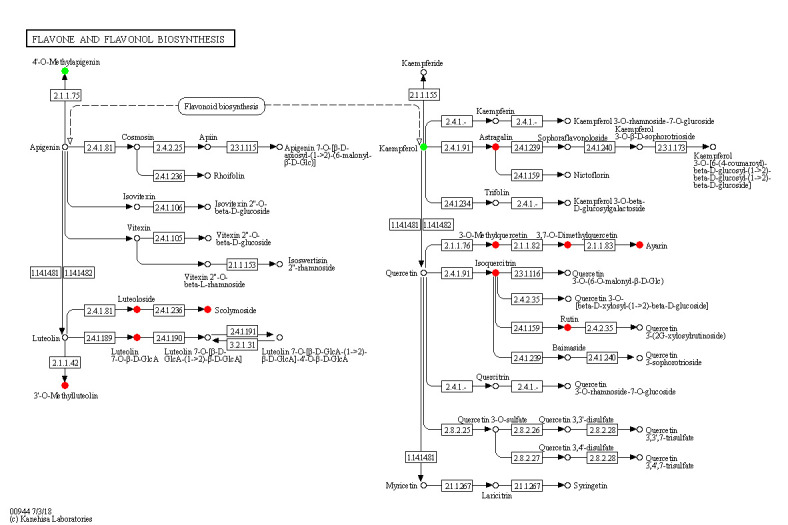
Soil salinization is a major environmental stressor hindering global crop production. Hydropriming has emerged as a promising approach to reduce salt stress and enhance crop yields on salinized land. However, a better mechanisitic understanding is required to improve salt stress tolerance. We used a biochemical and metabolomics approach to study the effect of salt stress of hydroprimed maize to identify the types and variation of differentially accumulated metabolites. Here we show that hydropriming significantly increased catalase (CAT) activity, soluble sugar and proline content, decreased superoxide dismutase (SOD) activity and peroxide (H2O2) content. Conversely, hydropriming had no significant effect on POD activity, soluble protein and MDA content under salt stress. The Metabolite analysis indicated that salt stress significantly increased the content of 1278 metabolites and decreased the content of 1044 metabolites. Ethisterone (progesterone) was the most important metabolite produced in the roots of unprimed samples in response to salt s tress. Pathway enrichment analysis indicated that flavone and flavonol biosynthesis, which relate to scavenging reactive oxygen species (ROS), was the most significant metabolic pathway related to salt stress. Hydropriming significantly increased the content of 873 metabolites and significantly decreased the content of 1313 metabolites. 5-Methyltetrahydrofolate, a methyl donor for methionine, was the most important metabolite produced in the roots of hydroprimed samples in response to salt stress. Plant growth regulator, such as melatonin, gibberellin A8, estrone, abscisic acid and brassinolide involved in both treatment. Our results not only verify the roles of key metabolites in resisting salt stress, but also further evidence that flavone and flavonol biosynthesis and plant growth regulator relate to salt tolerance.

Keywords: hydropriming; land degradation; metabolomics analysis; progesterone; soil salinization.


Conflict of interest statement

The authors declare that the research was conducted in the absence of any commercial or financial relationships that could be construed as a potential conflict of interest.

Figures

Figure 1
Figure 1
Comparative growth of seedlings of unprimed and hydroprimed samples under salt stress (NaCl) and control (unprimed water) on 7th day.
Figure 2
Figure 2
Influence of salt stress and hydropriming treatment on germination [Germination percentage (A) and Germination potential (B)] and seedling traits [Seedling fresh weight (C), Seedling dry weight (D), Root dry weight (E) and Shoot dry weight (F)] of maize. Different letters (a and b) indicate significant differences among treatments according to Duncan’s test (p < 0.05). Error bars indicate ± SE of mean (n = 3).
Figure 3
Figure 3
Influence of salt stress and hydropriming treatment on the activities of CAT (A), POD (B), SOD (C), and content of H2O2 (D), MDA (E) in maize roots. Different letters (a and b) indicate significant differences among treatments according to Duncan’s test (p < 0.05). Error bars indicate ± SE of mean (n = 3).
Figure 4
Figure 4
Influence of salt stress and hydropriming treatment on soluble protein (A), soluble sugars (B), proline (C), K+/Na+ ration (D) in maize roots. Different letters (a and b) indicate significant differences among treatments according to Duncan’s test (p < 0.05). Error bars indicate ± SE of mean (n = 3).
Figure 5
Figure 5
PCA (A) and PLS-DA (B) analyses of metabolic profiles of roots from unprimed maize seeds under with and without salt stress. group A, roots from unprimed maize seeds without salt stress; group B, roots from unprimed maize seeds under salt stress.
Figure 6
Figure 6
The top 20 the Kyoto Encyclopedia of Genes and Genomes (KEGG)-enriched metabolism pathway of differential metabolites between roots from unprimed maize seeds under with and without salt stress.
Figure 7
Figure 7
PCA (A) and PLS-DA (B) analyses of metabolic profiles of roots from unprimed and hydroprimed maize seeds under salt stress. group B, roots from unprimed maize seeds under salt stress; group C, roots from hydroprimed maize seeds under salt stress.
Figure 8
Figure 8
The top 20 the Kyoto Encyclopedia of Genes and Genomes (KEGG)-enriched metabolism pathway of differential metabolites between roots from unprimed and hydroprimed maize seeds under salt stress.
Figure 9
Figure 9
Venn diagram showing the number of metabolites that increased or decreased in the salt stressed and hydroprimed seedlings. The numbers next to up and down arrows indicated the number of upregulated and downrugulated differentially metabolites.
Figure 10
Figure 10
Influence of salt stress and hydropriming treatment on relative expression levels of delta-1-pyrroline-5-carboxylate synthase 2 (A), caffeic acid 3-O-methyltransferase (B), catalase isozyme 2 (C) and Steroid reductase DET2 (D) by qRT-PCR. Different letters (a and b) indicate significant differences among treatments according to Duncan’s test (p < 0.05). Error bars indicate ± SE of mean (n = 3).
Figure 11
Figure 11
Changes in metabolic pathways of maize roots responding to salt stress. Red-marked metabolites indicated that the metabolite concentration increased significantly under salt stress(p<0.05). Green-marked metabolites indicated that the metabolites concentration decreased significantly under salt stress(p<0.05). Black-marked metabolites showed no significant change.

References

    1. Abideen Z., Hanif M., Munir N., Nielsen B. L. (2022). Impact of nanomaterials on the regulation of gene expression and metabolomics of plants under salt stress. Plants (Basel Switzerland). 11, 691. doi: 10.3390/plants11050691 - DOI - PMC - PubMed
    1. Adeel M., Yang Y. S., Wang Y. Y., Song X. M., Ahmad M. A., Rogers H. J. (2018). Uptake and transformation of steroid estrogens as emerging contaminants influence plant development. Environ. Pollut. 243, 1487–1497. doi: 10.1016/j.envpol.2018.09.016 - DOI - PubMed
    1. Aebi H. (1984). Catalase in vitro. Methods Enzymol. 105, 121–126. doi: 10.1016/S0076-6879(84)05016-3 - DOI - PubMed
    1. Aeschbach R., Loliger J., Scott B. C., Murcia A., Butler J., Halliwell B. (1994). Antioxidant actions of thymol, carvacrol, 6-gingerol, zingerone and hydroxytyrosol. Food. Chem. Toxicol. 32, 31–36. doi: 10.1016/0278-6915(84)90033-4 - DOI - PubMed
    1. Araújo M., Prada J., Mariz-Ponte N., Santos C., Pereira J. A., Pinto D. C. G. A., et al. . (2021). Antioxidant adjustments of olive trees (Olea europaea) under field stress conditions. Plants 10, 684. doi: 10.3390/plants10040684 - DOI - PMC - PubMed