. 2023 Jun 7:14:1205469.
doi: 10.3389/fgene.2023.1205469. eCollection 2023.

Transcriptome profiling of flax plants exposed to a low-frequency alternating electromagnetic field

Affiliations

Transcriptome profiling of flax plants exposed to a low-frequency alternating electromagnetic field

Kamil Kostyn et al. Front Genet. .

Erratum in

Abstract

All living organisms on Earth evolved in the presence of an electromagnetic field (EMF), adapted to the environment of EMF, and even learned to utilize it for their purposes. However, during the last century, the Earth's core lost its exclusivity, and many EMF sources appeared due to the development of electricity and electronics. Previous research suggested that the EMF led to changes in intercellular free radical homeostasis and further altered the expression of genes involved in plant response to environmental stresses, inorganic ion transport, and cell wall constituent biosynthesis. Later, CTCT sequence motifs in gene promoters were proposed to be responsible for the response to EMF. How these motifs or different mechanisms are involved in the plant reaction to external EMF remains unknown. Moreover, as many genes activated under EMF treatment do not have the CTCT repeats in their promoters, we aimed to determine the transcription profile of a plant exposed to an EMF and identify the genes that are directly involved in response to the treatment to find the common denominator of the observed changes in the plant transcriptome.

Keywords: RNA-seq; antioxidants; electromagnetic field; flax; stress; transcriptome.


Conflict of interest statement

The authors declare that the research was conducted in the absence of any commercial or financial relationships that could be construed as a potential conflict of interest.

Figures

FIGURE 1
FIGURE 1
Scheme of the ELF-EMF exposure system.
FIGURE 2
FIGURE 2
Level of H2O2 (A) and transcript level of NADPH oxidase (NadphoxD) (B) measured in several time points in flax exposed to the 500 μT, 50 Hz EMF. The bars represent the mean values of three biological repeats ± standard deviation. The asterisks mark statistically significant changes in relation to the control (p < 0,05).
FIGURE 3
FIGURE 3
Antioxidant potential measured with the DPPH method in several time points in flax exposed to the 500 μT, 50 Hz EMF. The bars represent the mean value of three biological repeats ± standard deviation. The asterisks mark statistically significant changes in relation to the control (p < 0,05).
FIGURE 4
FIGURE 4
Principal component analysis on transcriptome data from flax seedlings exposed to the 50 Hz 500 μT ELF-EMF (2) and the control (1).
FIGURE 5
FIGURE 5
Statistics of differentially expressed genes.
FIGURE 6
FIGURE 6
Volcano plot of DEGs. The colored points represent differentially expressed genes with alpha = 0.05 and log2FC = 1 (blue: downregulated and red: upregulated). The top 100 up- and downregulated genes are labeled.
FIGURE 7
FIGURE 7
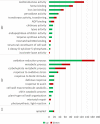
Gene Ontology (GO) classification.
FIGURE 8
FIGURE 8
Transcript level of (A) phenyalanine ammonia lyase (PAL), (B) cinnamate-4-hydroxylase (C4H), (C) chalcone synthase (CHS), (D) chitinase, and (E) β-glucanase genes measured in several time points in flax exposed to the 0.500 μT, 50 Hz EMF. The bars represent the mean values of three biological repeats ± standard deviation. The asterisks mark statistically significant changes in relation to the control (p < 0.05).
FIGURE 9
FIGURE 9
Heatmaps of the expression of PR genes, genes involved in ROS processing, and genes involved in phenylpropanoid biosynthesis in 4-week-old flax seedlings exposed to the 50 Hz, 500 μT ELF-EMF. The expression was normalized using the DESeq2 method.
FIGURE 10
FIGURE 10
Level of the fungal murein transglycosylase gene DNA measured in the green parts and roots of flax seedlings exposed to 500 μT, 50 Hz EMF compared to the non-treated (only infected) control (red horizontal line (RQ = 1)). The bars represent the mean value of three biological repeats ± standard deviation. The asterisks mark statistically significant changes in relation to the control (p < 0.05).
FIGURE 11
FIGURE 11
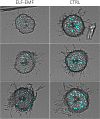
Microscopic image of stem sections of 2-week-old flax seedlings treated with ELF-EMF and non-treated control (CTRL) infected with F. oxysporum. The fungal cells in the vascular bundles are false-colored (cyan) using Cell^B software (Olympus Optical Co.).

References

    1. Ahmad M., Galland P., Ritz T., Wiltschko R., Wiltschko W. (2007). Magnetic intensity affects cryptochrome-dependent responses in Arabidopsis thaliana . Planta 225 (3), 615–624. 10.1007/s00425-006-0383-0 - DOI - PubMed
    1. Alemán E. I., Mbogholi A., Fung Boix Y., González-Olmedo J., Chalfun-Junior A. (2014). Effects of EMFs on some biological Parameters in coffee plants (Coffea arabica L) Obtained by in vitro propagation . Pol. J. Environ. Stud. 23 (1), 95–101.
    1. Apasheva L. M., Lobanov A. V., Komissarov G. G. (2006). Effect of alternating electromagnetic field on early stages of plant development. Dokl. Biochem. Biophys. 406, 1–3. 10.1134/s1607672906010017 - DOI - PubMed
    1. Baird C. S. (2021). Electromagnetic field. New York: McGraw Hill.
    1. Banerjee S. K. (2001). Geophysics. When the compass stopped reversing its poles. Science 291 (5509), 1714–1715. 10.1126/science.291.5509.1714 - DOI - PubMed

LinkOut - more resources