. 2023 Jul:104:87-148.
doi: 10.3114/sim.2022.104.02. Epub 2023 Feb 22.

Fusarium diversity associated with diseased cereals in China, with an updated phylogenomic assessment of the genus

Affiliations

Fusarium diversity associated with diseased cereals in China, with an updated phylogenomic assessment of the genus

S L Han et al. Stud Mycol. 2023 Jul.

Abstract

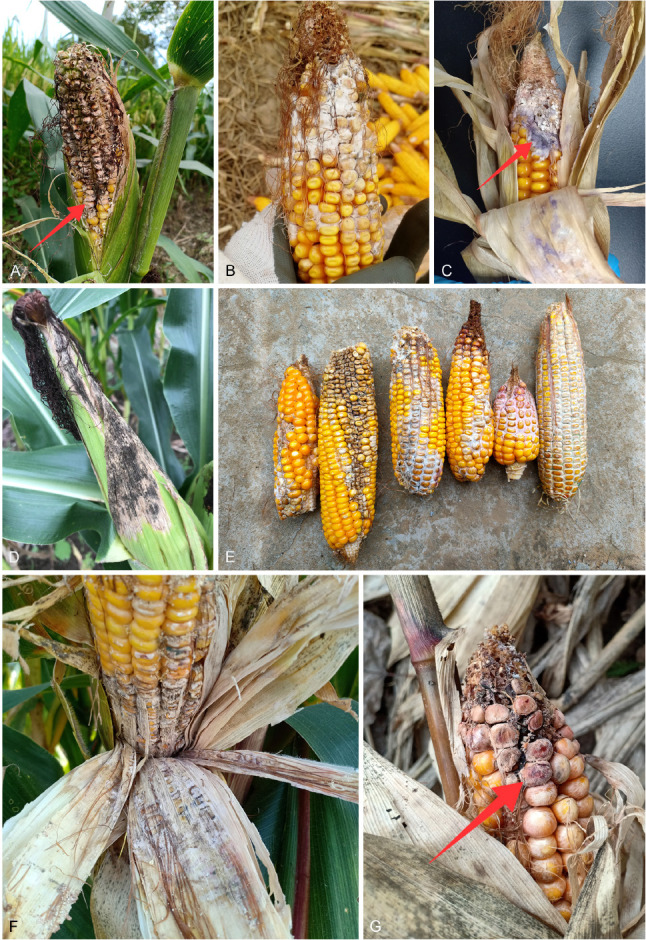
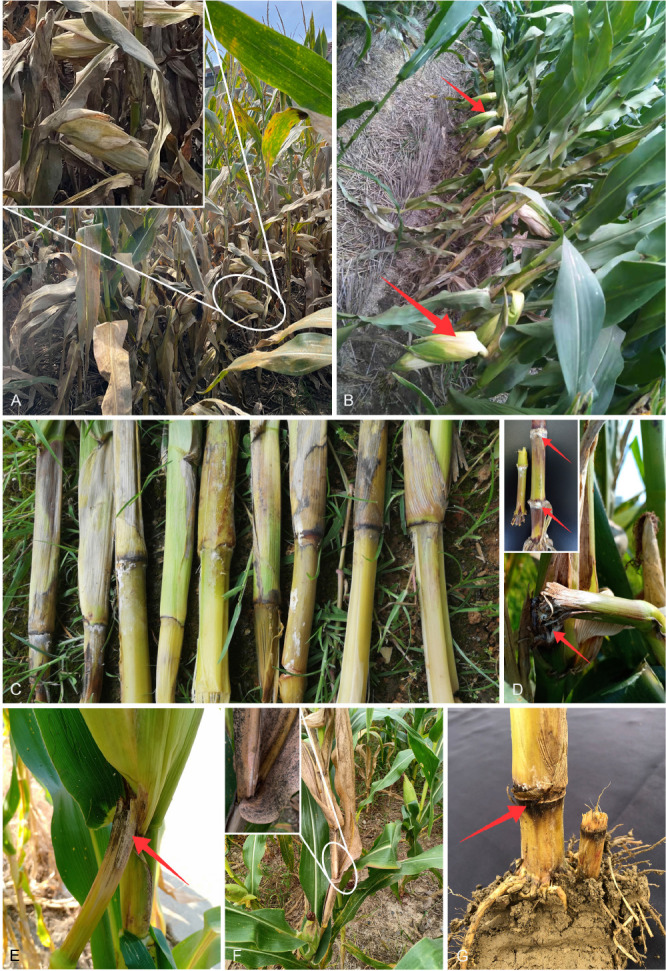
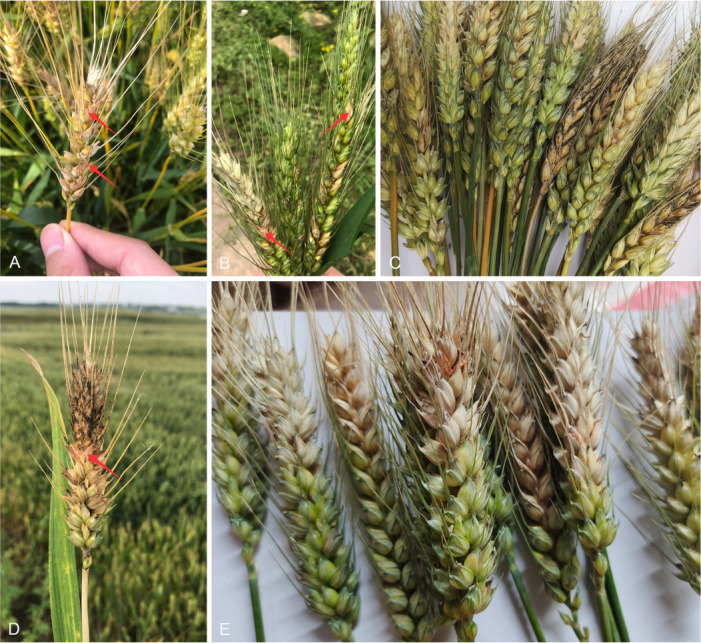
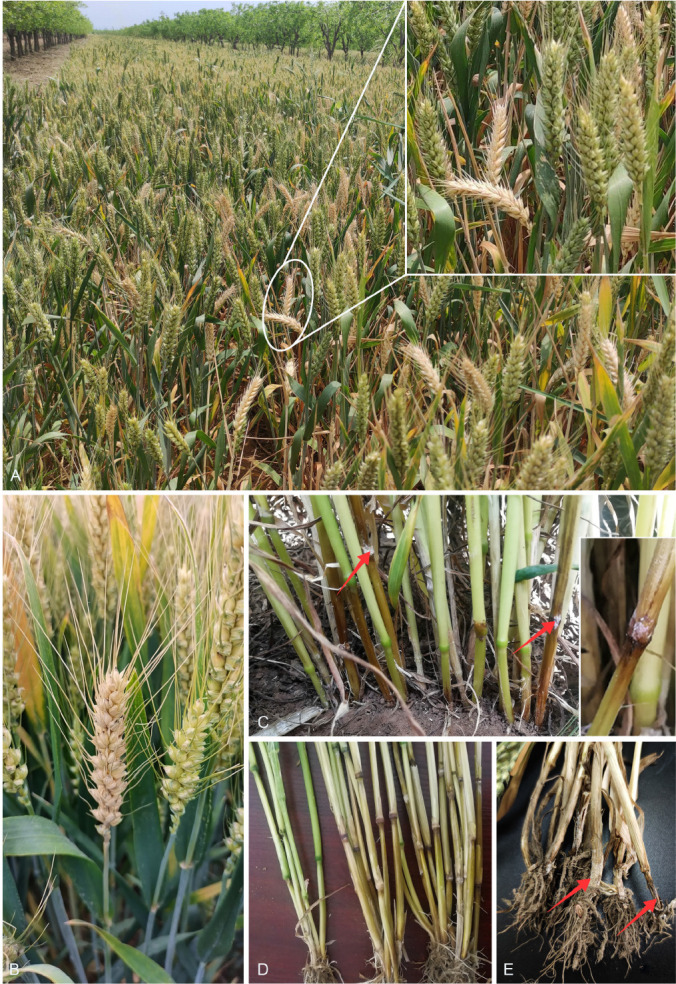
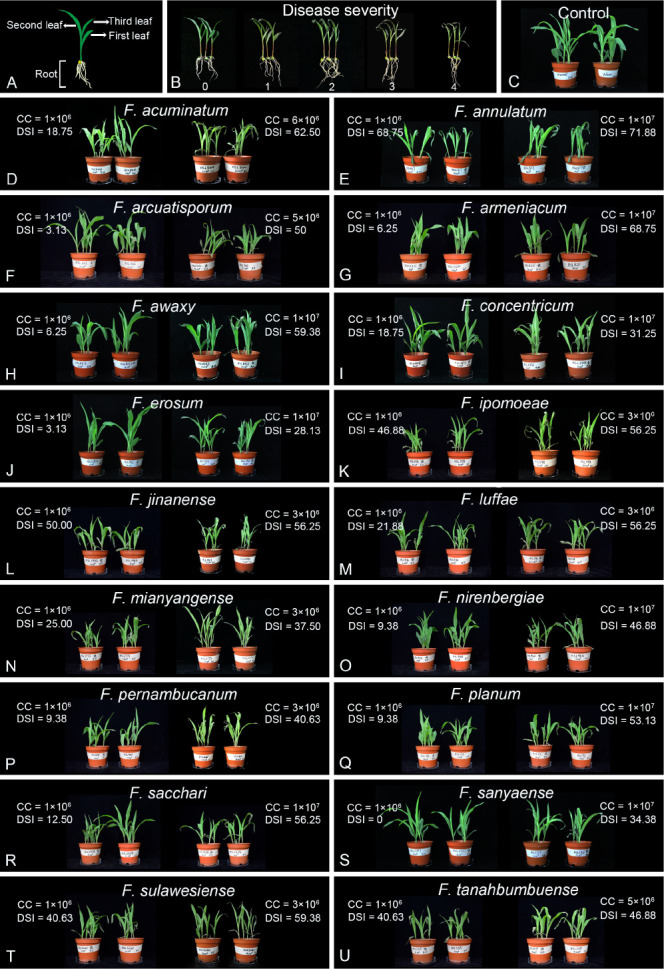
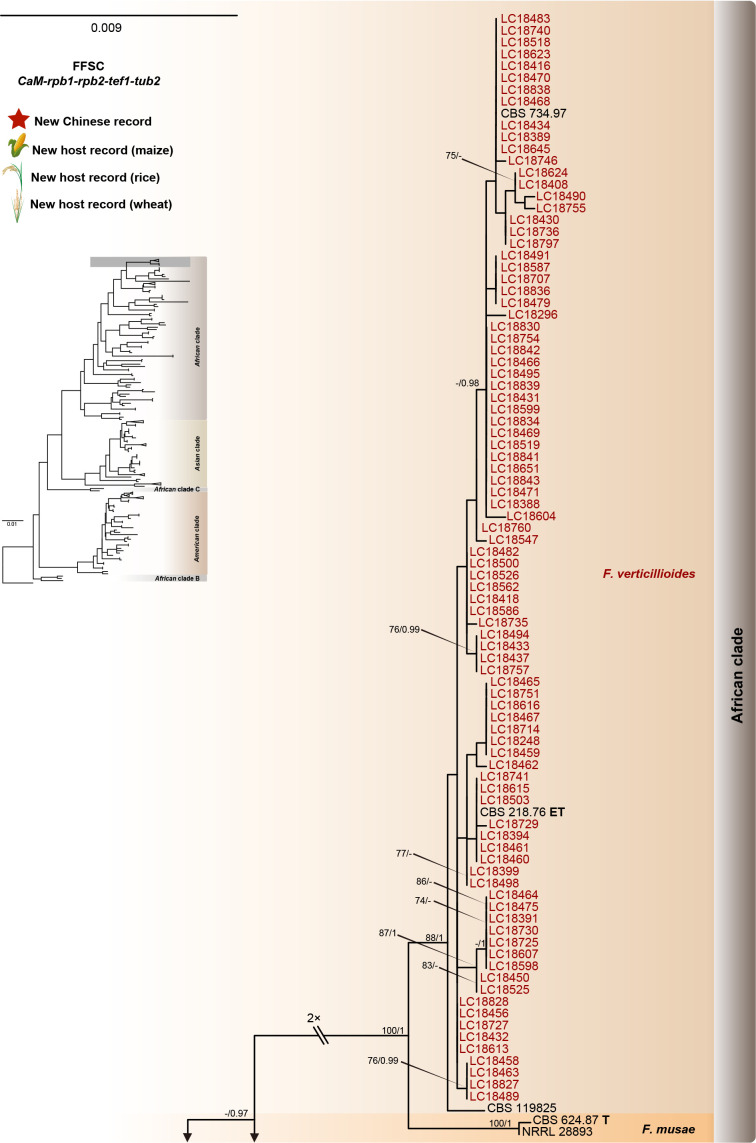
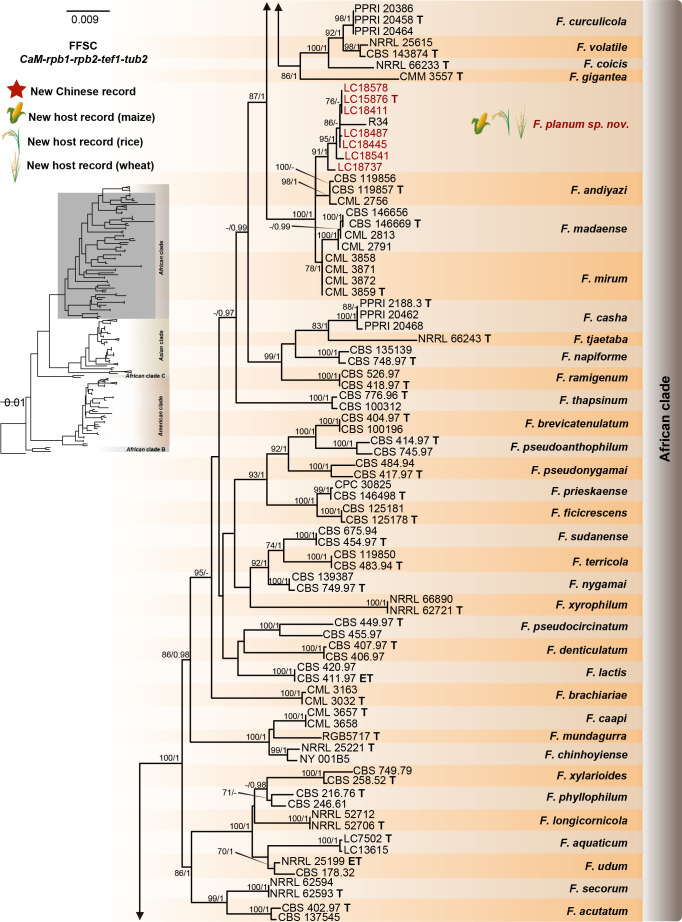
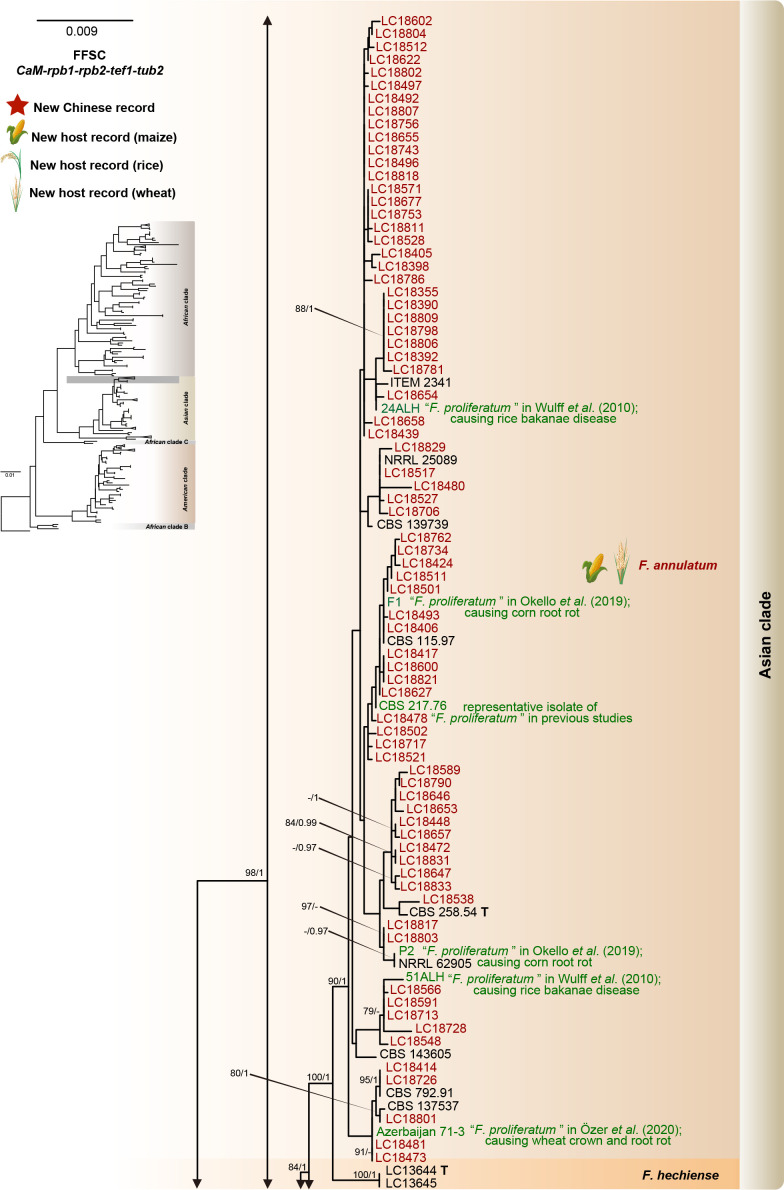
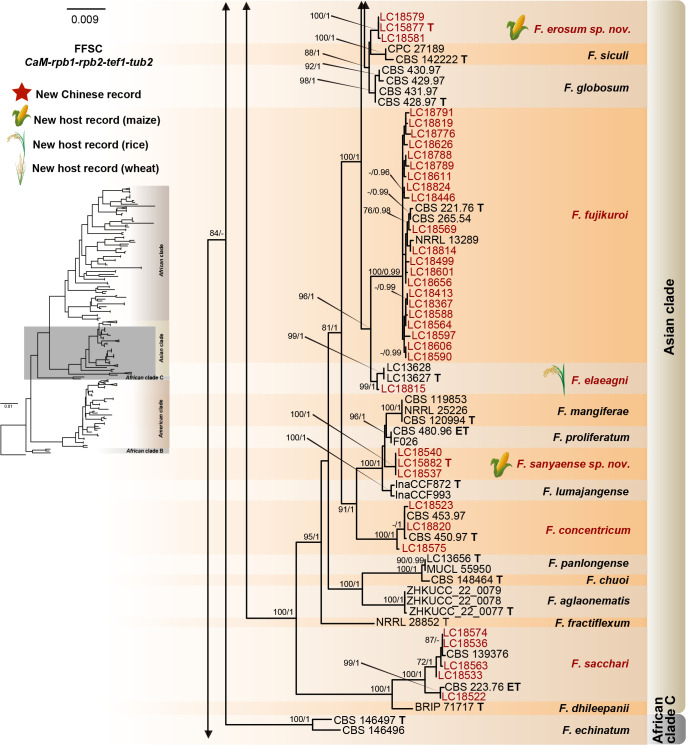
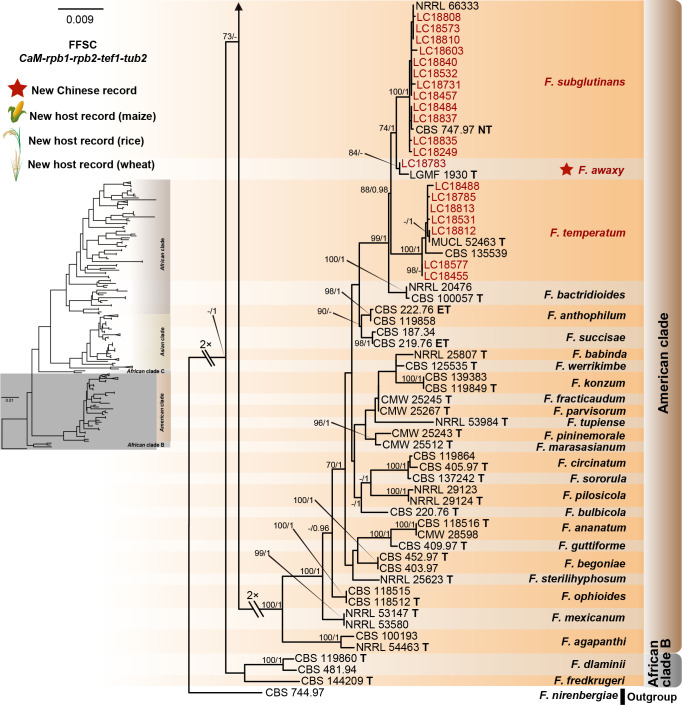
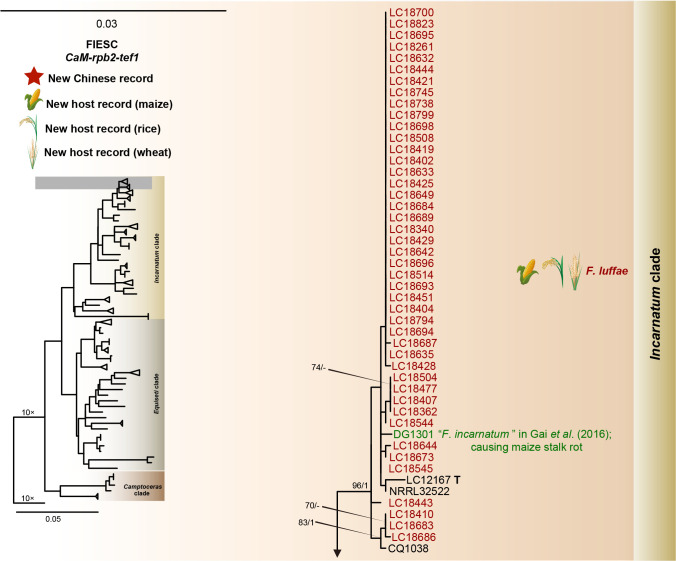
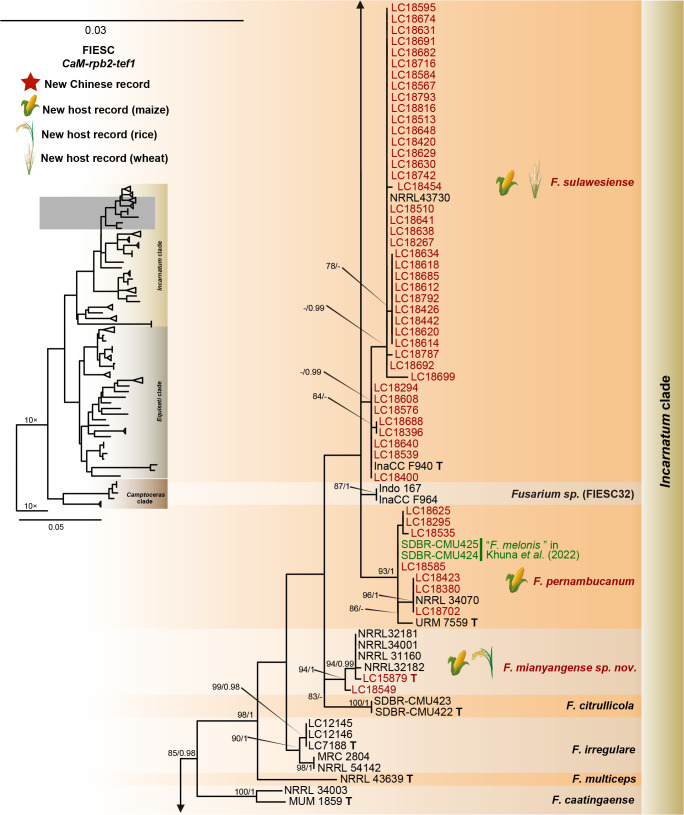
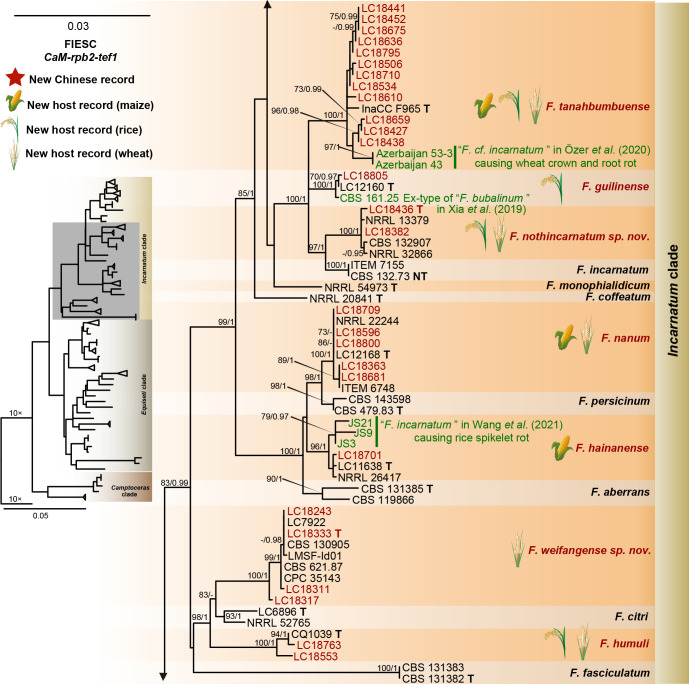
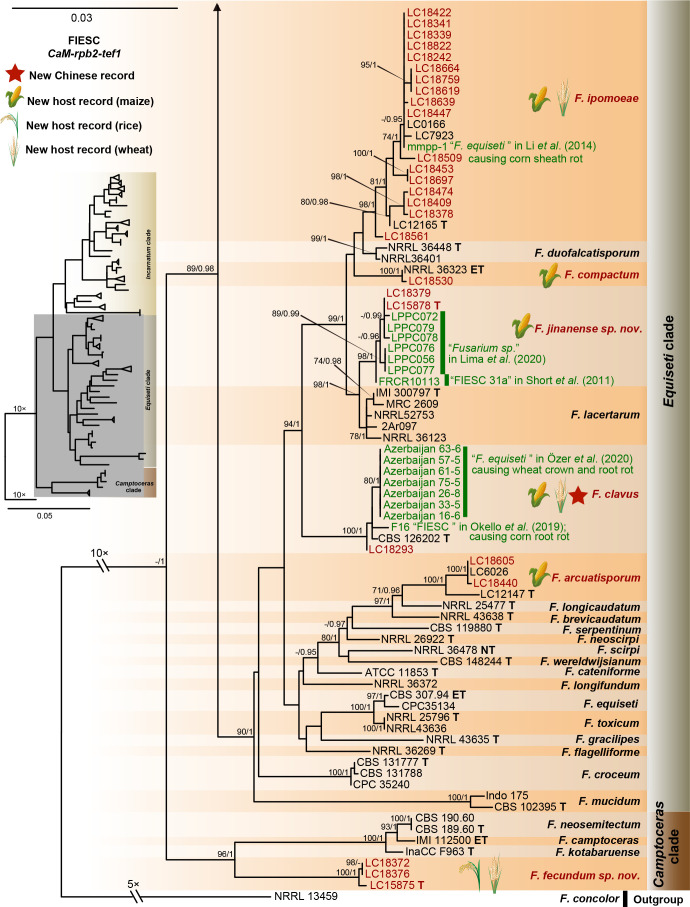
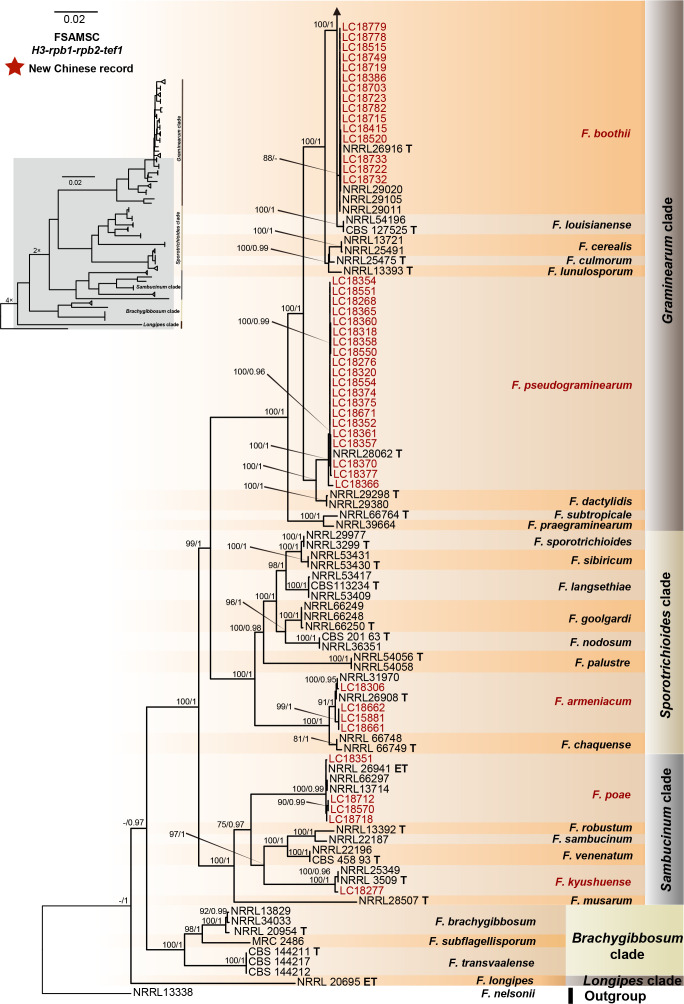
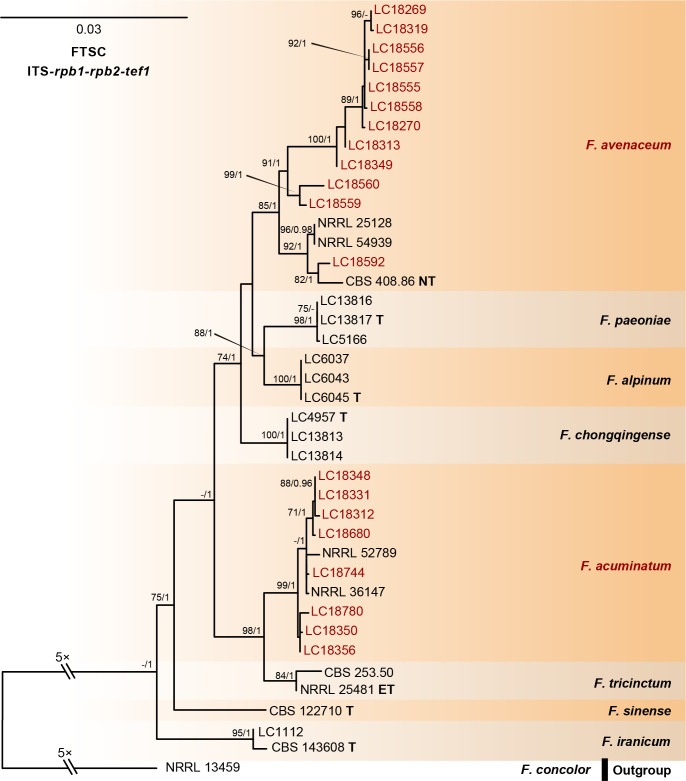
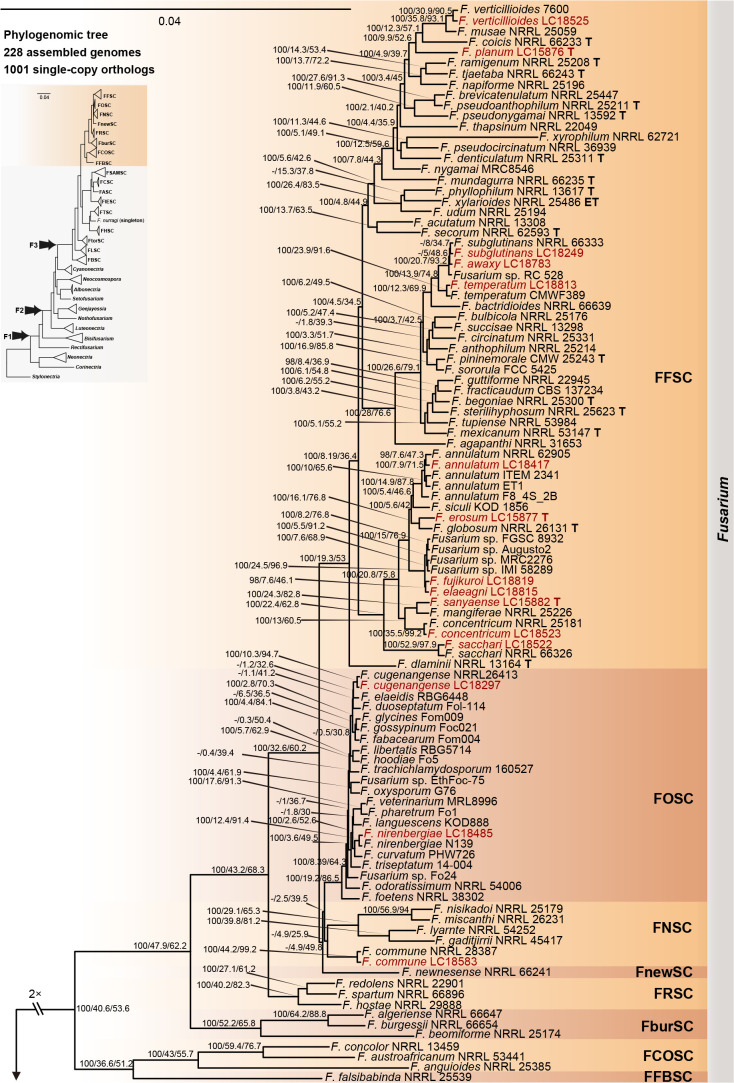
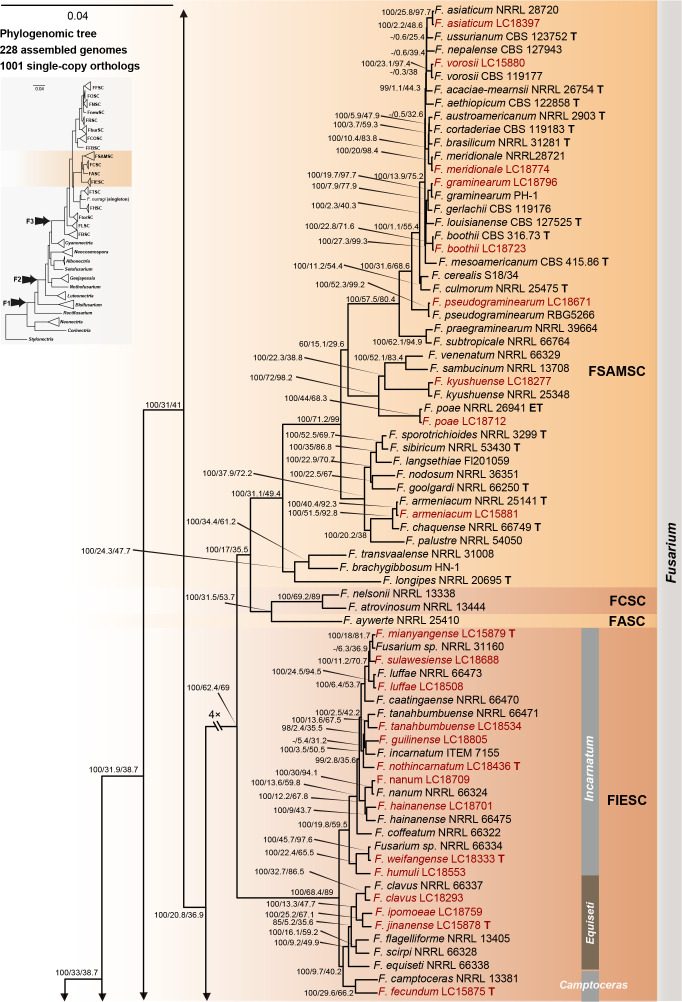
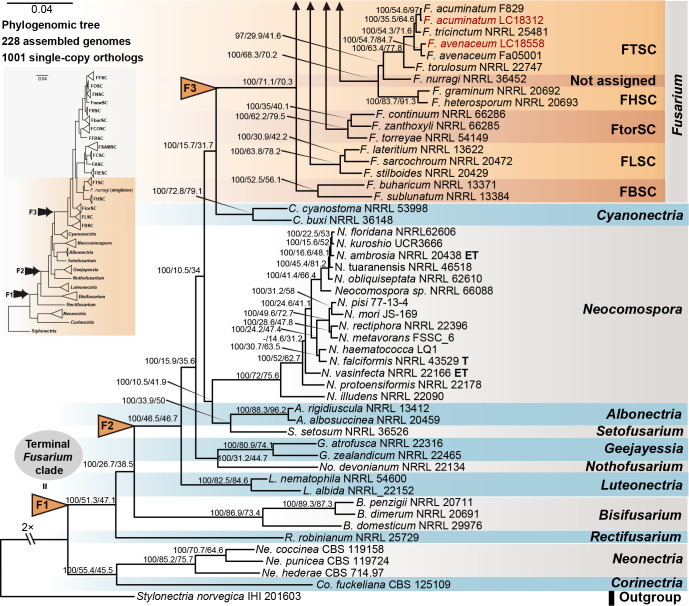
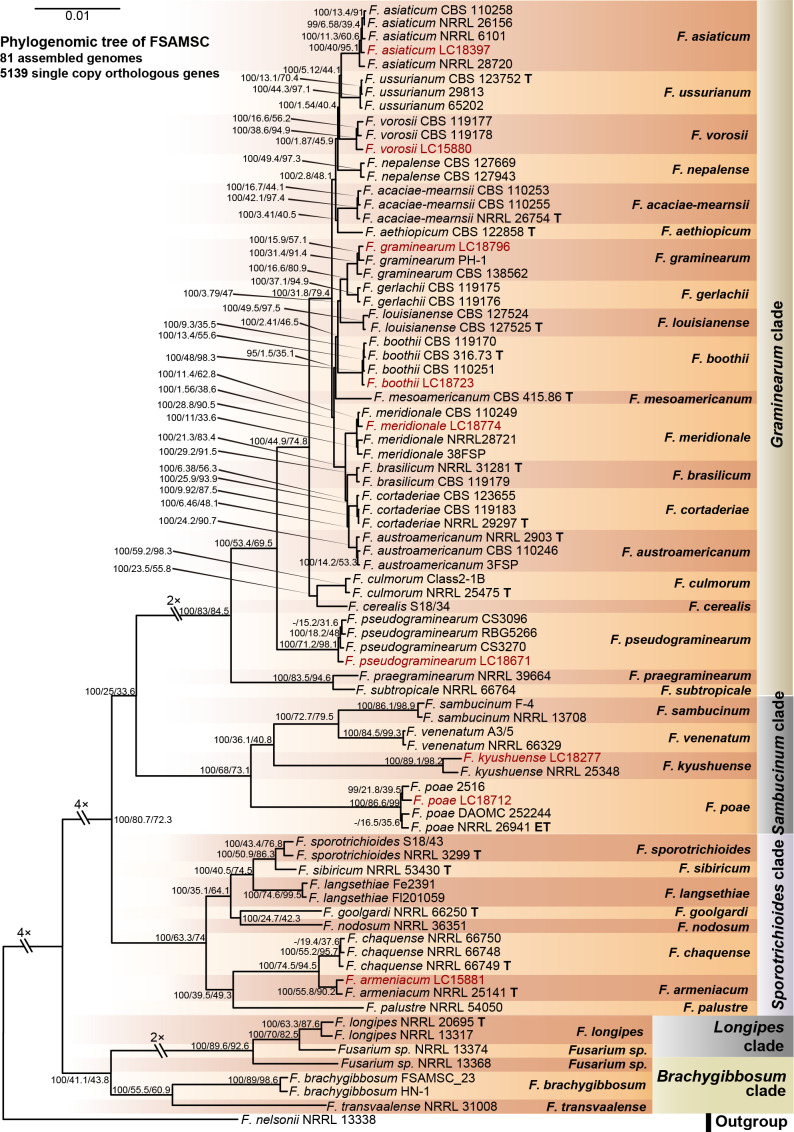
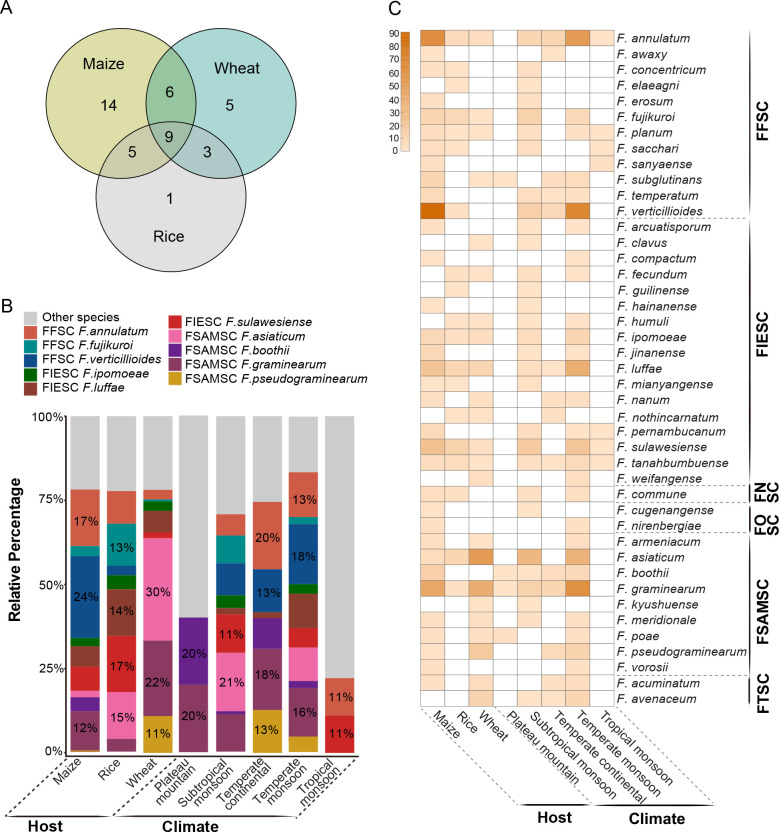
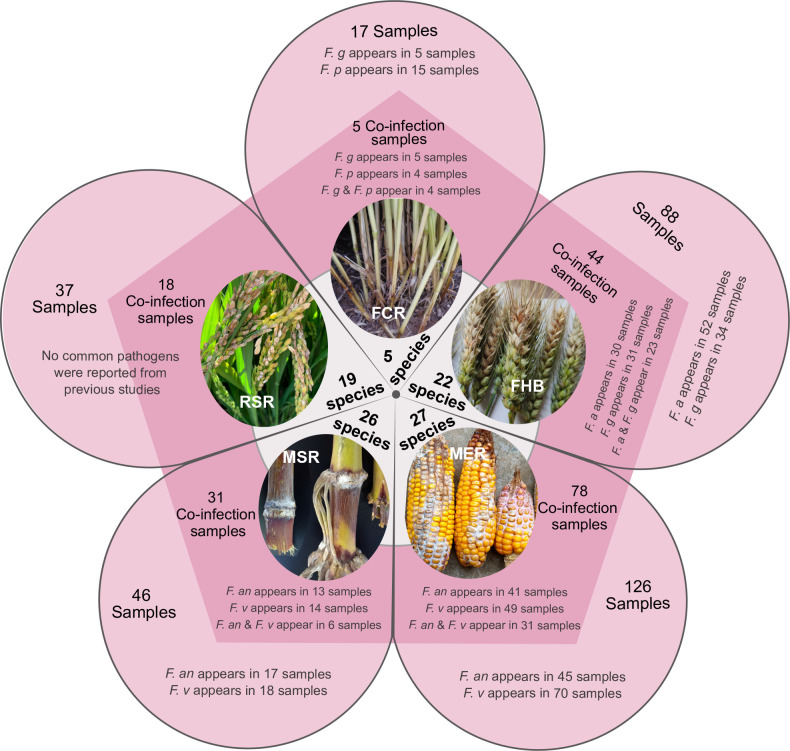
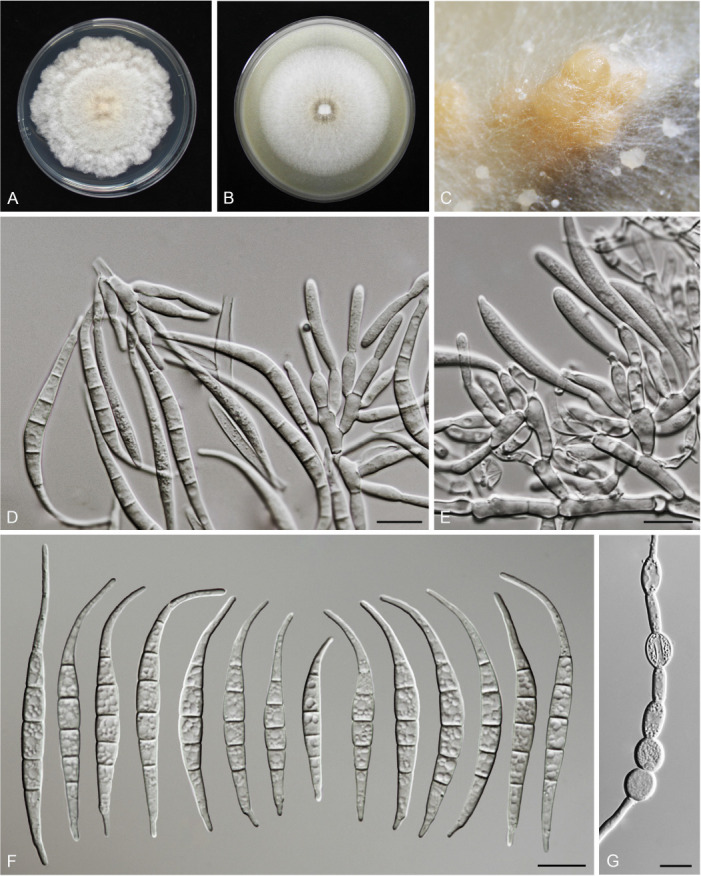
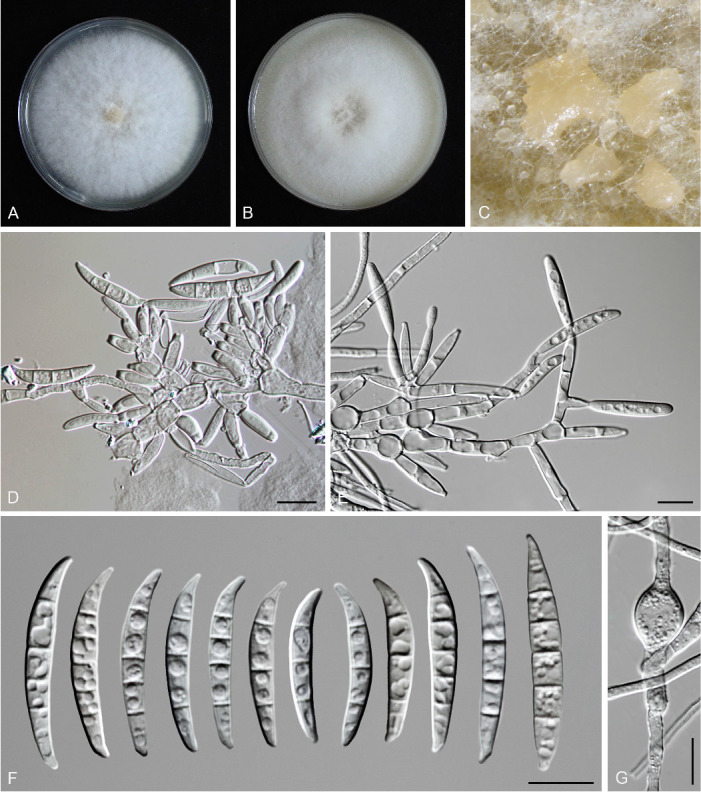
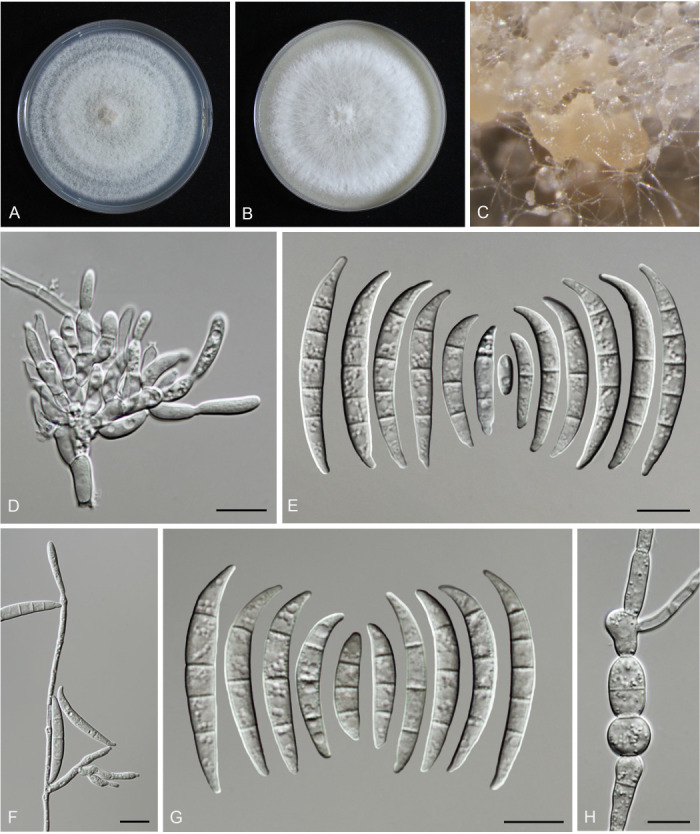
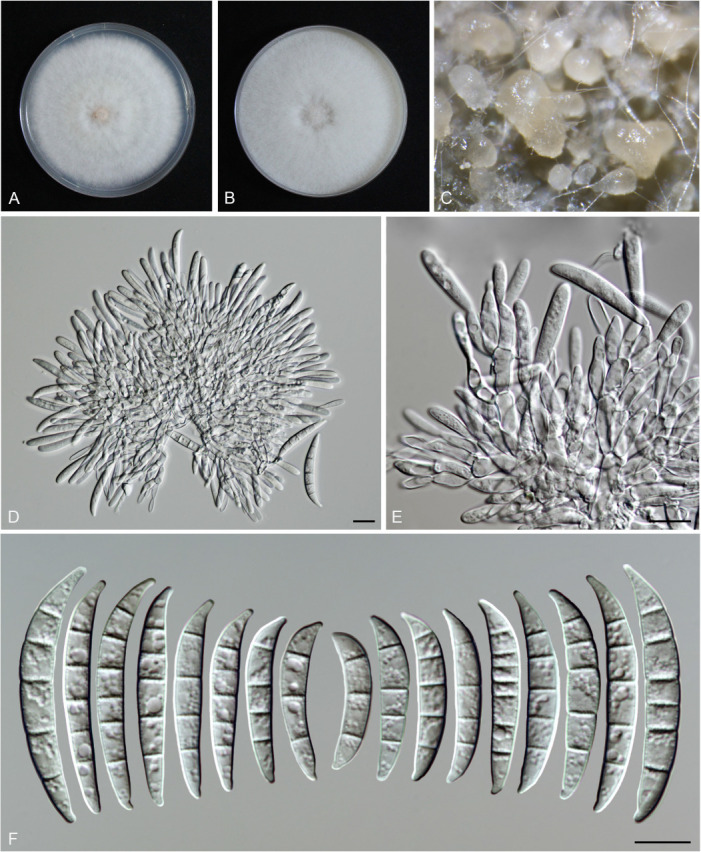
Fusarium species are important cereal pathogens that cause severe production losses to major cereal crops such as maize, rice, and wheat. However, the causal agents of Fusarium diseases on cereals have not been well documented because of the difficulty in species identification and the debates surrounding generic and species concepts. In this study, we used a citizen science initiative to investigate diseased cereal crops (maize, rice, wheat) from 250 locations, covering the major cereal-growing regions in China. A total of 2 020 Fusarium strains were isolated from 315 diseased samples. Employing multi-locus phylogeny and morphological features, the above strains were identified to 43 species, including eight novel species that are described in this paper. A world checklist of cereal-associated Fusarium species is provided, with 39 and 52 new records updated for the world and China, respectively. Notably, 56 % of samples collected in this study were observed to have co-infections of more than one Fusarium species, and the detailed associations are discussed. Following Koch's postulates, 18 species were first confirmed as pathogens of maize stalk rot in this study. Furthermore, a high-confidence species tree was constructed in this study based on 1 001 homologous loci of 228 assembled genomes (40 genomes were sequenced and provided in this study), which supported the "narrow" generic concept of Fusarium (= Gibberella). This study represents one of the most comprehensive surveys of cereal Fusarium diseases to date. It significantly improves our understanding of the global diversity and distribution of cereal-associated Fusarium species, as well as largely clarifies the phylogenetic relationships within the genus. Taxonomic novelties: New species: Fusarium erosum S.L. Han, M.M. Wang & L. Cai, Fusarium fecundum S.L. Han, M.M. Wang & L. Cai, Fusarium jinanense S.L. Han, M.M. Wang & L. Cai, Fusarium mianyangense S.L. Han, M.M. Wang & L. Cai, Fusarium nothincarnatum S.L. Han, M.M. Wang & L. Cai, Fusarium planum S.L. Han, M.M. Wang & L. Cai, Fusarium sanyaense S.L. Han, M.M. Wang & L. Cai, Fusarium weifangense S.L. Han, M.M. Wang & L. Cai. Citation: Han SL, Wang MM, Ma ZY, Raza M, Zhao P, Liang JM, Gao M, Li YJ, Wang JW, Hu DM, Cai L (2023). Fusarium diversity associated with diseased cereals in China, with an updated phylogenomic assessment of the genus. Studies in Mycology 104: 87-148. doi: 10.3114/sim.2022.104.02.

Keywords: Cereal pathogens; citizen science; co-infection; new taxa; pathobiome; phylogeny; species complexes; systematics.


Conflict of interest statement

The authors declare that there is no conflict of interest.

Figures

Fig. 1.
Fig. 1.
Field symptoms of maize ear rot (MER). A. Kernels covered with salmon-coloured powdery molds and accompanied by insect injury. B. Kernels covered with white moulds. C. Kernels covered with orchid-coloured mycelia. D, F. Ears covered with whitish or a mixture of pinkish and blackish powdery moulds coexist with symptoms caused by other fungi. E. Kernels covered with white moulds or violet mycelia. G. Kernels covered with salmon-coloured powdery moulds. Note: Maize ear rot caused by Fusarium was referred to as Fusarium ear rot of maize (Zhang et al. 2014a), Fusarium maize ear rot (Zhang et al. 2014b), Gibberella/red ear rot (Lana et al. 2022) and Fusarium/pink ear rot (Zhang et al. 2016) in various previous studies. To avoid confusion, in this study we refer to this disease as maize ear rot (MER).
Fig. 2.
Fig. 2.
Field symptoms of maize stalk rot (MSR). A, B. Maize ear drooping without shedding. C. Stalks turn grey green; internodes turn straw-coloured or dark brown. D. Stalks covered with whitish mycelia. E, F. Stalks were covered with salmon-coloured powdery moulds and snapped at the nodes. G. Rotted and brownish stalks. Note: Maize stalk rot caused by Fusarium, known as Fusarium stalk rot (Jiang et al. 2021), Gibberella stalk rot in maize (Ye et al. 2013) in previous literature, is herein universally referred to as maize stalk rot (MSR) in this paper.
Fig. 3.
Fig. 3.
Field symptoms of Fusarium head blight of wheat (FHB). A–E. Head blight of wheat accompanied by pinkish mould and/or whitish mycelia. Note: The disease name Fusarium head blight (FHB) is adopted in this paper, which was also called wheat head blight and wheat scab in literature (O’Donnell et al. 2000a).
Fig. 4.
Fig. 4.
Field symptoms of Fusarium crown rot of wheat (FCR). A, B. “White-head” of wheat tillers. C, D. Reddish-brown discoloration on the lower stems. E. Dark brown to black discolouration on the crowns and roots. Note: The disease name Fusarium crown rot of wheat (FCR) is adopted in this paper, which was also referred to as wheat crown rot (Zhang et al. 2015), crown rot of wheat in previous literature (Li et al. 2016).
Fig. 5.
Fig. 5.
Field symptoms of Fusarium diseases on rice. A. Rice bakanae disease (RBD), caused by F. fujikuroi, showing elongated barren seedlings. B–E. Rice spikelet rot (RSR), caused by multiple Fusarium species, showing reddish or brown discoloration on the glumes, sometimes with salmon-coloured and/or whitish powdery mould. Note: The disease name rice spikelet rot (RSR) is adopted in this paper, which was also known as Fusarium head blight in rice in literature (Liu et al. 2022d).
Fig. 6.
Fig. 6.
Maps showing sampling sites in China, generated by ArcGIS v. 10.5 software (Esri, Redlands, CA, USA). A. Map showing the distribution of 172 diseased maize samples collected in this study. B. Map showing the distribution of 38 diseased rice samples collected in this study. C. Map showing the distribution of 105 diseased wheat samples collected in this study. D. Map showing the overall distribution of a total of 315 diseased samples collected in this study.
Fig. 7.
Fig. 7.
Pathogenicity test of maize stalk rot (MSR) fulfilling Koch’s postulates. A. Diagram of a three-leaf-old seedlings of maize. B. Typical symptoms of disease severity (0–4). C. Blank control treated with sterile water. D–U. Maize seedlings treated with different Fusarium suspensions. The conidial concentration (CC) of Fusarium strains and disease severity index (DSI) of infected plants were listed. DSI (%) = [sum (class frequency × score of rating class)/(total number of plants × maximal disease severity score)] × 100.
Fig. 8.
Fig. 8.
Phylogeny inferred based on the combined CaM-rpb1-rpb2-tef1-tub2 gene regions of the Fusarium fujikuroi species complex (FFSC). Fusarium nirenbergiae (CBS 744.97) was used as an outgroup. Strains isolated in this study were indicated in red. Pathogenetic strains from previous studies were indicated in green. The RAxML Bootstrap support values (ML-BS > 70 %) and Bayesian posterior probabilities (BI-PP > 0.9) were displayed at the nodes (ML-BS / BI-PP). Ex-type, ex-epitype and ex-neotype strains were indicated in bold with T, ET, and NT, respectively.
Fig. 8.
Fig. 8.
Phylogeny inferred based on the combined CaM-rpb1-rpb2-tef1-tub2 gene regions of the Fusarium fujikuroi species complex (FFSC). Fusarium nirenbergiae (CBS 744.97) was used as an outgroup. Strains isolated in this study were indicated in red. Pathogenetic strains from previous studies were indicated in green. The RAxML Bootstrap support values (ML-BS > 70 %) and Bayesian posterior probabilities (BI-PP > 0.9) were displayed at the nodes (ML-BS / BI-PP). Ex-type, ex-epitype and ex-neotype strains were indicated in bold with T, ET, and NT, respectively.
Fig. 9.
Fig. 9.
Phylogeny inferred based on the combined CaM-rpb2-tef1 gene regions of the Fusarium incarnatum-equiseti species complex (FIESC). Fusarium concolor (NRRL 13459) was used as an outgroup. Strains isolated in this study were indicated in red. Pathogenetic strains from previous studies were indicated in green. The RAxML Bootstrap support values (ML-BS > 70 %) and Bayesian posterior probabilities (BI-PP > 0.9) were displayed at the nodes (ML-BS / BI-PP). Ex-type, ex-epitype and ex-neotype strains were indicated in bold with T, ET, and NT, respectively.
Fig. 9.
Fig. 9.
Phylogeny inferred based on the combined CaM-rpb2-tef1 gene regions of the Fusarium incarnatum-equiseti species complex (FIESC). Fusarium concolor (NRRL 13459) was used as an outgroup. Strains isolated in this study were indicated in red. Pathogenetic strains from previous studies were indicated in green. The RAxML Bootstrap support values (ML-BS > 70 %) and Bayesian posterior probabilities (BI-PP > 0.9) were displayed at the nodes (ML-BS / BI-PP). Ex-type, ex-epitype and ex-neotype strains were indicated in bold with T, ET, and NT, respectively.
Fig. 10.
Fig. 10.
Phylogeny inferred based on the combined rpb1-rpb2-tef1 gene regions of the Fusarium nisikadoi species complex (FNSC). Fusarium concolor (NRRL 13994) was used as an outgroup. Strains isolated in this study were indicated in red. The RAxML Bootstrap support values (ML-BS > 70 %) and Bayesian posterior probabilities (BI-PP > 0.9) were displayed at the nodes (ML-BS / BI-PP). Ex-type strains were indicated in bold with T.
Fig. 11.
Fig. 11.
Phylogeny inferred based on the combined CaM-rpb2-tef1 gene regions of the Fusarium oxysporum species complex (FOSC). Fusarium udum (CBS 177.31) was used as an outgroup. Strains isolated in this study were indicated in red. The RAxML Bootstrap support values (ML-BS > 70 %) and Bayesian posterior probabilities (BI-PP > 0.9) were displayed at the nodes (ML-BS / BI-PP). Ex-type strains were indicated in bold with T.
Fig. 12.
Fig. 12.
Phylogeny inferred based on the combined H3-rpb1-rpb2-tef1 gene regions of the Fusarium sambucinum species complex (FSAMSC). Fusarium nelsonii (NRRL 13338) was used as an outgroup. Strains isolated in this study were indicated in red. The RaxML Bootstrap support values (ML-BS > 70 %) and Bayesian posterior probabilities (BI-PP > 0.9) were displayed at the nodes (ML-BS / BI-PP). Ex-type and ex-epitype strains were indicated in bold with T and ET, respectively.
Fig. 12.
Fig. 12.
Phylogeny inferred based on the combined H3-rpb1-rpb2-tef1 gene regions of the Fusarium sambucinum species complex (FSAMSC). Fusarium nelsonii (NRRL 13338) was used as an outgroup. Strains isolated in this study were indicated in red. The RaxML Bootstrap support values (ML-BS > 70 %) and Bayesian posterior probabilities (BI-PP > 0.9) were displayed at the nodes (ML-BS / BI-PP). Ex-type and ex-epitype strains were indicated in bold with T and ET, respectively.
Fig. 13.
Fig. 13.
Phylogeny inferred based on the combined ITS-rpb1-rpb2-tef1 gene regions of the Fusarium tricinctum species complex (FTSC). Fusarium concolor (NRRL 13459) was used as an outgroup. Strains isolated in this study were indicated in red. The RAxML Bootstrap support values (ML-BS > 70 %) and Bayesian posterior probabilities (BI-PP > 0.9) were displayed at the nodes (ML-BS / BI-PP). Ex-type, ex-epitype, and ex-neotype strains were indicated in bold with T, ET, and NT, respectively.
Fig. 14.
Fig. 14.
Maximum likelihood phylogenomic tree of Fusarium and allied genera. A total of 1 001 single-copy orthologs were employed in the analysis. Stylonectria norvegica IHI 201603 was used as an outgroup. Strains sequenced in this study were indicated in red. The IQ-TREE ultrafast bootstrap support values (UFBoot ≥ 95 %), gCF and sCF values were displayed at the nodes (UFBoot / gCF / sCF). Arrows “F1” (= “Terminal Fusarium clade”), “F2” and “F3” indicate the three alternative Fusarium generic hypotheses sensu Geiser et al. (2013). Ex-type, ex-epitype and ex-neotype strains were indicated in bold with T, ET, and NT, respectively. Subdivision of the Fusarium clade represents the recognised species complexes, including F. aywerte SC (FASC), F. buharicum SC (FBSC), F. burgessii SC (FburSC), F. chlamydosporum SC (FCSC), F. concolor SC (FCOSC), F. falsibabinda SC (FFBSC), F. fujikuroi SC (FFSC), F. heterosporum SC (FHSC), F. incarnatum-equiseti SC (FIESC), F. lateritium SC (FLSC), F. newnesense SC (FnewSC), F. nisikadoi SC (FNSC), F. oxysporum SC (FOSC), F. redolens SC (FRSC), F. sambucinum SC (FSAMSC), F. torreyae SC (FtorSC) and F. tricinctum SC (FTSC).
Fig. 14.
Fig. 14.
Maximum likelihood phylogenomic tree of Fusarium and allied genera. A total of 1 001 single-copy orthologs were employed in the analysis. Stylonectria norvegica IHI 201603 was used as an outgroup. Strains sequenced in this study were indicated in red. The IQ-TREE ultrafast bootstrap support values (UFBoot ≥ 95 %), gCF and sCF values were displayed at the nodes (UFBoot / gCF / sCF). Arrows “F1” (= “Terminal Fusarium clade”), “F2” and “F3” indicate the three alternative Fusarium generic hypotheses sensu Geiser et al. (2013). Ex-type, ex-epitype and ex-neotype strains were indicated in bold with T, ET, and NT, respectively. Subdivision of the Fusarium clade represents the recognised species complexes, including F. aywerte SC (FASC), F. buharicum SC (FBSC), F. burgessii SC (FburSC), F. chlamydosporum SC (FCSC), F. concolor SC (FCOSC), F. falsibabinda SC (FFBSC), F. fujikuroi SC (FFSC), F. heterosporum SC (FHSC), F. incarnatum-equiseti SC (FIESC), F. lateritium SC (FLSC), F. newnesense SC (FnewSC), F. nisikadoi SC (FNSC), F. oxysporum SC (FOSC), F. redolens SC (FRSC), F. sambucinum SC (FSAMSC), F. torreyae SC (FtorSC) and F. tricinctum SC (FTSC).
Fig. 15.
Fig. 15.
Maximum likelihood phylogenomic tree of the Fusarium sambucinum species complex (FSAMSC). A total of 5 139 single copy orthologs were employed in the analysis. F. nelsonii (NRRL 13338) was used as an outgroup. Strains sequenced in this study were indicated in red. The IQ-TREE ultrafast bootstrap support values (UFBoot ≥ 95 %), gCF and sCF values were displayed at the nodes (UFBoot / gCF / sCF). Ex-type and ex-epitype strains were indicated in bold with T and ET, respectively.
Fig. 16.
Fig. 16.
A. The number of unique and shared Fusarium species among different hosts. B. The relative percentage of Fusarium species in different groups (host: maize, rice, wheat; climate regions: regions affected by plateau mountain, subtropical monsoon, temperate continental, temperate monsoon, and tropical monsoon climate). The smaller proportion strains of Fusarium were defined as “Other species”, including F. acuminatum, F. arcuatisporum, F. armeniacum, F. awaxy, F. clavus, F. commune, F. compactum, F. concentricum, F. cugenangense, F. elaeagni, F. erosum, F. fecundum, F. guilinense, F. hainanense, F. humuli, F. ipomoeae, F. jinanense, F. kyushuense, F. meridionale, F. mianyangense, F. nanum, F. nirenbergiae, F. nothincarnatum, F. pernambucanum, F. planum, F. poae, F. sacchari, F. sanyaense, F. subglutinans, F. tanahbumbuense, F. temperatum, F. vorosii, and F. weifangense. C. Detailed information on Fusarium composition among different hosts and climate regions. The number of isolates (0–90) was represented by the shade of colour (light to dark).
Fig. 17.
Fig. 17.
Summary of co-infections discovered in this study. The white circle represents the number of species isolated from different disease samples (only one species was isolated from the rice bakanae disease sample, thus information was not shown in this figure). The pentagon represents the number of co-infection samples, also marked the occurrence of common pathogens, including F. a, F. an, F. g, F. p and F. v. The outside sectors of pentagon represent the number of whole samples, also marked the occurrence of common pathogens as previously mentioned. Abbreviations: Fusarium crown rot of wheat (FCR), Fusarium head blight of wheat (FHB), maize ear rot (MER), maize stalk rot (MSR), rice spikelet rot (RSR), F. asiaticum (F. a), F. annulatum (F. an), F. graminearum (F. g), F. pseudograminearum (F. p), F. verticillioides (F. v).
Fig. 18.
Fig. 18.
Morphology of Fusarium erosum (CGMCC3.23518, ex-type culture). A. Colony on PDA. B. Colony on OA. C. Sporodochia. D. Sporodochial conidiophores and phialides. E. Sporodochial conidia. F. Aerial conidiophores and phialides. G. Phialides and aerial conidia. Scale bars = 10 μm.
Fig. 19.
Fig. 19.
Morphology of Fusarium planum (CGMCC3.23517, ex-type culture). A. Colony on PDA. B. Colony on OA. C. Sporodochia. D. Sporodochial conidiophores and phialides. E. Sporodochial conidia. F. Aerial conidiophores and phialides. G. Aerial conidia. Scale bars = 10 μm.
Fig. 20.
Fig. 20.
Morphology of Fusarium sanyaense (CGMCC3.23523, ex-type culture). A. Colony on PDA. B. Colony on OA. C. Sporodochia. D. Sporodochial conidiophores and phialides. E. Sporodochial conidia. F. Aerial conidiophores and phialides. G. Aerial conidia. Scale bars = 10 μm.
Fig. 21.
Fig. 21.
Morphology of Fusarium fecundum (CGMCC3.23516, ex-type culture). A. Colony on PDA. B. Colony on OA. C–E. Aerial conidiophores and phialides. F. Aerial conidia. Scale bars = 10 μm.
Fig. 22.
Fig. 22.
Morphology of Fusarium jinanense (CGMCC3.23519, ex-type culture). A. Colony on PDA. B. Colony on OA. C. Sporodochia. D, E. Sporodochial conidiophores and phialides. F. Sporodochial conidia. G. Chlamydospores. Scale bars = 10 μm.
Fig. 23.
Fig. 23.
Morphology of Fusarium mianyangense (CGMCC3.23520, ex-type culture). A. Colony on PDA. B. Colony on OA. C. Sporodochia. D, E. Sporodochial conidiophores and conidiogenous cells. F. Sporodochial conidia. G. Chlamydospores. Scale bars = 10 μm.
Fig. 24.
Fig. 24.
Morphology of Fusarium nothincarnatum (CGMCC3.24286, ex-type culture). A. Colony on PDA. B. Colony on OA. C. Sporodochia. D. Sporodochial conidiophores and conidiogenous cells. E. Sporodochial conidia. F. Aerial conidiophores and phialides. G. Aerial conidia. H. Chlamydospores. Scale bars = 10 μm.
Fig. 25.
Fig. 25.
Morphology of Fusarium weifangense (CGMCC3.24285, ex-type culture). A. Colony on PDA. B. Colony on OA. C. Sporodochia. D, E. Sporodochial conidiophores and conidiogenous cells. F. Sporodochial conidia. Scale bars = 10 μm.

References

    1. Aamot HU, Ward TJ, Brodal G, et al. (2015). Genetic and phenotypic diversity within the Fusarium graminearum species complex in Norway. European Journal of Plant Pathology 142: 501–519.
    1. Abdallah-Nekache N, Laraba I, Ducos C, et al. (2019). Occurrence of Fusarium head blight and Fusarium crown rot in Algerian wheat: identification of associated species and assessment of aggressiveness. European Journal of Plant Pathology 154: 499–512.
    1. Abdul Rahm M, Mohamed Gh K, Essia Reha NA. (2020). Prevalence and transmission of seed-borne fungi of maize and their control by phenolic antioxidants. Plant Pathology Journal 19: 176–184.
    1. Adikaram NKB, Yakandawala DMD. (2020). A checklist of plant pathogenic fungi and Oomycota in Sri Lanka. Ceylon Journal of Science 49: 93–123.
    1. Aguín O, Cao A, Pintos C, et al. (2014). Occurrence of Fusarium species in maize kernels grown in north western Spain. Plant Pathology 63: 946–951.

LinkOut - more resources