. 2023 Sep 4;222(9):e202302102.
doi: 10.1083/jcb.202302102. Epub 2023 Jun 23.

Architecture of the cortical actomyosin network driving apical constriction in C. elegans

Affiliations

Architecture of the cortical actomyosin network driving apical constriction in C. elegans

Pu Zhang et al. J Cell Biol. .

Abstract

Apical constriction is a cell shape change that drives key morphogenetic events during development, including gastrulation and neural tube formation. The forces driving apical constriction are primarily generated through the contraction of apicolateral and/or medioapical actomyosin networks. In the Drosophila ventral furrow, the medioapical actomyosin network has a sarcomere-like architecture, with radially polarized actin filaments and centrally enriched non-muscle myosin II and myosin activating kinase. To determine if this is a broadly conserved actin architecture driving apical constriction, we examined actomyosin architecture during C. elegans gastrulation, in which two endodermal precursor cells internalize from the surface of the embryo. Quantification of protein localization showed that neither the non-muscle myosin II NMY-2 nor the myosin-activating kinase MRCK-1 is enriched at the center of the apex. Further, visualization of barbed- and pointed-end capping proteins revealed that actin filaments do not exhibit radial polarization at the apex. Our results demonstrate that C. elegans endodermal precursor cells apically constrict using a mixed-polarity actin filament network and with myosin and a myosin activator distributed throughout the network. Taken together with observations made in other organisms, our results demonstrate that diverse actomyosin architectures are used in animal cells to accomplish apical constriction.


Conflict of interest statement

Disclosures: The authors declare no competing interests exist.

Figures

Figure 1.
Figure 1.
Models of apical constriction. (A) Illustration of apical constriction resulting in tissue morphogenesis. (B) Three of the models of actomyosin architecture observed in apically constricting cells. Orange shading represents the regions of localized myosin-based force generation. (C) Maximum-intensity projections of 10 planes spanning 5 μm total Z-depth depicting C. elegans gastrulation from a ventral view with plasma membranes fluorescently labeled (mex-5p::mScarlet-I::PH). Ea and Ep are pseudocolored to visualize their internalization over time. L, R, A, and P indicate left, right, anterior, and posterior, respectively. Scale bar: 5 µm.
Figure 2.
Figure 2.
NMY-2 exhibits punctate localization distributed throughout the apical cortex during apical constriction. (A) Micrographs from a time-lapse movie depicting dynamic localization of mNG::NMY-2 over time from a ventral view. NMY-2 is covisualized with mScarlet-I::PH, which labels the plasma membrane. Yellow arrowheads point to Ea and Ep cells. (B) An enlarged micrograph from panel A to demonstrate how line scan (yellow line) measurements were collected. (C) Plots depicting fluorescence intensity of mNG::NMY-2, normalized to the mean intensity, along the left–right axis of Ea (n = 11 embryos). Solid lines indicate the mean, and shaded areas indicate the mean ± SD. Time represents minutes following the birth of the neighboring MSxx cells. Scale bars: 5 µm.
Figure S1.
Figure S1.
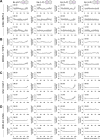
Quantification of protein localization during apical constriction. (A–D) Plots depicting normalized intensity of mNG::NMY-2 (A, n = 11 embryos), MRCK-1::YPET (B, n = 12 embryos), CAP-1::mScarlet-I (C, n = 10 embryos), and mNG::UNC-94 (D, n = 10 embryos) across the anterior–posterior (A-P) or left–right (L-R) axes of Ea and Ep. Time represents minutes following the birth of the MSxx cells. Solid lines indicate the mean and shaded areas indicate the mean ± SD.
Figure 3.
Figure 3.
MRCK-1 exhibits slight enrichment at cell–cell borders and not at the center of the apex. (A) Micrographs from a time-lapse movie depicting dynamic localization of MRCK-1::YPET over time from a ventral view. MRCK-1 is covisualized with mScarlet-I::PH, which labels the plasma membrane. Yellow arrowheads point to Ea and Ep. (B) Plots depicting normalized fluorescence intensity of MRCK-1::YPET along the left–right axis of Ea (n = 12 embryos). Solid lines indicate the mean and shaded areas indicate the mean ± SD. Time represents minutes following the birth of the neighboring MSxx cells. Scale bar: 5 µm.
Figure S2.
Figure S2.
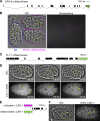
Barbed-end actin filament proteins. (A) Schematic of the endogenous eps-8 locus tagged with mNG at its C-terminus. The start codons of the various isoforms are indicated with gray arrows. (B) Differential interference contrast (DIC, left) and fluorescence (right) micrographs of N2 control (blue) and EPS-8::mNG embryos (magenta) from a lateral view. (C) Schematic of the endogenous fli-1 locus tagged with mNG at its C-terminus. (D) DIC (top) and fluorescence (bottom) micrographs from a time-lapse movie depicting localization of FLI-1::mNG over time from a ventral view. (E) Schematic of the endogenous cap-1 locus tagged with either mScarlet-I or mNG at its N-terminus. (F) DIC (left) and fluorescence (right) micrographs depicting localization of mNG::CAP-1 from a ventral view. Ea and Ep are indicated with yellow dotted lines or arrowheads. Time represents minutes following the birth of the MSxx cells. Scale bars: 5 µm.
Figure 4.
Figure 4.
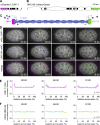
Localization of barbed- and pointed-end capping proteins CAP-1 and UNC-94. (A) Schematic of the endogenous cap-1 locus tagged with mScarlet-I at its N-terminus. (B) Schematic of the endogenous unc-94 locus tagged with mNeonGreenG at its C-terminus. (C) Cartoon of CAP-1 (magenta) and UNC-94 (green) performing their actin filament (blue) capping functions on the barbed (+) and pointed (−) ends, respectively. (D) Micrographs from a time-lapse movie depicting localization of mScarlet-I::CAP-1 and UNC-94::mNG over time from a ventral view. Yellow arrowheads point to Ea and Ep. (E and F) Plots depicting normalized fluorescence intensity of mScarlet-I::CAP-1 (E) and UNC-94::mNG (F) along the left–right axis of Ea (n = 10 embryos). Solid lines indicate the mean and shaded areas indicate the mean ± SD. Time represents minutes following the birth of the neighboring MSxx cells. Scale bar: 5 µm.
Figure S3.
Figure S3.
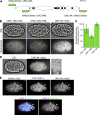
Comparison of mNG-tagged UNC-94 isoforms and covisualization with CAP-1 and actin filaments. (A) Schematic of the endogenous unc-94 locus fused to mNG at its C-terminus (tagging both isoforms) or at the N-termini of the isoforms encoding either UNC-94A or UNC-94B. (B) Micrographs depicting expression and localization of UNC-94A::mNG, UNC-94B::mNG, and UNC-94::mNG from a ventral view. (C) Bar plot depicting relative intensity measurements of whole embryos with the UNC-94A::mNG, UNC-94B::mNG, and UNC-94::mNG alleles (n ≥ 5 embryos). (D) Representative micrograph of UNC-94::mNG using imaging parameters optimized for static imaging. (E) Micrographs depicting localization of mex-5p::LifeAct::mScarlet-I, mTurquoise2::CAP-1, and UNC-94::mNG. Ea and Ep are indicated with yellow dotted lines or arrowheads. Error bars indicate SD. Scale bars: 5 µm.
Figure 5.
Figure 5.
Actomyosin architectures driving apical constriction in diverse biological contexts. Illustrations depicting actin filament polarization and localization of myosin and myosin-activating kinase in the Drosophila ventral furrow, C. elegans gastrulation, and other contexts of apical constriction in Xenopus, chick, and mouse (see Table S1 for additional details).

Update of

Similar articles

Cited by

References

    1. Baker, P.C., and Schroeder T.E.. 1967. Cytoplasmic filaments and morphogenetic movement in the amphibian neural tube. Dev. Biol. 15:432–450. 10.1016/0012-1606(67)90036-X - DOI - PubMed
    1. Baldwin, A.T., Popov I.K., Keller R., Wallingford J.B., and Chang C.. 2022. The RhoGEF protein Plekhg5 regulates medioapical actomyosin dynamics of apical constriction during Xenopus gastrulation. bioRxiv. (Preprint posted September 02, 2022). 10.1101/2022.08.31.506049 - DOI - PMC - PubMed
    1. Booth, A.J.R., Blanchard G.B., Adams R.J., and Röper K.. 2014. A dynamic microtubule cytoskeleton directs medial actomyosin function during tube formation. Dev. Cell. 29:562–576. 10.1016/j.devcel.2014.03.023 - DOI - PMC - PubMed
    1. Brenner, S. 1974. The genetics of Caenorhabditis elegans. Genetics. 77:71–94. 10.1093/genetics/77.1.71 - DOI - PMC - PubMed
    1. Burnside, B. 1973. Microtubules and microfilaments in amphibian neurulation. Am. Zool. 13:989–1006. 10.1093/icb/13.4.989 - DOI

Publication types