. 2023 Aug;66(8):1557-1575.
doi: 10.1007/s00125-023-05935-2. Epub 2023 Jun 23.

Disruption of cortical cell type composition and function underlies diabetes-associated cognitive decline

Affiliations

Disruption of cortical cell type composition and function underlies diabetes-associated cognitive decline

Karis Little et al. Diabetologia. 2023 Aug.

Abstract

Aims/hypothesis: Type 2 diabetes is associated with increased risk of cognitive decline although the pathogenic basis for this remains obscure. Deciphering diabetes-linked molecular mechanisms in cells of the cerebral cortex could uncover novel therapeutic targets.

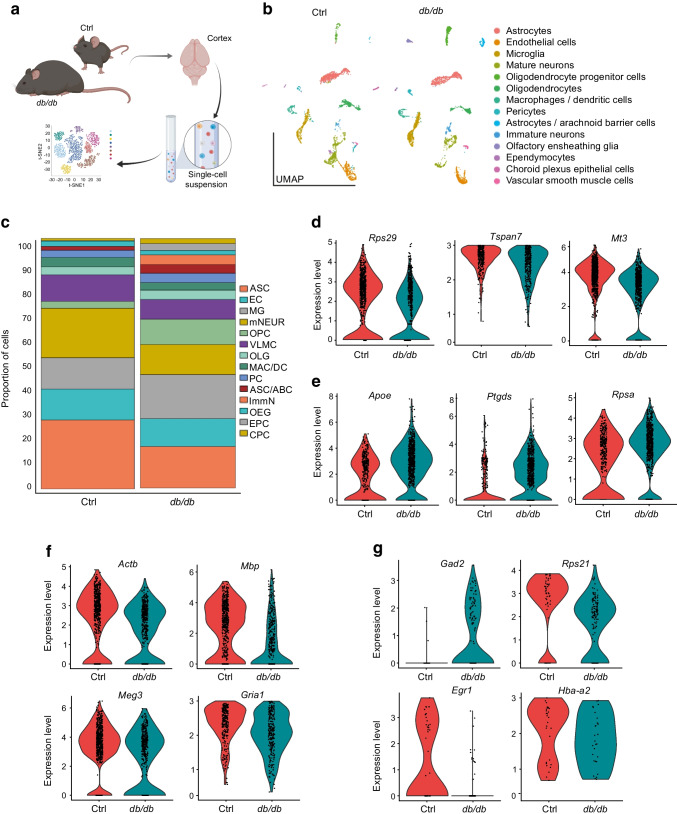
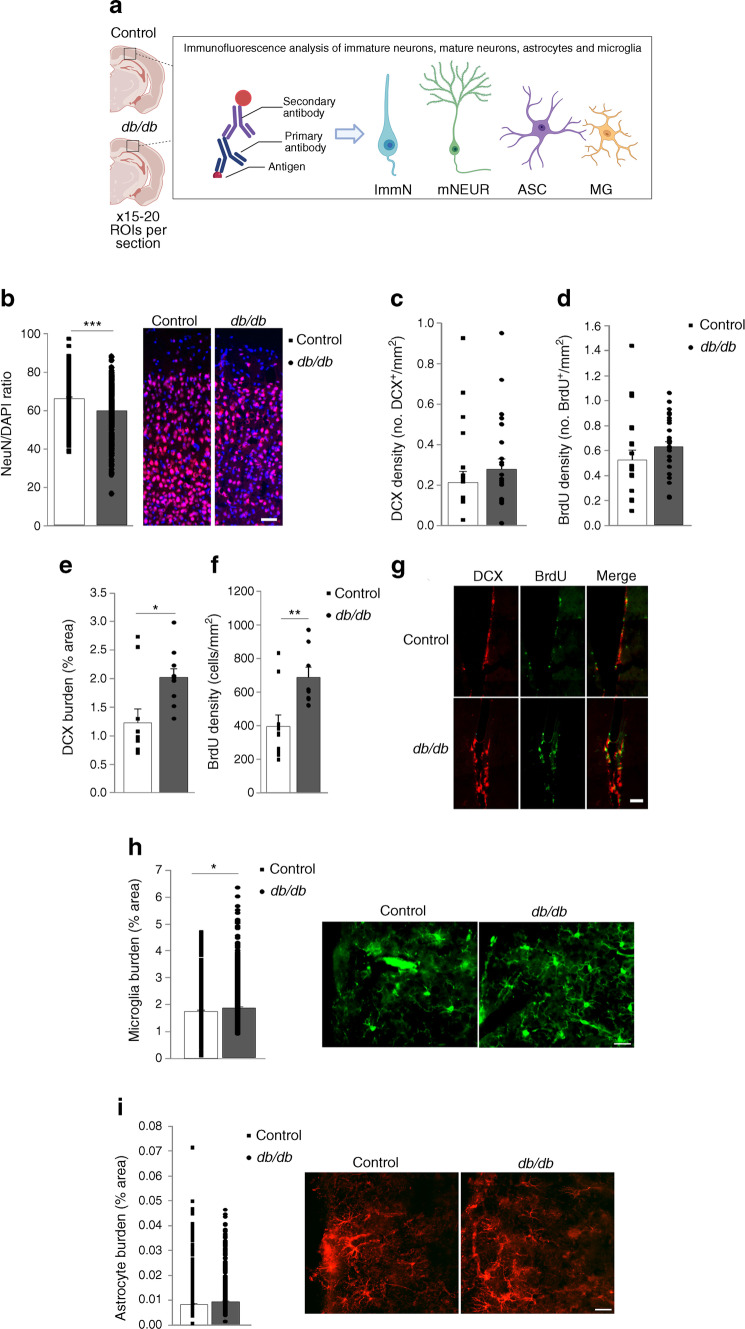
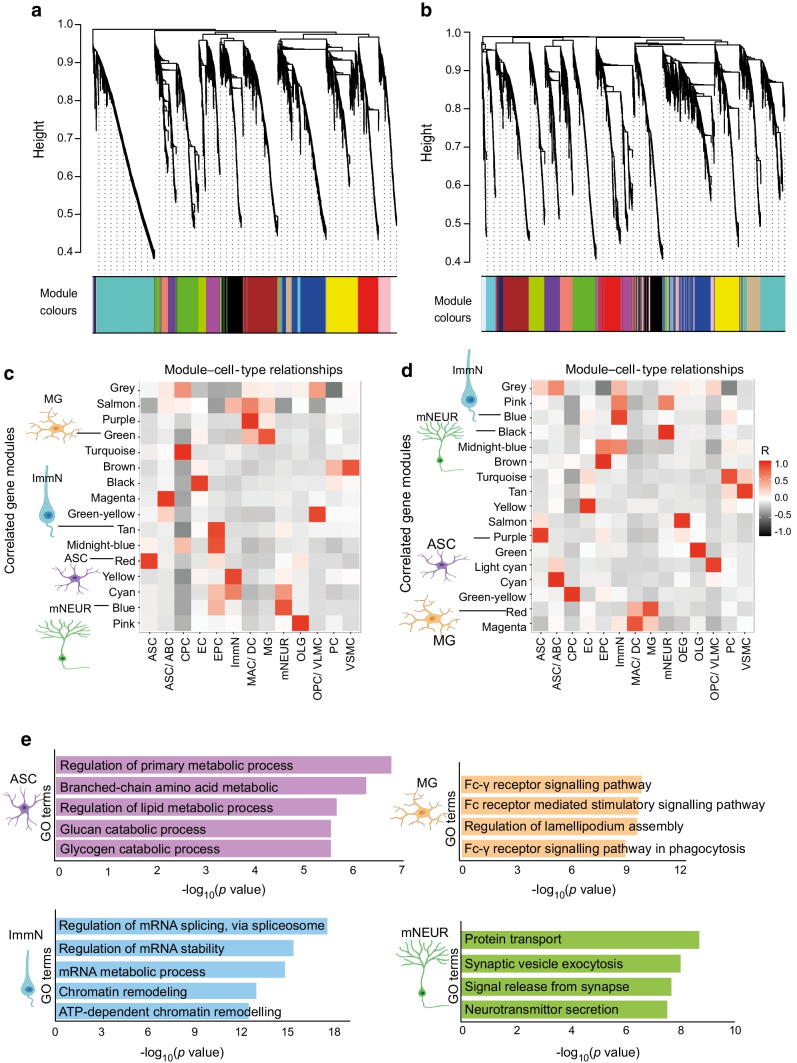
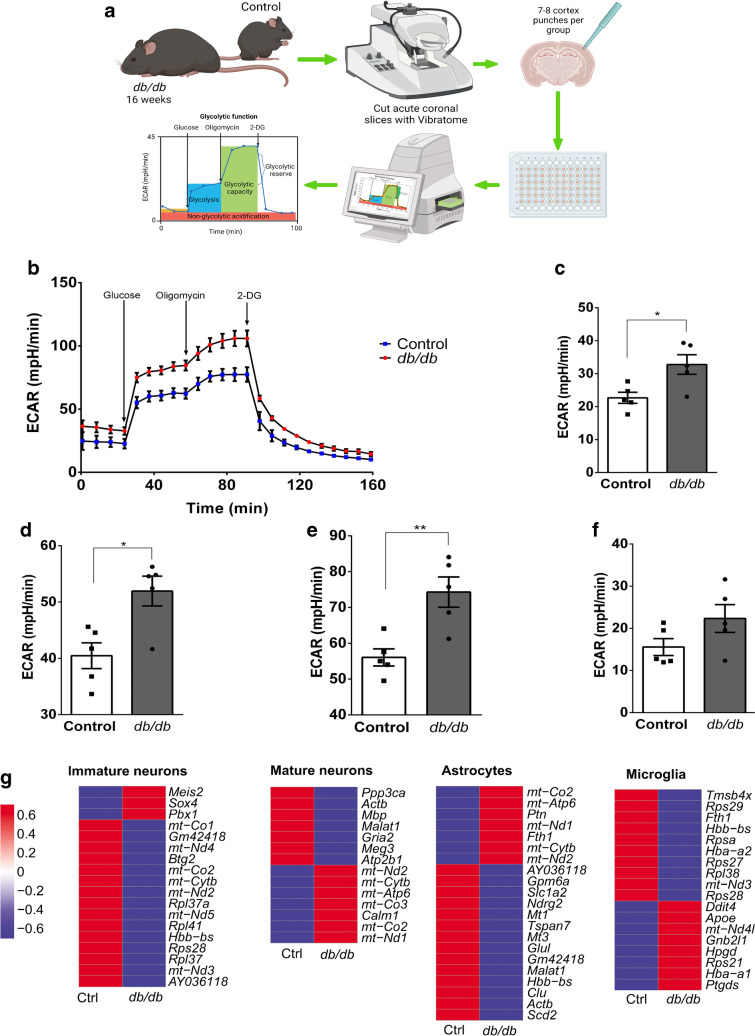
Methods: Single-cell transcriptomic sequencing (scRNA-seq) was conducted on the cerebral cortex in a mouse model of type 2 diabetes (db/db mice) and in non-diabetic control mice in order to identify gene expression changes in distinct cell subpopulations and alterations in cell type composition. Immunohistochemistry and metabolic assessment were used to validate the findings from scRNA-seq and to investigate whether these cell-specific dysfunctions impact the neurovascular unit (NVU). Furthermore, the behavioural and cognitive alterations related to these dysfunctions in db/db mice were assessed via Morris water maze and novel object discrimination tests. Finally, results were validated in post-mortem sections and protein isolates from individuals with type 2 diabetes.

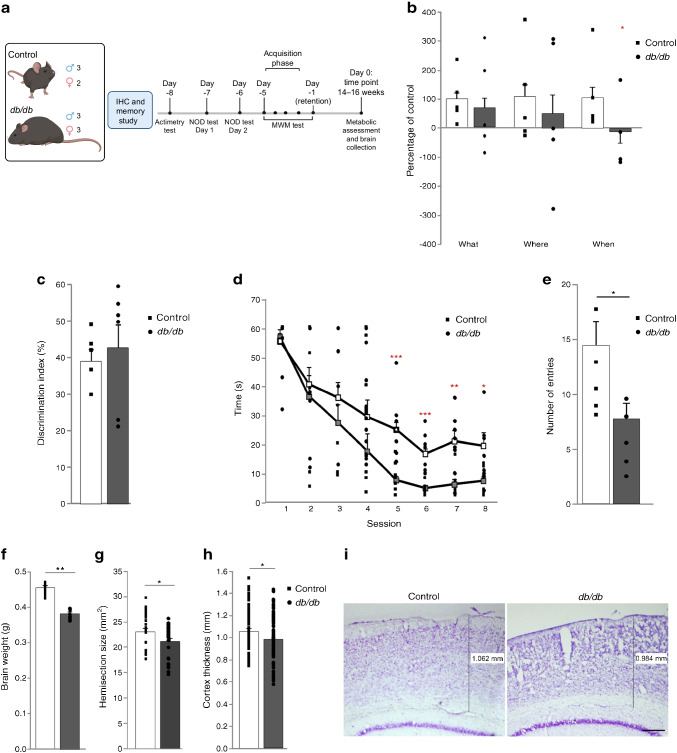
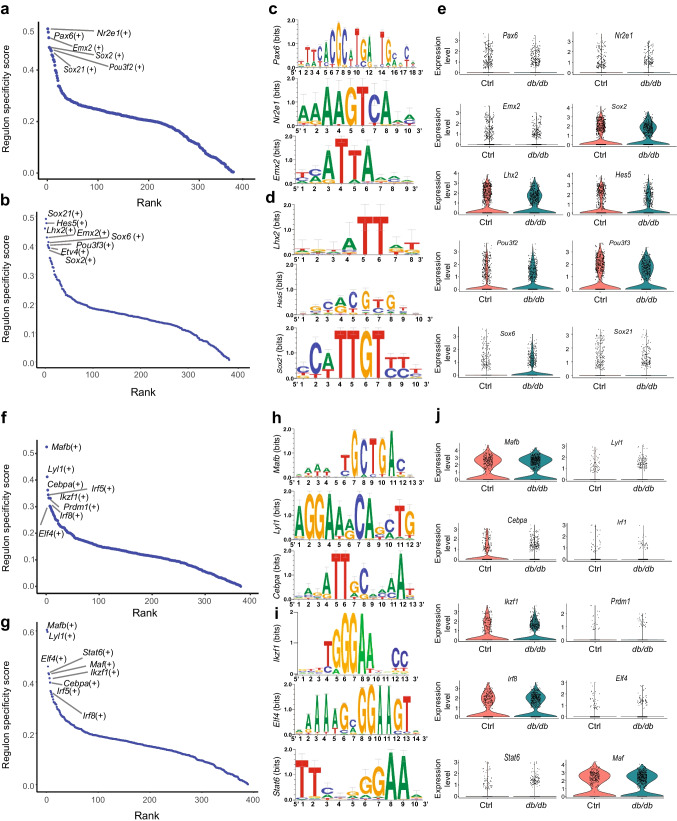
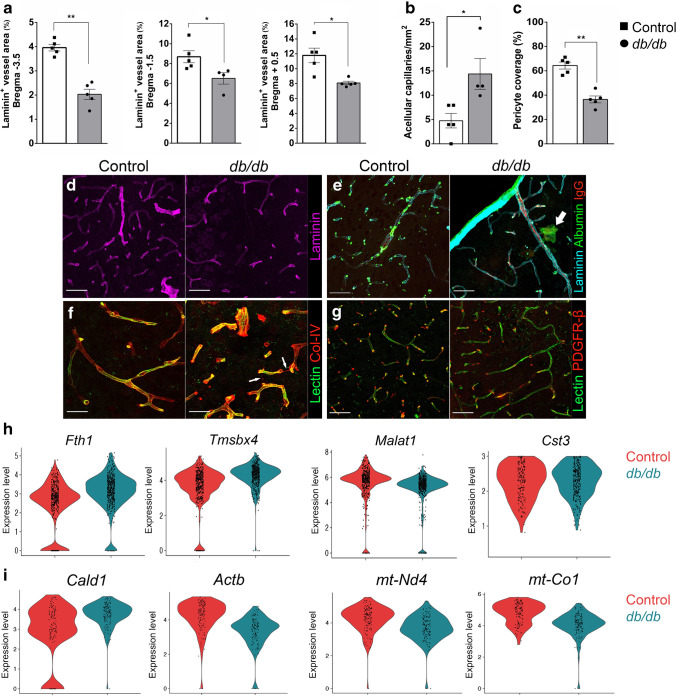
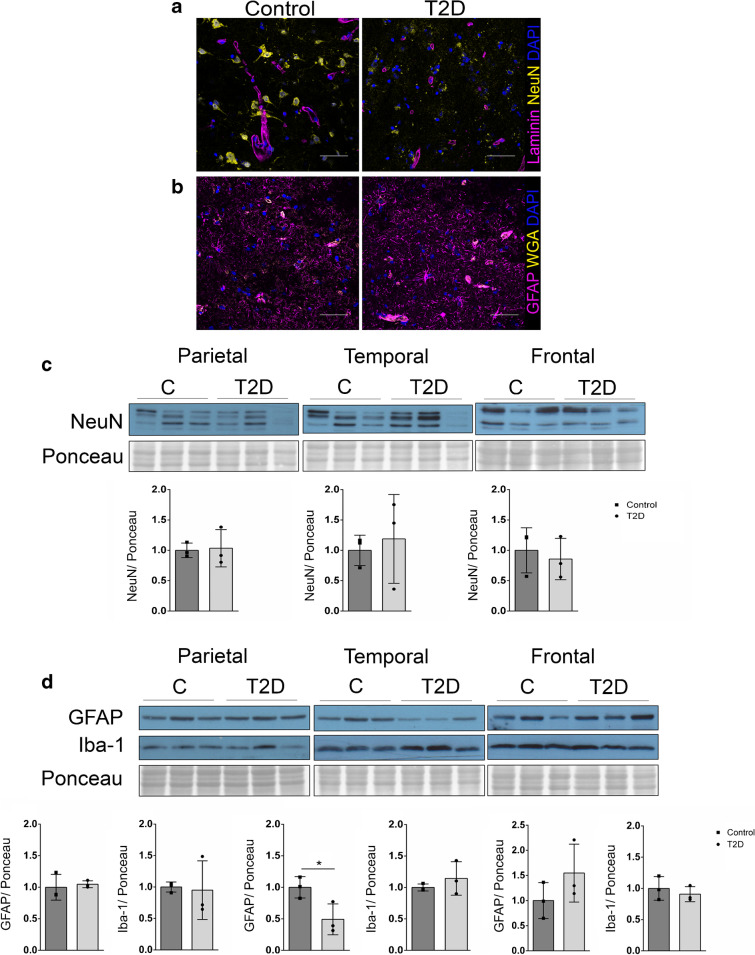
Results: Compared with non-diabetic control mice, the db/db mice demonstrated disrupted brain function as revealed by losses in episodic and spatial memory and this occurred concomitantly with dysfunctional NVU, neuronal circuitry and cerebral atrophy. scRNA-seq of db/db mouse cerebral cortex revealed cell population changes in neurons, glia and microglia linked to functional regulatory disruption including neuronal maturation and altered metabolism. These changes were validated through immunohistochemistry and protein expression analysis not just in the db/db mouse cerebral cortex but also in post-mortem sections and protein isolates from individuals with type 2 diabetes (74.3 ± 5.5 years) compared with non-diabetic control individuals (87.0 ± 8.5 years). Furthermore, metabolic and synaptic gene disruptions were evident in cortical NVU cell populations and associated with a decrease in vascular density.

Conclusions/interpretation: Taken together, our data reveal disruption in the cellular and molecular architecture of the cerebral cortex induced by diabetes, which can explain, at least in part, the basis for progressive cognitive decline in individuals with type 2 diabetes.

Data availability: The single-cell sequencing data that supports this study are available at GEO accession GSE217665 ( https://www.ncbi.nlm.nih.gov/geo/query/acc.cgi?acc=GSE217665 ).

Keywords: Cognitive decline; Cortex; Diabetes; Metabolism; Neuroscience; Neurovascular unit.


Figures

Fig. 1
Fig. 1
Cognitive impairment and brain atrophy in db/db mice. (a) Schematic detailing study design and time points. (b) The new object discrimination test showed that episodic memory was not affected in db/db mice when ‘what’ (p=0.441) or ‘where’ (p=0.484) paradigms were analysed. However, the ‘when’ paradigm was significantly impaired in db/db mice (*p=0.016). Data are representative of five mice. (c) Discrimination index was not affected in db/db mice (p=0.530). Data are representative of five or six mice. (d) Learning impairment was observed in db/db mice in the acquisition phase of the MWM. Times required to locate the platform were significantly longer in db/db mice than control mice in sessions 5–8 (session 1 p=0.729, session 2 p=0.637, session 3 p=0.294, session 4 p=0.168, session 5 ***p<0.001 vs control, session 6 ***p<0.001 vs control, session 7 **p=0.003 vs control, session 8 *p=0.025 vs control). Data are representative of five or six mice. White squares, mean value for db/db mice; grey squares, mean value for control mice. (e) The number of entries into quadrant 2 (where the platform was located along the acquisition phase) was significantly lower in db/db mice (*p<0.05). (f) Brain weight was reduced in db/db mice when compared with control mice (**p<0.001 vs control). (g) Hemisection size was significantly reduced in db/db mice (*p=0.039 vs control). (h) Cortical thickness was significantly reduced in db/db mice (*p=0.013 vs control). (i) Representative images showing reduced cortical thickness in db/db mice. Scale bar, 250 µm. Schematic in (a) was created with BioRender.com
Fig. 2
Fig. 2
Single-cell sequencing of diabetic mouse brain reveals changes in glial and neuronal populations. (a) Schematic of scRNA-seq data derivation. db/db and db/+ (control) mouse cortex was dissociated in papain when mice were 16 weeks old. The resulting single-cell solution was sequenced via 10× genomics and analysis was performed in R. (b) Clustering of the cortex showed similar cell populations in diabetic and control mouse brain. (c) Proportion of each cell type in db/db and db/+ mouse brain cortex, indicating the difference in astrocytes, microglia and neuronal populations. (dg) Significant differential expression of genes (all p<0.001) in astrocytes (d), microglia (e), mature neurons (f) and immature neurons (g). Expression levels for individual genes are presented as the normalised counts. Schematic in (a) was created with BioRender.com. ABC, arachnoid barrier cells; ASC, astrocytes; CPC, choroid plexus cells; Ctrl, control; DC, dendritic cells; EC, endothelial cells; EPC, ependymocytes; ImmN, immature neurons; MAC, macrophages; MG, microglia; mNEUR, mature neurons; OEG, olfactory ensheathing glia; OLG, oligodendrocytes; OPC, oligodendrocyte progenitor cells; PC, pericytes; VLMC, vascular leptomeningeal cells
Fig. 3
Fig. 3
Regulon analysis. (ad) Top regulons (a, b) and top unique motifs (c, d) in db/+ (a, c) and db/db (b, d) mouse astrocytes. (e) Differential expression patterns of top regulon genes in db/+ and db/db mouse astrocyte cell populations. (fj) Top regulons (f, g) and unique motifs (h, i) in db/+ (f, h) and db/db (g, i) mouse microglia. (j) Differential expression patterns of top regulon genes in db/+ and db/db mouse microglia cell populations. Expression levels for individual genes are presented as the normalised counts. Neuronal populations are shown in ESM Fig. 2
Fig. 4
Fig. 4
Neuron compromise and microglia burden are increased in db/db mice. (a) Schematic describing the staining process. Indirect staining with primary antibody and secondary fluorescently conjugated antibody was used to identify cell subtypes (immature neurons, mature neurons, astrocytes and microglia). (b) NeuN/DAPI ratio was significantly lower in the cortex from db/db mice, when compared with control mice (***p<0.001 vs control). Representative images of cortical sections from control and db/db mice, with NeuN (red) and DAPI (blue) staining, are shown. Scale bar, 50 µm. (c, d) No differences were observed when DCX (p=0.407) (c) or BrdU (p=0.267) (d) densities were compared in the cortex from db/db and control mice. (e, f) DCX burden (e) was significantly increased in the SVZ from db/db when compared with control mice (*p=0.012 vs control). Similarly, BrdU density (f) was significantly higher in the SVZ from db/db mice (**p=0.004 vs control). (g) Representative images of the SVZ from control and db/db mice (green, BrdU+; red, DCX+). Scale bar, 50 μm. (h) Microglia burden was increased in db/db mice when compared with control mice (*p=0.046). Representative images of microglia staining in the cortex from control and db/db mice (green, Iba-1) are shown. Scale bar, 25 μm. (i) Astrocyte burden was not affected in db/db mice when compared with control mice (p=0.142). Representative images of astrocyte staining in the cortex from control and db/db mice (red, GFAP) are shown. Scale bar, 25 μm. Schematic in (a) was created with BioRender.com. ASC, astrocytes; ImmN, immature neurons; MG, microglia; mNEUR, mature neurons
Fig. 5
Fig. 5
WGCN analysis and GO terms for correlated modules. (a, b) Cluster dendrogram for gene modules showing modules of high interconnection in control (a) and db/db (b) mice. Height in cluster dendrograms indicates the inter-cluster correlation distance and modules are marked by different colours in the horizontal bar (grey represents unassigned genes). (c, d) The relationship between gene sets and cell types is shown for control (c) and db/db (d). Each column is a cell type and each row represents module eigengenes. Each unit is coloured in the correlation coefficient (R) on a scale of −1 to +1 (black, negative; red, positive; white, null). (e) Unique GO terms for correlated gene module in db/db mouse cell types. Cell images were created with BioRender.com. ABC, arachnoid barrier cells; ASC, astrocytes; CPC, choroid plexus cells; DC, dendritic cells; EC, endothelial cells; EPC, ependymocytes; ImmN, immature neurons; MAC, macrophages; MG, microglia; mNeur, mature neurons; OLG, oligodendrocytes; OPC, oligodendrocyte progenitor cells; PC, pericytes; VLMC, vascular leptomeningeal cells; VSMC, vascular smooth muscle cells
Fig. 6
Fig. 6
Vascular alterations in db/db mouse cortex. (a) Laminin+ vessel area was significantly reduced at various levels of Bregma in the cortex of db/db mice (*p<0.05, **p<0.01). (b) A significant increase in acellular capillaries was observed in db/db mouse cortex (*p<0.05) at Bregma level +0.5 mm. (c) A significant loss of pericyte coverage (PDGFR-β) was observed in db/db mouse cortex at Bregma +0.5 mm (**p<0.01). (dg) Representative images: laminin staining (purple) (d); ‘hot-spot’ (arrow) area of vessel leakage in db/db mouse cortex (blue, laminin; red, IgG; green, albumin) (e); lectin (green) and Col-IV (red) in control and db/db mouse cortex for assessment of acellular capillaries (arrows) (f); and lectin (green) and PDGFR-β (red) in the control and db/db mouse cortex for measurement of pericyte coverage (g). Scale bar, 50 µm. (h) DEGs in endothelial cells. (i) DEGs in pericytes. Expression levels for individual genes (all p<0.001) are presented as the normalised counts
Fig. 7
Fig. 7
Metabolic profiling of db/db mouse cortex. (a) Schematic describing the process of obtaining acute coronal sections for metabolic profiling by Seahorse X FE 96. Male db/db or control mice aged 16 weeks (n=5 mice per group) were used to generate acute coronal slices (250 µm) using the Leica VT100s Vibratome. The Seahorse analyser was used to assess glycolytic function, via an adapted glycolytic stress test protocol. (b) Traces from n=5 db/db and n=5 control mice (representative of seven or eight punches per mouse) following the adapted glycolysis stress test protocol. (c) Non-glycolytic acidification was significantly increased in db/db mice. (d) Basal glycolysis was significantly increased in db/db mice. (e) Glycolytic capacity was significantly increased in db/db mice. (f) No significant changes were observed between db/db and control mice when comparing glycolytic reserve. n=5 mice per group; seven or eight cortical punches per mouse. *p<0.05, **p<0.01. Unpaired Student’s t test. Data are presented as mean values ± SEM. (g) Metabolism-related DEGs (all p<0.001) in db/+ (control) and db/db mouse cortex. Heatmap depicts normalised expression counts scaled between +1 and −1. Schematic in (a) was created with BioRender.com. ECAR, extracellular acidification rate
Fig. 8
Fig. 8
Cortex samples from individuals with type 2 diabetes reveal alterations in neuronal and glial cell populations. (a) Representative images show reduced NeuN staining (yellow) in frontal cortex from a donor with type 2 diabetes compared with cortex from a control donor. Laminin staining is shown in purple, alongside DAPI in blue, n=4 or 5 individuals per group. (b) Representative images showing GFAP staining of the frontal cortex (purple) alongside wheat germ agglutinin (yellow), n=4 or 5 patients per group. (c) Western blotting of human cortex samples (parietal, temporal and frontal) shows the expression of NeuN in each location, n=3 individuals per group. (d) Western blotting of human cortex samples (parietal, temporal and frontal) shows the expression of GFAP and Iba-1 in each location. GFAP expression was reduced in the temporal cortex (*p<0.05 vs control samples), n=3 individuals per group. Western blot quantification was analysed by normalising the protein levels to the Ponceau stain. C, control; T2D, type 2 diabetes; WGA, wheat germ agglutinin

References

    1. Karuranga S, da Rocha Fernandes J, Huang Y, Malanda B. IDF diabetes atlas eighth edition 2017. Brussels: International Diabetes Federation; 2017.
    1. Koekkoek PS, Janssen J, Kooistra M, et al. Case-finding for cognitive impairment among people with type 2 diabetes in primary care using the Test Your Memory and Self-Administered Gerocognitive Examination questionnaires: the Cog-ID study. Diabet Med. 2016;33(6):812–819. doi: 10.1111/dme.12874. - DOI - PubMed
    1. Biessels GJ, Staekenborg S, Brunner E, Brayne C, Scheltens P. Risk of dementia in diabetes mellitus: a systematic review. Lancet Neurol. 2006;5(1):64–74. doi: 10.1016/S1474-4422(05)70284-2. - DOI - PubMed
    1. Little K, Llorián-Salvador M, Scullion S, et al. Common pathways in dementia and diabetic retinopathy: understanding the mechanisms of diabetes-related cognitive decline. Trends Endocrinol Metab. 2022;33(1):50–71. doi: 10.1016/j.tem.2021.10.008. - DOI - PubMed
    1. Ma T, Li Z-Y, Yu Y, et al. Gray and white matter abnormality in patients with T2DM-related cognitive dysfunction: a systemic review and meta-analysis. Nutr Diabetes. 2022;12(1):39. doi: 10.1038/s41387-022-00214-2. - DOI - PMC - PubMed

Publication types