Machine learning model for predicting age in healthy individuals using age-related gut microbes and urine metabolites
- PMID: 37351626
- PMCID: PMC10291941
- DOI: 10.1080/19490976.2023.2226915
Machine learning model for predicting age in healthy individuals using age-related gut microbes and urine metabolites
Abstract
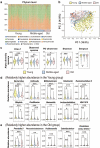
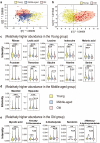
Age-related gut microbes and urine metabolites were investigated in 568 healthy individuals using metataxonomics and metabolomics. The richness and evenness of the fecal microbiota significantly increased with age, and the abundance of 16 genera differed between the young and old groups. Additionally, 17 urine metabolites contributed to the differences between the young and old groups. Among the microbes that differed by age, Bacteroides and Prevotella 9 were confirmed to be correlated with some urine metabolites. The machine learning algorithm eXtreme gradient boosting (XGBoost) was shown to produce the best performing age predictors, with a mean absolute error of 5.48 years. The accuracy of the model improved to 4.93 years with the inclusion of urine metabolite data. This study shows that the gut microbiota and urine metabolic profiles can be used to predict the age of healthy individuals with relatively good accuracy.
Keywords: Age; prediction; urine; fecal; metabolomics; metataxonomics.
Conflict of interest statement
No potential conflict of interest was reported by the author(s).
Figures


Similar articles
-
Pivotal interplays between fecal metabolome and gut microbiome reveal functional signatures in cerebral ischemic stroke.J Transl Med. 2022 Oct 8;20(1):459. doi: 10.1186/s12967-022-03669-0. J Transl Med. 2022. PMID: 36209079 Free PMC article.
-
Fecal and serum metabolomic signatures and gut microbiota characteristics of allergic rhinitis mice model.Front Cell Infect Microbiol. 2023 Apr 25;13:1150043. doi: 10.3389/fcimb.2023.1150043. eCollection 2023. Front Cell Infect Microbiol. 2023. PMID: 37180443 Free PMC article.
-
Interpretation of the effects of rumen acidosis on the gut microbiota and serum metabolites in calves based on 16S rDNA sequencing and non-target metabolomics.Front Cell Infect Microbiol. 2024 Jun 28;14:1427763. doi: 10.3389/fcimb.2024.1427763. eCollection 2024. Front Cell Infect Microbiol. 2024. PMID: 39006744 Free PMC article.
-
Gut microbiome combined with metabolomics reveals biomarkers and pathways in central precocious puberty.J Transl Med. 2023 May 11;21(1):316. doi: 10.1186/s12967-023-04169-5. J Transl Med. 2023. PMID: 37170084 Free PMC article.
-
Fecal 16S rRNA sequencing and multi-compartment metabolomics revealed gut microbiota and metabolites interactions in APP/PS1 mice.Comput Biol Med. 2022 Dec;151(Pt A):106312. doi: 10.1016/j.compbiomed.2022.106312. Epub 2022 Nov 17. Comput Biol Med. 2022. PMID: 36417828
Cited by
-
Identification of a 10-species microbial signature of inflammatory bowel disease by machine learning and external validation.Cell Regen. 2025 Jul 14;14(1):32. doi: 10.1186/s13619-025-00246-w. Cell Regen. 2025. PMID: 40658318 Free PMC article.
-
Study protocol for a prospective, investigator-initiated clinical trial on the vascular effects of acupuncture in the abdomen and lower limbs for patients with diarrhea-predominant irritable bowel syndrome.Int J Colorectal Dis. 2025 Apr 25;40(1):103. doi: 10.1007/s00384-025-04868-z. Int J Colorectal Dis. 2025. PMID: 40274656 Free PMC article.
-
Age-correlated changes in the canine oral microbiome.Front Microbiol. 2024 Jul 16;15:1426691. doi: 10.3389/fmicb.2024.1426691. eCollection 2024. Front Microbiol. 2024. PMID: 39081893 Free PMC article.
-
Age over sex: evaluating gut microbiota differences in healthy Chinese populations.Front Microbiol. 2024 Jun 21;15:1412991. doi: 10.3389/fmicb.2024.1412991. eCollection 2024. Front Microbiol. 2024. PMID: 38974029 Free PMC article.
-
Quantifying uncertainty in microbiome-based prediction using Gaussian processes with microbial community dissimilarities.Bioinform Adv. 2025 Mar 11;5(1):vbaf045. doi: 10.1093/bioadv/vbaf045. eCollection 2025. Bioinform Adv. 2025. PMID: 40110560 Free PMC article.
References
Publication types
MeSH terms
Substances
LinkOut - more resources
Full Text Sources
