

TOM40 regulates the progression of nasopharyngeal carcinoma through ROS-mediated AKT/mTOR and p53 signaling
- PMID: 37351718
- PMCID: PMC10290019
- DOI: 10.1007/s12672-023-00721-3
TOM40 regulates the progression of nasopharyngeal carcinoma through ROS-mediated AKT/mTOR and p53 signaling
Abstract
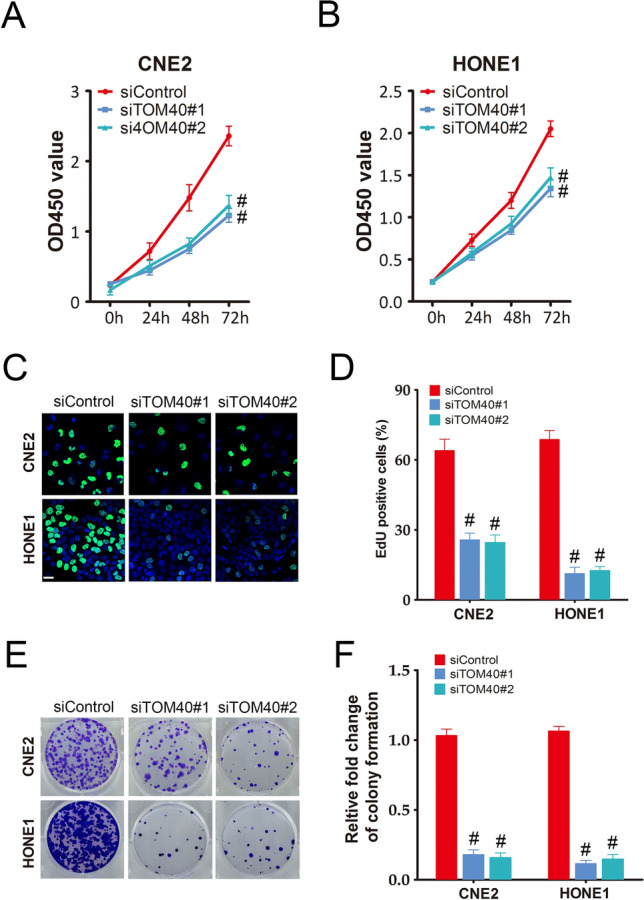
Nasopharyngeal carcinoma (NPC) is a prevalent cancer in Southern China, North Africa, and Southeast Asia. The translocase of the outer membrane (TOM) 40 is a transporter of mitochondrial proteins, and is involved in ovarian cancer cell growth. However, its role in the progression of NPC is still unclear. We found that TOM40 levels were upregulated in NPC tissues and multiple NPC cell lines. In addition, high TOM40 expression in the tumor tissues was associated with poor overall survival and disease specific survival. TOM40 knockdown in the NPC cell lines inhibited their proliferation in vitro and in vivo. Furthermore, TOM40 silencing also increased intracellular production of reactive oxygen species (ROS) and decreased mitochondrial membrane potential (MMP). Mechanistically, the anti-tumor effects of TOM40 silencing were dependent on the inhibition of AKT/mTOR signaling and activation of p53 signaling. To summarize, TOM40 mediates NPC progression through ROS-mediated AKT/mTOR and p53 signaling. Our findings highlight the potential of TOM40 as a therapeutic target for NPC.
Keywords: AKT; Nasopharyngeal carcinoma; ROS; TOM40; p53.
© 2023. The Author(s).
Conflict of interest statement
The authors have no relevant financial or non-financial interests to disclose.
Figures


Similar articles
-
Identification of galactosamine-(N-acetyl)-6-sulfatase (GALNS) as a novel therapeutic target in progression of nasopharyngeal carcinoma.Discov Oncol. 2023 Sep 14;14(1):171. doi: 10.1007/s12672-023-00782-4. Discov Oncol. 2023. PMID: 37707658 Free PMC article.
-
Targeting nasopharyngeal carcinoma by artesunate through inhibiting Akt/mTOR and inducing oxidative stress.Fundam Clin Pharmacol. 2017 Jun;31(3):301-310. doi: 10.1111/fcp.12266. Epub 2017 Feb 22. Fundam Clin Pharmacol. 2017. PMID: 28078787
-
Mitochondrial protein import regulates cytosolic protein homeostasis and neuronal integrity.Autophagy. 2018;14(8):1293-1309. doi: 10.1080/15548627.2018.1474991. Epub 2018 Jul 21. Autophagy. 2018. PMID: 29909722 Free PMC article.
-
TOM40 Inhibits Ovarian Cancer Cell Growth by Modulating Mitochondrial Function Including Intracellular ATP and ROS Levels.Cancers (Basel). 2020 May 22;12(5):1329. doi: 10.3390/cancers12051329. Cancers (Basel). 2020. PMID: 32456076 Free PMC article.
-
Small biomarkers with massive impacts: PI3K/AKT/mTOR signalling and microRNA crosstalk regulate nasopharyngeal carcinoma.Biomark Res. 2022 Jul 26;10(1):52. doi: 10.1186/s40364-022-00397-x. Biomark Res. 2022. PMID: 35883139 Free PMC article. Review.
Cited by
-
Network pharmacology and biological verification of morusin's therapeutic mechanisms in inhibiting nasopharyngeal carcinoma growth.J Cancer. 2024 Jul 16;15(15):4866-4878. doi: 10.7150/jca.97044. eCollection 2024. J Cancer. 2024. PMID: 39132159 Free PMC article.
-
Induction of interleukin-6 by SPZ1-mediated Wnt5a signaling boosts progression of nasopharyngeal carcinoma cells.J Cancer. 2024 Oct 7;15(18):6148-6159. doi: 10.7150/jca.99648. eCollection 2024. J Cancer. 2024. PMID: 39440046 Free PMC article.
-
Intra-tumoral bacteria in head and neck cancer: holistic integrative insight.Cancer Biol Med. 2025 Feb 19;22(2):113-36. doi: 10.20892/j.issn.2095-3941.2024.0311. Cancer Biol Med. 2025. PMID: 39969204 Free PMC article. Review.
-
TOM40 as a prognostic oncogene for oral squamous cell carcinoma prognosis.BMC Cancer. 2025 Jan 15;25(1):92. doi: 10.1186/s12885-024-13417-w. BMC Cancer. 2025. PMID: 39815211 Free PMC article.
-
Matrix stiffness regulates NPC invasiveness by modulating a mechanoresponsive TRPV4-Nox4-IL-8 signaling axis.J Cancer. 2025 Jan 13;16(4):1324-1334. doi: 10.7150/jca.104235. eCollection 2025. J Cancer. 2025. PMID: 39895789 Free PMC article.
References
Grants and funding
LinkOut - more resources
Full Text Sources
Research Materials
Miscellaneous