. 2023 Oct 10;7(19):5925-5936.
doi: 10.1182/bloodadvances.2022009652.

Comparing the value of mono- vs coculture for high-throughput compound screening in hematological malignancies

Affiliations

Comparing the value of mono- vs coculture for high-throughput compound screening in hematological malignancies

Sophie A Herbst et al. Blood Adv. .

Abstract

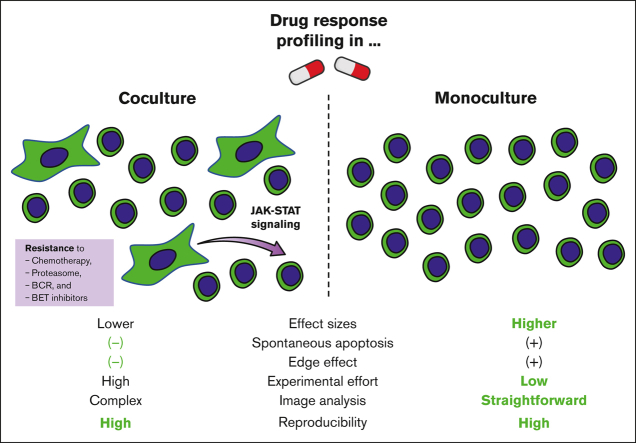
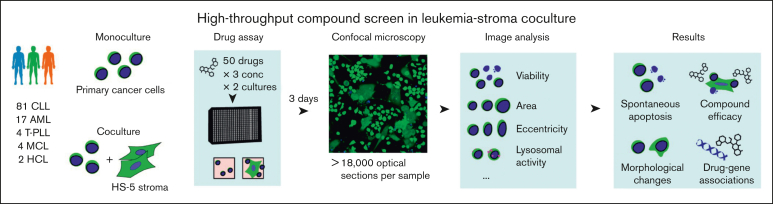
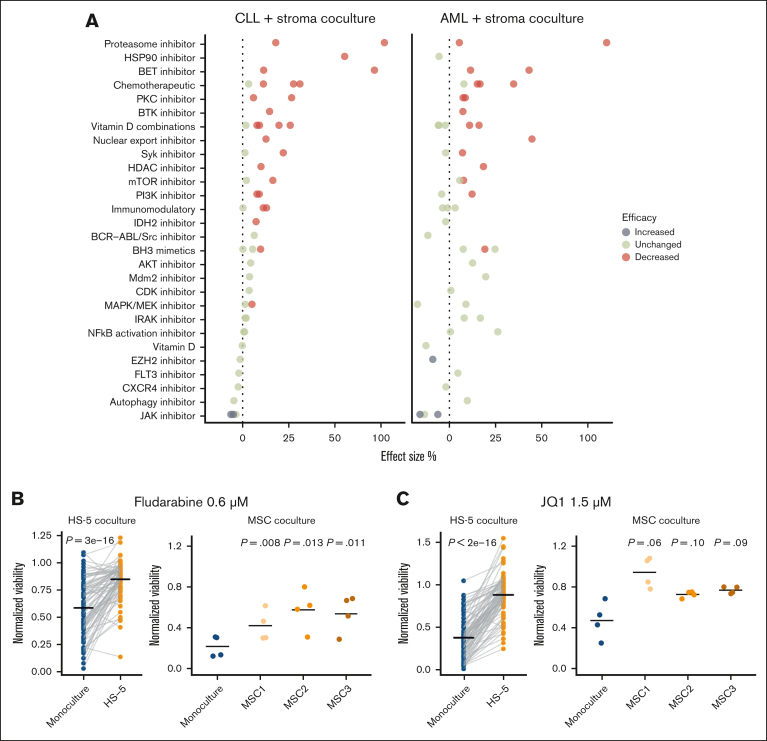
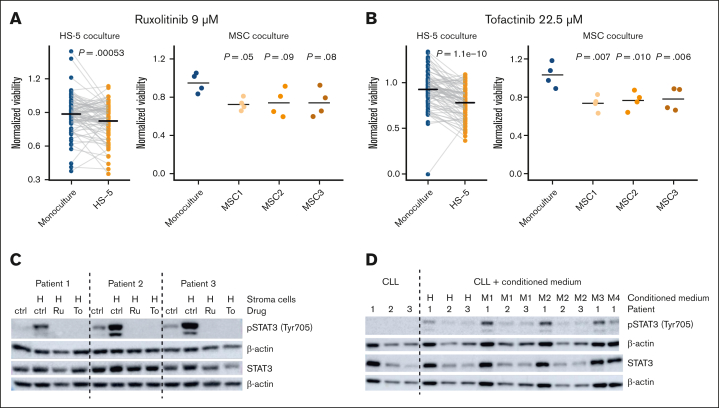
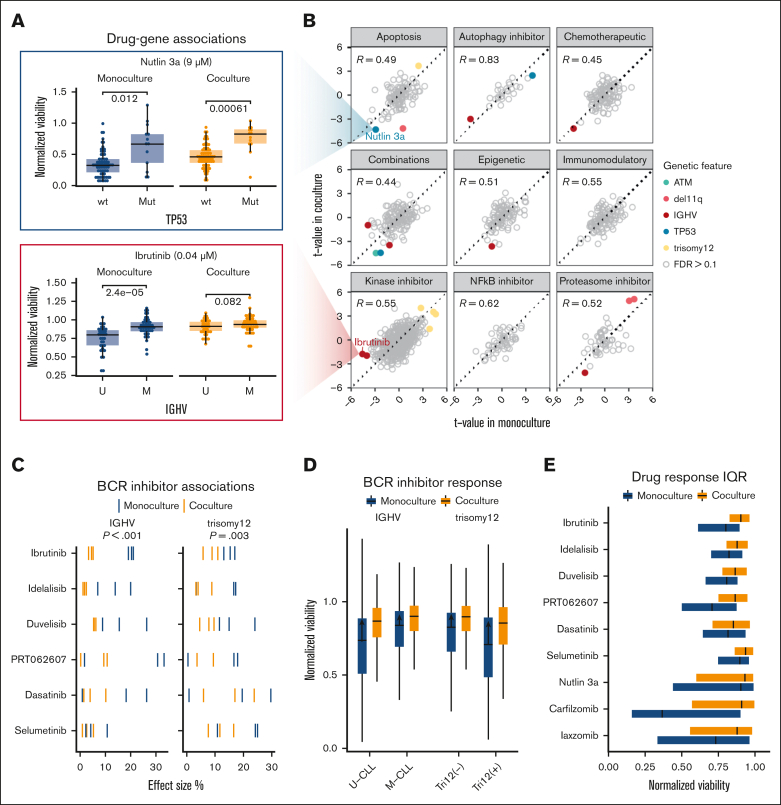
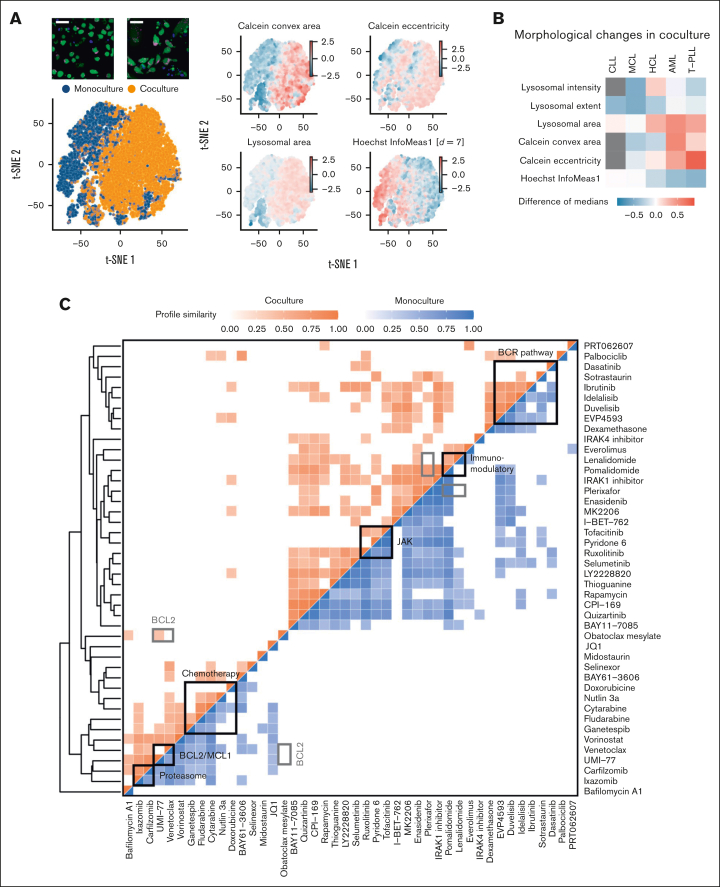
Large-scale compound screens are a powerful model system for understanding variability of treatment response and discovering druggable tumor vulnerabilities of hematological malignancies. However, as mostly performed in a monoculture of tumor cells, these assays disregard modulatory effects of the in vivo microenvironment. It is an open question whether and to what extent coculture with bone marrow stromal cells could improve the biological relevance of drug testing assays over monoculture. Here, we established a high-throughput platform to measure ex vivo sensitivity of 108 primary blood cancer samples to 50 drugs in monoculture and coculture with bone marrow stromal cells. Stromal coculture conferred resistance to 52% of compounds in chronic lymphocytic leukemia (CLL) and 36% of compounds in acute myeloid leukemia (AML), including chemotherapeutics, B-cell receptor inhibitors, proteasome inhibitors, and Bromodomain and extraterminal domain inhibitors. Only the JAK inhibitors ruxolitinib and tofacitinib exhibited increased efficacy in AML and CLL stromal coculture. We further confirmed the importance of JAK-STAT signaling for stroma-mediated resistance by showing that stromal cells induce phosphorylation of STAT3 in CLL cells. We genetically characterized the 108 cancer samples and found that drug-gene associations strongly correlated between monoculture and coculture. However, effect sizes were lower in coculture, with more drug-gene associations detected in monoculture than in coculture. Our results justify a 2-step strategy for drug perturbation testing, with large-scale screening performed in monoculture, followed by focused evaluation of potential stroma-mediated resistances in coculture.


Conflict of interest statement

Conflict-of-interest disclosure: The authors declare no competing financial interests.

Figures

None
Graphical abstract
Figure 1.
Figure 1.
Imaging-based coculture screen in primary leukemias and lymphomas. Study outline. A total of 50 compounds were probed in 108 primary leukemia and lymphoma samples. Confocal microscopy images of leukemia cells alone (in monoculture) and in coculture with the HS-5 stromal cell line were acquired to compute viability and morphological properties.
Figure 2.
Figure 2.
Stroma-mediated modulation of compound efficacy. (A) Shown is the percental drug response change in coculture relative to monoculture (alias effect size) summarized by drug class (refer to “Materials and methods”). An effect size of 100% equals a doubling of the normalized viability in coculture vs monoculture. A t test was further used to compare normalized viabilities in coculture vs monoculture. Only differences with a false discovery rate ≤0.01 are highlighted as indicated. A total number of 81 or 17 samples are shown for CLL or AML, respectively. (B-C) Validating the effect of fludarabine 0.6 μM (B) and JQ-1 1.5 μM (C) from the HS-5 coculture screen (n = 81) in cocultures of CLL with primary MSCs (n = 3). t tests were used to compare the coculture mean with the reference value in monoculture. MSC1, MSC2, and MSC3 were derived from (n = 3) different healthy donors.
Figure 3.
Figure 3.
Stroma-leukemia coculture increases toxicity mediated by JAK inhibitors. (A-B) Validating the effects of ruxolitinib (A) tofacitinib (B) from the HS-5 coculture screen (n = 81) in cocultures of CLL with primary MSCs (n = 3). t tests were used to compare the coculture mean with the reference value in monoculture. MSC1, MSC2, and MSC3 were derived from n = 3 different healthy donors. (C) STAT3 was phosphorylated in CLL cells from (n = 3) patient samples cocultured with HS-5 cells. STAT3 phosphorylation could be reversed by inhibition with ruxolitinib or tofacitinib. (D) STAT3 was phosphorylated in CLL cells from (n = 3) patient samples in the presence of conditioned medium derived from stromal cells. Ctrl, solvent control (DMSO); H, cocultures with HS-5 cells; M1-4, cocultures with MSC cells from (n = 4) different healthy donors; Ru, ruxolitinib (10 μM); To, tofacitinib (22.5 μM).
Figure 4.
Figure 4.
Drug-gene associations in coculture. (A) Boxplots showing response to nutlin 3a and ibrutinib stratified by culture condition and mutational status. (B) Comparison of drug-gene association statistics in monoculture and coculture. The x- and y-axes show the t statistic values of drug-gene associations in monoculture and coculture at a given concentration. (C) Effect size of IGHV and trisomy12 associations with BCR inhibitor response. The tick marks, colored by culture condition, show the absolute value of the effect size at 3 probed drug concentrations. Effect sizes of monoculture and coculture were compared using a 1-sided t test across all drugs shown. (D) The boxplots, colored by culture condition, show BCR inhibitor response stratified by IGHV mutational status [unmutated-CLL (U-CLL)/mutated-CLL(M-CLL)] and trisomy12 (negative/positive). The arrows indicate differences between monoculture and coculture medians, that is, viability gain in coculture. Monoculture and coculture were compared using a 1-sided t test. P values of all 4 groups were <1 × 10−10. (E) Drug response variability in CLL samples treated with BCR inhibitors, nutlin 3a, and proteasome inhibitors stratified by culture condition. The boxplots compare the interquartile ranges of drug sensitivities in monoculture and coculture.
Figure 5.
Figure 5.
Compound similarity in monoculture and coculture. (A) Joint t-SNE embedding of viable leukemia cells in monoculture and coculture controls of an AML sample. Coloring by morphological features revealed that AML cells in coculture had more elongated shapes (higher eccentricity), larger cell (Calcein), and lysosomal area as well as lower local correlation between pixel intensity values in x- and y-direction (Hoechst InfoMeas1). (B) Heatmap showing morphological changes in coculture controls across all screened disease entities. Gray indicates missing values. (C) Aggregated compound profiles were used to generate a hierarchical clustering of all probed compounds, excluding combinations. Pearson correlation was applied to compare drugs among each other separately in monoculture and coculture. Only high correlations (r > 0.4) are indicated in the heatmap. All shown correlations have P values < .001. Refer to “Materials and methods” for details.

Similar articles

Cited by

References

    1. Barretina J, Caponigro G, Stransky N, et al. The Cancer Cell Line Encyclopedia enables predictive modelling of anticancer drug sensitivity. Nature. 2012;483(7391):603–607. - PMC - PubMed
    1. Garnett MJ, Edelman EJ, Heidorn SJ, et al. Systematic identification of genomic markers of drug sensitivity in cancer cells. Nature. 2012;483(7391):570–575. - PMC - PubMed
    1. Dietrich S, Oleś M, Lu J, et al. Drug-perturbation-based stratification of blood cancer. J Clin Invest. 2018;128(1):427–445. - PMC - PubMed
    1. Lu J, Cannizzaro E, Meier-Abt F, et al. Multi-omics reveals clinically relevant proliferative drive associated with mTOR-MYC-OXPHOS activity in chronic lymphocytic leukemia. Nat Cancer. 2021;2(8):853–864. - PMC - PubMed
    1. Iorio F, Knijnenburg TA, Vis DJ, et al. A landscape of pharmacogenomic interactions in cancer. Cell. 2016;166(3):740–754. - PMC - PubMed

Publication types

MeSH terms