. 2023 Jun 23;9(25):eadh1281.
doi: 10.1126/sciadv.adh1281. Epub 2023 Jun 23.

Unique amphipathic α helix drives membrane insertion and enzymatic activity of ATG3

Affiliations

Unique amphipathic α helix drives membrane insertion and enzymatic activity of ATG3

Taki Nishimura et al. Sci Adv. .

Abstract

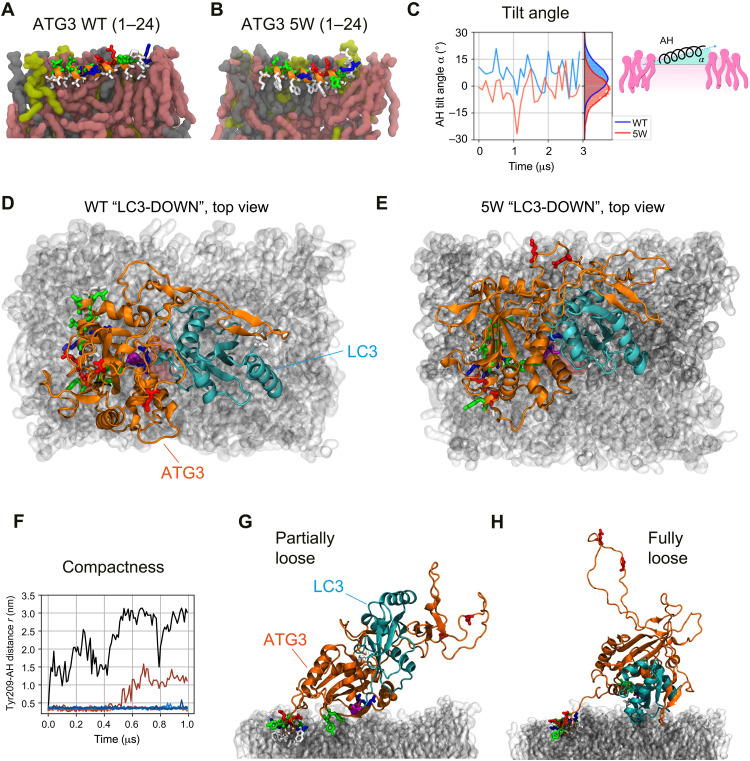
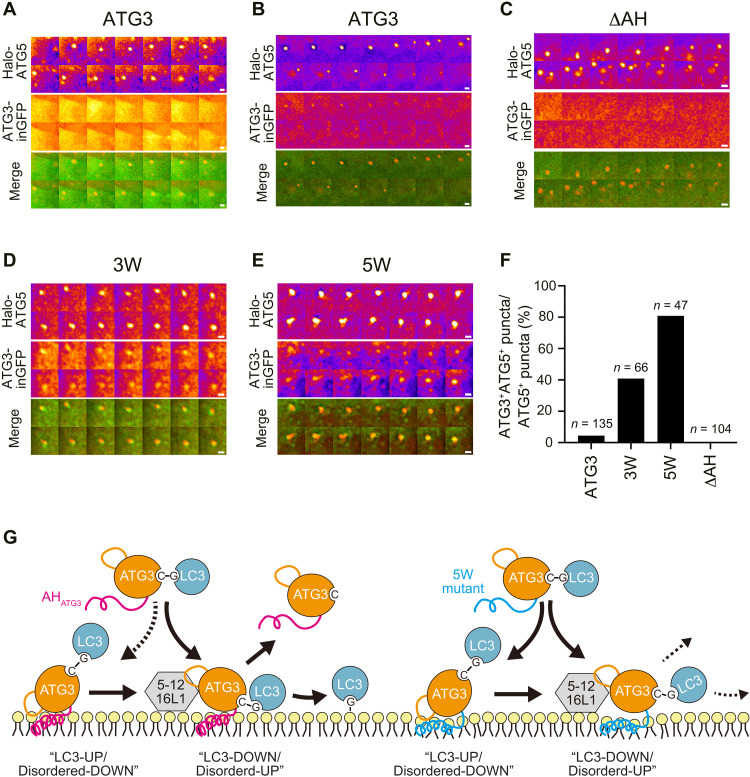
Autophagosome biogenesis requires a localized perturbation of lipid membrane dynamics and a unique protein-lipid conjugate. Autophagy-related (ATG) proteins catalyze this biogenesis on cellular membranes, but the underlying molecular mechanism remains unclear. Focusing on the final step of the protein-lipid conjugation reaction, the ATG8/LC3 lipidation, we show how the membrane association of the conjugation machinery is organized and fine-tuned at the atomistic level. Amphipathic α helices in ATG3 proteins (AHATG3) have low hydrophobicity and contain less bulky residues. Molecular dynamics simulations reveal that AHATG3 regulates the dynamics and accessibility of the thioester bond of the ATG3~LC3 conjugate to lipids, enabling the covalent lipidation of LC3. Live-cell imaging shows that the transient membrane association of ATG3 with autophagic membranes is governed by the less bulky-hydrophobic feature of AHATG3. The unique properties of AHATG3 facilitate protein-lipid bilayer association, leading to the remodeling of the lipid bilayer required for the formation of autophagosomes.


Figures

Fig. 1.
Fig. 1.. AHATG3 cannot be substituted for by unrelated AHs in human ATG3 protein.
(A) Far ultraviolet (UV) CD spectra of AHATG3 peptide (75 μM) in the absence or presence of DOPC/DOPE (70/30) liposomes (6 mM). A peptide corresponding to the N-terminal ATG3 (1 to 22 amino acids) sequence and containing additional C-terminal WK residues was used to facilitate titration by UV spectroscopy. The diameter of sonicated liposomes and liposomes extruded through 0.1- or 0.2-μm filters were 38, 100, and 147 nm, respectively. MRE, mean residue ellipticity. (B) Helicity at 222 nm as determined from the spectra shown in (A). Data represent the means ± SEM of three biological replicates. (C) An experimental scheme of ATG3 rescue assay using ATG3 chimeras. ATG3 KO MEFs expressing ATG3 WT, ATG3 ΔAH deletion mutant, or ATG3 chimera were used to analyze LC3 lipidation and LC3 puncta formation. The domain organization of ATG3-inGFP is shown: A GFP tag is inserted into the region after E125 residue. P21 and L23 in the conserved region following AHATG3 are coded in all ATG3 constructs. (D and F) LC3 flux assay. The indicated cells were starved for 6 hours with (B) or without 100 nM BafA1 (S) or cultured in full media (F). Cell lysates were analyzed by immunoblotting using the indicated antibodies. (E) LC3 puncta formation. The cells were starved for 1 hour, fixed, and stained with anti-LC3 antibody. The specimens were analyzed by an FV3000 confocal microscope. Arrowheads indicate the membrane localization of ATG3 chimeras. Scale bar, 10 μm. Differences were statistically analyzed by one-way analysis of variance (ANOVA) and Tukey multiple comparison test. ***P < 0.001.
Fig. 2.
Fig. 2.. Characterization of conserved AHATG3 features by unsupervised machine learning.
(A and B) The amphipathic properties of AHs used in the ATG3 rescue assay. Helical wheel representations of AHs derived from ATG3 proteins (A) and other unrelated proteins (B) were generated in HeliQuest. Hydrophobic residues are shown in yellow, arginine and lysine in dark blue, histidine in light blue, serine and threonine in purple, glutamine and asparagine in pink, proline in green, glutamate and aspartate in red, and glycine and alanine in gray. Arrows in helical wheels correspond to the hydrophobic moment. (C) Flowchart of AH data analysis. (D) Three-dimensional PCA of amino acid composition and helical parameter dataset. AHs derived from ATG3 proteins were categorized into five groups by phylum: Chordata, Arthropoda, Nematoda, Streptophyta, and Ascomycota. Each of the groups is represented by the indicated color. (E) PCA loading matrix. The number of polar residues (Polar AA: S, T, N, H, Q, E, D, K, and R), apolar residues (Apolar AA: A, L, V, I, M, Y, W, F, P, and C), charged residues (Charged AA: E, D, K, and R), and bulky-hydrophobic residues (Bulky AA: F and W) were used in the PCA. (F and G) Mean hydrophobicity (F) and the number of bulky-hydrophobic residues (G) of AHs. The thick and thin lines in the violin plot represent the medians and quartiles of each group, respectively.
Fig. 3.
Fig. 3.. Low hydrophobicity and less bulky features are crucial for AHATG3 to be functional for LC3 lipidation.
(A) Helical wheel representations of higher bulky-hydrophobic AHATG3 and less bulky-hydrophobic AHATG2A mutants. V8K mutation destroys the amphipathic character of AHATG3. Asterisks indicate the position of mutations. (B) LC3 flux assay of ATG3 KO cells expressing ATG3 WT or the indicated ATG3 mutants. The cells were starved for 6 hours with (B) or without 100 nM BafA1 (S) or cultured in full media (F). Cell lysates were analyzed by immunoblotting using the indicated antibodies. (C) Band intensity quantification of LC3-II. All data were normalized with those of HSP90. Data represent the means ± SEM of three biological replicates. (D) LC3 puncta formation. The cells were starved for 1 hour, fixed, and stained with anti-LC3 antibody. The specimens were analyzed by an FV3000 confocal microscope. Scale bar, 10 μm. (E) Quantification of the number of LC3 puncta. The thick and thin lines in the violin plot represent the medians and quartiles, respectively. The average number of LC3 puncta per cell was counted from randomly selected areas (n ≧ 14). (F) LC3 flux assay of ATG3 KO cells expressing ATG3 WT or the indicated ATG3 chimeras. Note that the ATG3 chimera carrying less bulky-hydrophobic mutant ATG2A-m1 showed the partial restoration of LC3 lipidation. (G) Band intensity quantification of LC3-II. All data were normalized with those of HSP90. Data represent the means ± SEM of three biological replicates. Differences were statistically analyzed by one-way ANOVA and Tukey multiple comparison test. ***P < 0.001.
Fig. 4.
Fig. 4.. The ATG3~LC3 conjugate interacts with the membrane in MD simulations.
(A and B) Renders of a representative configuration of the ATG3~LC3 conjugate in the “LC3-UP/Disordered-DOWN” conformation. (A) Side view, with the ATG3 N terminus on the left, and (B) axial view, with the terminal part of the AHATG3 closer to the viewer. The renders show the complex in a cartoon representation based on its secondary structure, with ATG3 in orange and LC3 in cyan. The heavy atoms of residues 1 to 24 (AH and linker), L61, K62, K208, Y209, P263, and C264 of ATG3, and M1, K42, F119, and G120 of LC3 are also shown explicitly in a licorice representation. The lipid bilayer is shown in transparent gray material. Water and ions are not shown for convenience. (C) Histogram of the 10 longest-lasting protein-lipid contacts formed in the “LC3-UP/Disordered-DOWN” conformation. Orange indicates contacts formed between an amino acid of ATG3 and lipid head groups. (D and E) Renders of a representative configuration of the ATG3~LC3 conjugate in the “LC3-DOWN/Disordered-UP” conformation. Rendering and colors as in (A) and (B). A PE lipid forming a long-lasting contact with C264 of ATG3 is highlighted in burgundy. (F) Histogram of the 10 longest-lasting protein-lipid contacts formed in the “LC3-DOWN/Disordered-UP” conformation. Cyan indicates contacts formed between an amino acid of LC3 and lipid head groups.
Fig. 5.
Fig. 5.. The 5W AH mutant hinders interactions between LC3 and the membrane.
(A and B) Renders of representative molecular configurations of the (A) WT AH of ATG3 and (B) 5W mutant. The secondary structure and residues of the AH are shown as orange cartoon and licorice residues, respectively. The renders show a cross section of the bilayer leaflet where the AHs are inserted. The bilayer contains the same amount of PE, PI, and PC lipids, shown in burgundy, yellow, and gray, respectively. Water and ions are not shown. (C) Tilt angle α formed by the AH in a lipid bilayer. The cartoon inset shows a definition of α. The right part of the plot reports a histogram of the two title angles. (D and E) Top-view renders of two representative configurations of the ATG3~LC3 conjugate in the “LC3-DOWN” conformation for (A) the WT and (B) the 5W mutation. The atoms of residues 1 to 24 (AH and linker), L61, K62, K208, Y209, P263, and C264 of ATG3, and M1, K42, F119, and G120 of LC3 are also shown explicitly in a licorice representation. Both conformations are oriented in the same way, with the AH inserted in the bilayer on the left along the vertical direction from the C terminus (bottom) to the N terminus (top). (F) ATG3~LC3 conjugate compactness as measured by the distance between Y209 and the AH. The plot shows 10 time series coming from five simulations of the WT complex and further five simulations of the 5W complex. The black and burgundy curves come from the 5W simulations. (G and H) Representative conformations adopted by the 5W ATG3~LC3 conjugate corresponding to the burgundy (G) and black (H) curves in (F), respectively. Rendering and colors as in (D) and (E).
Fig. 6.
Fig. 6.. Dynamic behavior of ATG3 on autophagic membranes depends on less bulky-hydrophobic AH.
(A and B) Live imaging analysis of ATG3-inGFP and Halo-ATG5 under starved conditions. The cells were cultured in starvation medium with 200 nM Halo-SaraFluor 650T ligand and observed using a DeltaVision microscopy system. Frames were captured every 30 s. Images are represented in the fire lookup table. Two representative images of ATG3 WT are shown. ATG3 was uniformly distributed in the cytoplasm all the time during ATG5 showing a punctate structure (A), while an enrichment of ATG3 signal was observed on ATG5 punctum in some cells (B). (C to E) Representative images of ΔAH deletion mutant (C) and hydrophobic ATG3 mutants, 3W (D) and 5W (E). Scale bars, 1 μm. (F) Quantification of ATG3– and ATG5–double positive structures in live imaging analysis of at least three biological replicates. (G) A speculative model for AHATG3-dependent ATG3 enzymatic reaction. Left: The ATG3~LC3 conjugate is recruited to the membranes via AHATG3. When the disordered region points downward, LC3 stays away from the membranes (LC3-UP/Disordered-DOWN). Once the disordered region points upward and binds to ATG12, the Gly~Cys thioester bond can get access to PE lipids, followed by LC3 lipidation and ATG3 leaving from the membranes (LC3-DOWN/Disordered-UP). Right: The ATG3~LC3 conjugate carrying 5W mutation in AHATG3 is stably associated with the membranes irrespective of its interaction with ATG12. 5W mutation interferes with the organization and/or stability of the ATG3~LC3 conjugate in the LC3-DOWN conformation, resulting in less LC3 lipidation.

References

    1. Mizushima N., Yoshimori T., Ohsumi Y., The role of Atg proteins in autophagosome formation. Annu. Rev. Cell Dev. Biol. 27, 107–132 (2011). - PubMed
    1. Nakatogawa H., Mechanisms governing autophagosome biogenesis. Nat. Rev. Mol. Cell Biol. 21, 439–458 (2020). - PubMed
    1. Nishimura T., Tooze S. A., Emerging roles of ATG proteins and membrane lipids in autophagosome formation. Cell Discov. 6, 32 (2020). - PMC - PubMed
    1. van Vliet A. R., Chiduza G. N., Maslen S. L., Pye V. E., Joshi D., De Tito S., Jefferies H. B. J., Christodoulou E., Roustan C., Punch E., Hervás J. H., O'Reilly N., Skehel J. M., Cherepanov P., Tooze S. A., ATG9A and ATG2A form a heteromeric complex essential for autophagosome formation. Mol. Cell 82, 4324–4339.e8 (2022). - PubMed
    1. Noda N. N., Atg2 and Atg9: Intermembrane and interleaflet lipid transporters driving autophagy. Biochim. Biophys. Acta Mol. Cell Biol. Lipids 1866, 158956 (2021). - PubMed

MeSH terms

Substances