. 2023 Jun 23;8(84):eadd6910.
doi: 10.1126/sciimmunol.add6910. Epub 2023 Jun 23.

Rewilding of laboratory mice enhances granulopoiesis and immunity through intestinal fungal colonization

Affiliations

Rewilding of laboratory mice enhances granulopoiesis and immunity through intestinal fungal colonization

Ying-Han Chen et al. Sci Immunol. .

Abstract

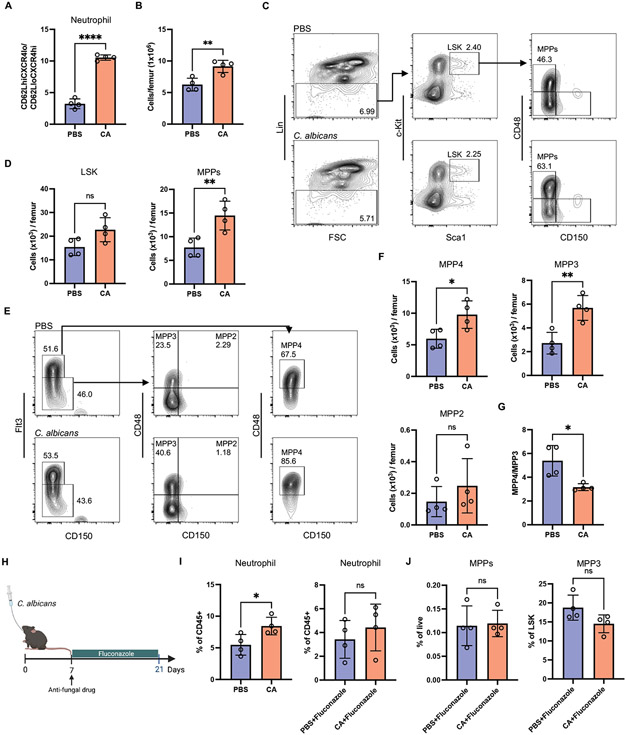
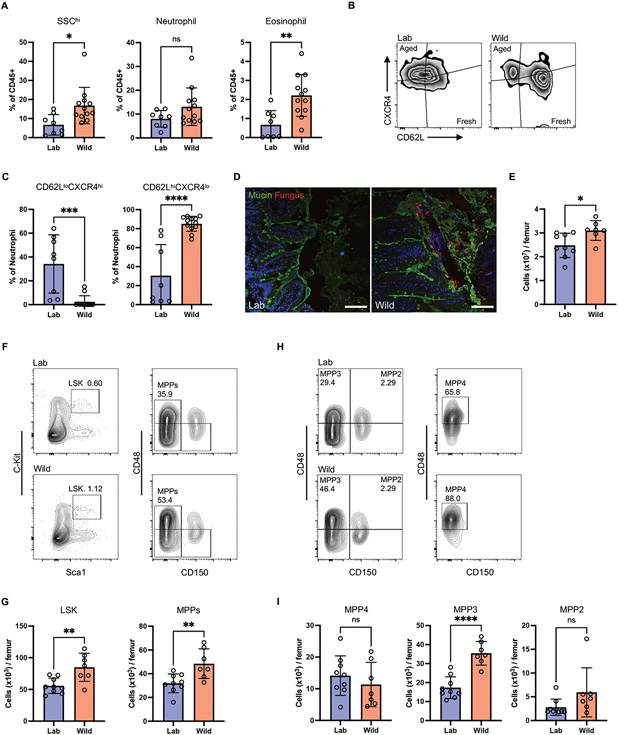
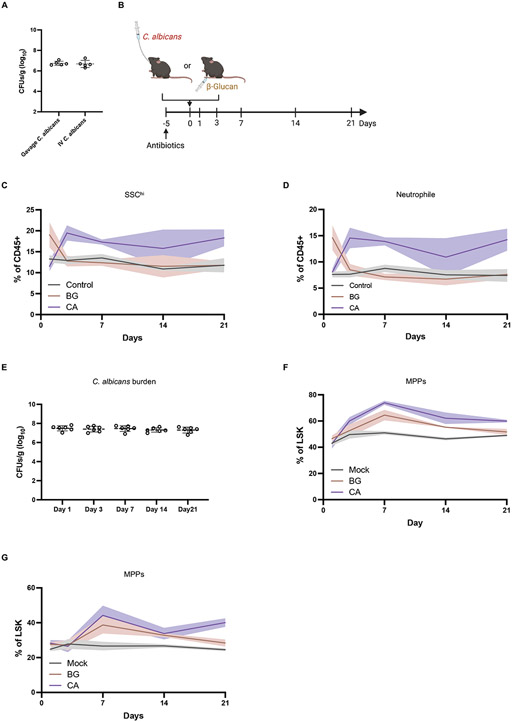
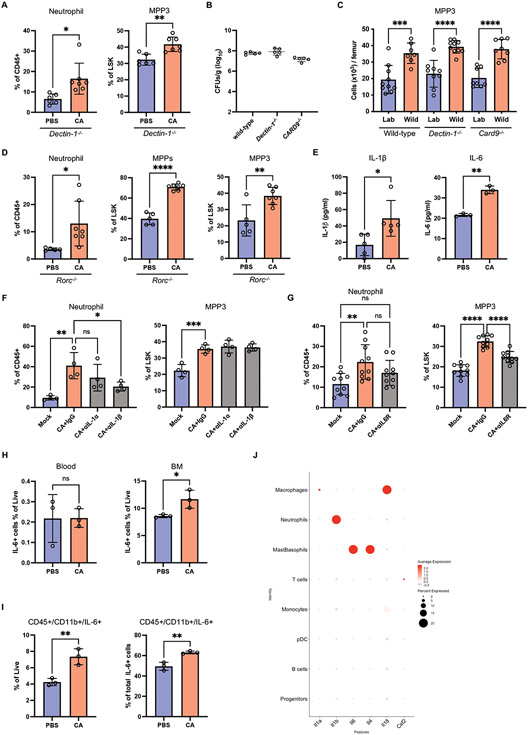
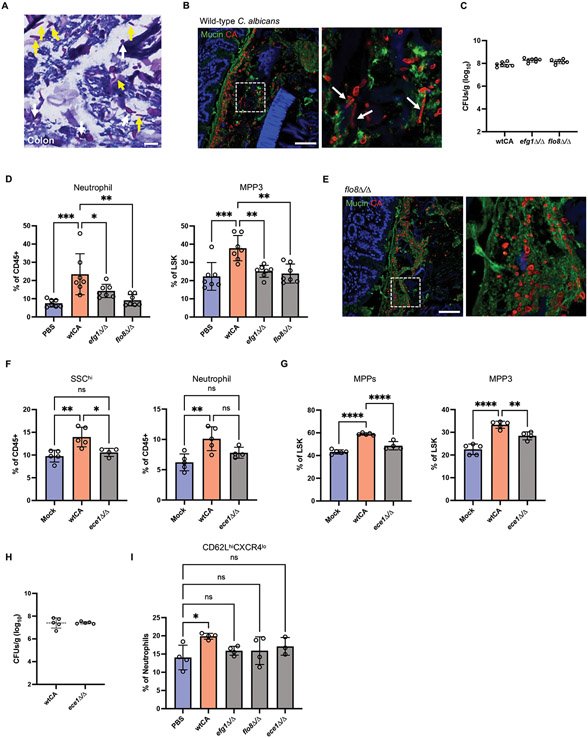
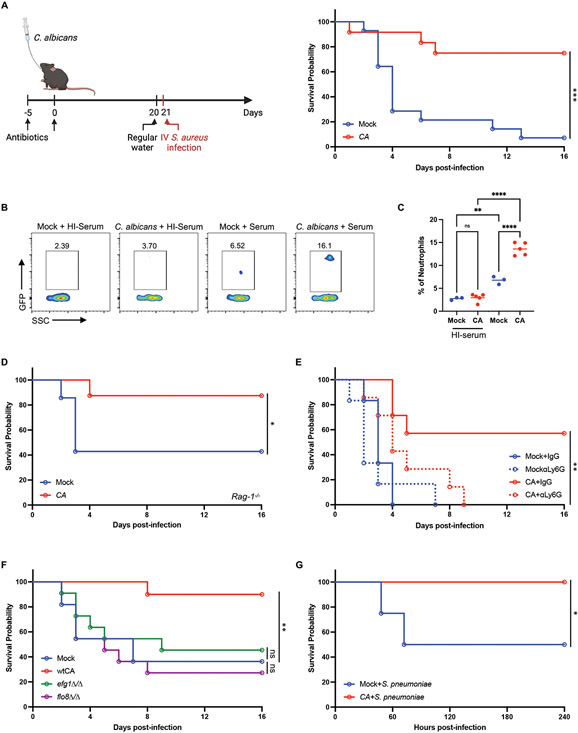
The paucity of blood granulocyte populations such as neutrophils in laboratory mice is a notable difference between this model organism and humans, but the cause of this species-specific difference is unclear. We previously demonstrated that laboratory mice released into a seminatural environment, referred to as rewilding, display an increase in blood granulocytes that is associated with expansion of fungi in the gut microbiota. Here, we find that tonic signals from fungal colonization induce sustained granulopoiesis through a mechanism distinct from emergency granulopoiesis, leading to a prolonged expansion of circulating neutrophils that promotes immunity. Fungal colonization after either rewilding or oral inoculation of laboratory mice with Candida albicans induced persistent expansion of myeloid progenitors in the bone marrow. This increase in granulopoiesis conferred greater long-term protection from bloodstream infection by gram-positive bacteria than by the trained immune response evoked by transient exposure to the fungal cell wall component β-glucan. Consequently, introducing fungi into laboratory mice may restore aspects of leukocyte development and provide a better model for humans and free-living mammals that are constantly exposed to environmental fungi.


Figures

Fig. 1.
Fig. 1.. Inoculation of laboratory mice with C. albicans drives expansion of myeloid progenitors.
(A) Ratio of newly released (CD62LhiCXCR4lo) population to aged (CD62LloCXCR4hi) population of Ly6G+ peripheral neutrophils from antibiotic-treated mice 21 days post-inoculation with PBS or C. albicans. N = 4 mice per group. (B) The cellularity of total BM cells from germ-free mice 21 days post-inoculation with PBS or C. albicans. N = 4 mice per group. (C) Representative flow cytometry plots depicting gating strategy for hematopoietic stem cells and progenitors in BM from germ-free mice inoculated with PBS or C. albicans. LSK cells were gated from Lin cells and characterized as Sca1+c-Kit+ cells. A subpopulation of LSK was further characterized as MPP (CD48+CD150LSK). (D) Quantification of number of LSK and MPPs from (C). N = 4 mice per group. (E) Representative flow cytometry plots depicting gating strategy used to identify MPP subsets in BM from germ-free mice inoculated with PBS or C. albicans. MPP4 cells were gated on Flt3+LSK and identified by CD48 and CD150. MPP3 and MPP2 cells were gated on Flt3LSK and identified by CD48 and CD150. (F) Quantification of the number of MPP subsets from (E). (G) Ratio of MPP4 to MPP3. (H) Germ-free mice were administrated fluconazole in the drinking water continuously starting from day 7 post-inoculation with PBS or C. albicans. Blood and BM analysis were performed day 21 post-inoculation N = 4 mice per group. (I) Frequency of neutrophils in the peripheral blood of germ-free mice treated as in (H). (J) Frequency of MPPs and MPP3 in the BM of germ-free mice treated as in (H). Dots in bar graphs correspond to individual mice. Mean and SD are shown. *p < 0.05, **p < 0.01, ****p < 0.0001 by two-tailed Student’s t test between groups. ns, not significant.
Fig. 2.
Fig. 2.. Rewilding increases granulopoiesis.
(A) Frequency of granulocytes (SSChi), neutrophils (Ly6G+), and eosinophils (Siglec-F+) in the peripheral blood of rewilded mice (Wild) and control mice maintained in the laboratory condition (Lab). Neutrophils and eosinophils were gated on Live+CD45+CD11b+. N=8 lab and 12 rewilded mice. (B) Representative flow cytometry plots of newly released (CD62LhiCXCR4lo) and aged (CD62LloCXCR4hi) neutrophils. (C) Quantification of proportion of fresh and aged neutrophils. N=8 lab and 12 rewilded mice. (D) Confocal images of ileum sections immunostained with anti-candida antibody (non-specifically labels fungi) and counterstained with FITC-lectins mixture, which binds to oligosaccharide structures of mucins. Scale bars represent 100 μm. (E) The cellularity of total BM cells from lab and rewilded mice. N=9 lab and 7 rewilded mice (E, G, I). (F) Representative flow cytometry plots of LSK (LincKit+Sca1+) and MPPs (CD48+CD150LSK). (G) Cell number of LSK and MPPs in the BM of lab and rewilded mice. (H) Representative flow cytometry plots of MPP4, MPP3, and MPP2. (I) Cell number of MPP subsets in the BM of lab and rewilded mice. Dots in bar graphs correspond to individual mice. Mean and SD are shown. *p < 0.05, **p < 0.01, ***p < 0.001, ****p < 0.0001 by two-tailed Student’s t test between groups. ns, not significant.
Fig. 3.
Fig. 3.. Intestinal C. albicans colonization leads to sustained granulopoiesis.
(A) Colony-forming units (CFUs) of C. albicans in feces from antibiotic treated mice 21 days post-oral inoculation with C. albicans or intravenous injection with a non-lethal dose (1x10⁴ CFUs). N = 5 mice per group. (B) Experimental model of C. albicans colonization and β-glucan injection in antibiotic-treated mice. Blood and bone marrow were collected on day 1, 3, 14, and 21 of inoculation for flow cytometry analysis. N=6 mice per group. (C and D) Frequency of granulocytes (SSChi) and neutrophils in the peripheral blood from mock, C. albicans colonized and β-glucan injected mice. (E) C. albicans CFUs in feces collected from antibiotic-treated mice inoculated with C. albicans on indicated days. (F and G) Frequency of MPPs and MPP3 in the bone marrow from mock, C. albicans-colonized and β-glucan injected mice.
Fig. 4.
Fig. 4.. Fungal colonization enhances granulopoiesis in a manner dependent on IL-6R signaling.
(A) Frequency of neutrophils in the peripheral blood and MPP3 in the BM from antibiotic-treated Dectin-1−/− mice 21 days post-inoculation with C. albicans. N = 6 PBS control and N = 7 C. albicans-colonized mice. (B) Fungal CFUs in feces from C. albicans-colonized wild-type, Dectin-1−/−, and Card9−/− mice on day 21. N = 5 mice per group. (C) Quantification of number of MPP3 in the BM of laboratory and rewilded wild-type (N = 9 lab and 7 rewilded mice), Dectin-1−/− (N = 8 lab and 10 rewilded mice), and Card9−/− (N = 8 lab and 8 rewilded mice) mice. (D) Frequency of neutrophils in the peripheral blood and MPPs and MPP3 in the BM from antibiotic-treated Rorc−/− mice 21 days post-inoculation with C. albicans. N = 5 PBS control and N = 7 C. albicans-colonized mice. (E) Quantification of IL-1β (N = 5) and IL-6 (N = 3) in the BM extracellular fluid from antibiotic-treated mice 21 days post-inoculation with PBS or C. albicans. (F) Frequency of neutrophils in the peripheral blood and MPP3 in the BM on day 7 from mice treated with anti-IL-1α, anti-IL-1β or IgG isotype control antibodies on day −1, 1, 3, and 5 days post-inoculation with C. albicans. N=4 mice per group. (G) Frequency of neutrophils in the peripheral blood and MPP3 in the BM from mice treated with anti-IL-6R or IgG isotype control antibodies on day −1, 1, 3, and 5 days post-inoculation with C. albicans. N = 10 mice per group. (H) Quantification of IL-6+ cells gated on live cells in the peripheral blood and BM from antibiotic-treated mice 21 days post-inoculation with PBS or C. albicans by flow cytometry. (I) Proportion of live IL-6+ cells that are CD45+CD11b+ (left panel) and quantification of live cells that are IL-6+ myeloid cells (CD45+CD11b+) (right panel) in the BM from antibiotic-treated mice 21 days post-inoculation with PBS or C. albicans. (J) Cytokine gene expression across cell types identified by scRNA-Seq analysis. Dots in bar graphs correspond to individual mice. Mean and SD are shown. *p < 0.05, **p < 0.01, ****p < 0.0001 by two-tailed Student’s t test between groups (A, D, E, H) and ordinary one-way analysis of variance (ANOVA) with Holm-Sidak multiple comparisons test (C, F-G). ns, not significant. Antibiotic-treated groups (A, D-I).
Fig. 5.
Fig. 5.. Candidalysin promotes granulopoiesis.
(A) PAS-stained colonic section from C. albicans-colonized antibiotic-treated mice. White and yellow arrows indicate yeast and hyphal structures, respectively. Scale bar represents 10 μm. (B) Confocal images of wild-type C. albicans colonized colon sections immunostained with anti-candida antibody and counterstained with FITC-lectins mixture. Region of interest is magnified in right panel. Arrows indicate the hyphal structure. Scale bar represents 100 μm. (C) Fungal CFUs in feces from antibiotic treated mice 21 days post-inoculation with wild-type C. albicans and yeast-locked mutants. (D) Frequency of neutrophils in the peripheral blood and MPP3 in the BM on day 21 after wild-type and mutant (efg1Δ/Δ and flo8Δ/Δ) C. albicans inoculation. N = 7 mice per group. (E) Confocal images of colon sections from mice colonized with the FLO8 deletion mutant immunostained with anti-candida antibody and counterstained with FITC-lectins mixture. Region of interest is magnified in right panel. Scale bar represents 100 μm. (F) Frequency of SSChi granulocytes and neutrophils in the peripheral blood on day 21 after wild-type and mutant (ece1Δ/Δ) C. albicans inoculation. (G) Frequency of MPPs and MPP3 in the BM on day 21 after wild-type and mutant (ece1Δ/Δ) C. albicans inoculation. N = 5 PBS control, N = 5 wtCA-colonized mice, and N = 4 mutant (ece1Δ/Δ) CA colonized mice. (H) Fungal CFUs in feces from antibiotic treated mice 21 days post-inoculation with wild-type and ece1Δ/Δ C. albicans. (I) Frequency of fresh neutrophils (CD62LhiCXCR4lo) in the peripheral blood on day 21 after wild-type and mutant C. albicans inoculation. Dots in bar graphs correspond to individual mice. Mean and SD are shown. *p < 0.05, **p < 0.01, ****p < 0.0001 by ordinary one-way analysis of variance (ANOVA) with Holm-Sidak multiple comparisons test. ns, not significant.
Fig. 6.
Fig. 6.. Intestinal colonization by C. albicans protects against gram-positive bacterial infections.
(A) Survival following i.v. injection of S. aureus on day 21 following PBS (mock, N=14) or C. albicans (N=12) inoculation. Antibiotics-containing water was swapped with regular water 24 hours before S. aureus infection. 3 independent repeats. (B) Representative flow cytometry plots of neutrophils isolated from the BM of mock and C. albicans-colonized mice incubated with GFP-labeled S. aureus together with untreated or heat-inactivated (HI) mouse serum for 20 minutes at a multiplicity of infection (MOI) of 25. (C) Quantification of frequency of GFP+ neutrophils from (B). N = 3 mock and N = 5 C. albicans-colonized mice. (D) Survival of Rag1−/− knockout mice infected with S. aureus on day 21 after PBS (N=7) or C. albicans (N=8) inoculation. 2 independent repeats. (E) Survival of mice infected with S. aureus on day 21 after PBS or C. albicans inoculation and treated with anti-Ly6G or IgG isotype control antibodies on day −1, 1, 3, 5, and 7 days post-infection. N = 7 mice per group. (F) Survival of mice infected with S. aureus on day 21 after inoculation with PBS, wild-type, or mutant C. albicans (efg1Δ/Δ and flo8D/flo8Δ/Δ). N = 22 mice per group. 2 independent repeats. (G) Survival of mice injected i.p. with S. pneumoniae on day 21 after PBS or C. albicans inoculation. N = 12 mice per group. Dots in bar graphs correspond to individual mice. Mean and SD are shown. *p < 0.05, **p < 0.01, ***p < 0.001, ****p < 0.0001 by ordinary one-way analysis of variance (ANOVA) with Holm-Sidak multiple comparisons test (C). (A, D-G) log-rank Mantel–Cox test. ns, not significant.
Fig. 7.
Fig. 7.. Intestinal C. albicans colonization mediates longer-lasting protection from S. aureus compared with β-glucan stimulation.
(A) Schematic depicting experimental procedure in (B). Antibiotic-treated mice were orally inoculated with PBS (mock) (N=7) or C. albicans (N=9) or intraperitoneally injected with β-glucan (1mg) (N=9). Antibiotics-containing water was swapped with regular water on day 6 and mice were injected i.v. with S. aureus on day 7. (B) Survival of mice infected with S. aureus on day 7 post-inoculation with C. albicans or β-glucan. (C) Schematic depicting experimental procedure in (D) and (E). Similar to (A) except mice were injected i.v. with S. aureus on day 21. (D) Survival of mice infected with S. aureus on day 21 post-inoculation with C. albicans or β-glucan. N = 25 mice per group. 2 independent repeats. (E) Survival of Dectin-1−/− mice infected with S. aureus on day 21 post-inoculation with C. albicans or β-glucan. N = 7 mice per group. *p < 0.05, **p < 0.01 by log-rank Mantel–Cox test (B, D-E). ns, not significant.

References

    1. Rakoff-Nahoum S, Paglino J, Eslami-Varzaneh F, Edberg S, Medzhitov R, Recognition of commensal microflora by toll-like receptors is required for intestinal homeostasis. Cell 118, 229–241 (2004). - PubMed
    1. Smith K, McCoy KD, Macpherson AJ, Use of axenic animals in studying the adaptation of mammals to their commensal intestinal microbiota. Semin Immunol 19, 59–69 (2007). - PubMed
    1. Ivanov II et al., Induction of intestinal Th17 cells by segmented filamentous bacteria. Cell 139, 485–498 (2009). - PMC - PubMed
    1. Hill DA et al., Metagenomic analyses reveal antibiotic-induced temporal and spatial changes in intestinal microbiota with associated alterations in immune cell homeostasis. Mucosal Immunol 3, 148–158 (2010). - PMC - PubMed
    1. Lima-Junior DS et al., Endogenous retroviruses promote homeostatic and inflammatory responses to the microbiota. Cell 184, 3794–3811 e3719 (2021). - PMC - PubMed