. 2023 Oct 2;22(10):1128-1143.
doi: 10.1158/1535-7163.MCT-23-0164.

MTX-13, a Novel PTK7-Directed Antibody-Drug Conjugate with Widened Therapeutic Index Shows Sustained Tumor Regressions for a Broader Spectrum of PTK7-Positive Tumors

Affiliations

MTX-13, a Novel PTK7-Directed Antibody-Drug Conjugate with Widened Therapeutic Index Shows Sustained Tumor Regressions for a Broader Spectrum of PTK7-Positive Tumors

Chao Kong et al. Mol Cancer Ther. .

Abstract

Protein tyrosine kinase 7 (PTK7) is a Wnt signaling pathway protein implicated in cancer development and metastasis. When using a potent microtubule inhibitor (Aur0101), PTK7-targeting antibody-drug conjugate (ADC), h6M24-vc0101 (PF-06647020/cofetuzumab pelidotin) is efficacious only in limited tumor types with low response rates in a phase I trial. To improve patient response and to expand responding tumor types, we designed MTX-13, a PTK7-targeting ADC consisting of a novel antibody (Ab13) conjugated to eight molecules of topoisomerase I inhibitor exatecan through T1000, a novel self-immolative moiety. MTX-13 exhibited PTK7-specific cell binding, efficient internalization, and exatecan release to cause cytotoxic activity through DNA damage and apoptosis induction, and a strong bystander killing. MTX-13 displayed potent antitumor activities on cell line-derived xenograft and patient-derived xenograft models from a wide range of solid tumors, significantly outperforming h6M24-vc0101. PTK7 was shown to be an actionable target in small cell lung cancer for which MTX-13 showed complete and durable responses. With a consistent overexpression of PTK7 in squamous cell carcinomas derived from diverse anatomic sites, strong potency of MTX-13 in this group of heterogenous tumors suggested a common treatment strategy. Finally, MTX-13 inhibited tumor growth and metastasis in an orthotopic colon cancer xenograft model. MTX-13 displayed a favorable pharmacokinetic and safety profile in monkeys with the highest non-severely toxic dose (HNSTD) of ≥30 mg/kg, significantly higher than 3-5 mg/kg of HNSTD for h6M24-vc0101. The higher therapeutic index of MTX-13 bodes well for its clinical translation with the potential to expand the responding patient population beyond that of current PTK7-targeting ADCs.


Figures

None
Graphical abstract
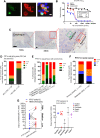
Figure 1. PTK7 expression profile by a novel PTK7-targeting antibody. A, mAb13 binding specificity. The specificity of an anti-PTK7 antibody mAb13 is shown as immunofluorescence colocalization of red mAb staining and green GFP-tagged target in 293T of overexpressed PTK7 in 293T cells. Representative negative staining on the un-transfected cells (blue only) is indicated by a red arrow. Scale bars, 20 μm. B, Cell binding affinity of humanized Ab13. Ab13 binds to PTK7-positive cell line OVCAR-3 at an affinity (EC50) of about 21 pmol/L measured by follow cytometry, comparing to EC50 of 60 pmol/L of the benchmark antibody h6M24. Data from 3 individual measurements. C, Representative images of IHC staining of mouse Ab13 (mAb13) on normal human tissue. PTK7 was expressed in the esophagus at basal keratinocytes but was negative in parabasal epithelium cells. Scale bar, 50 μm. D, PTK7 expression in SCLC and liver cancer. The positive rate (%) and the number (n) of SCLC and liver cancer patient samples surveyed were indicated. Scale bar, 20 μm. E, PTK7 expression in squamous cell carcinomas. The positive rate (%) and the number (n) of patient samples surveyed were indicated for each squamous cell cancer type. IHC assays were done using mAb13 on archived individual patient tissue samples. F, PTK7 expression increased in rectal cancer with metastasis. Tabulation of PTK7 expression in primary or metastatic rectal cancer. G, PTK7 expression level defined by the number of PTK7 molecules per cancer cell measured by flow cytometry (QIFIKIT using mAb13). Left, HER2 expression on the same cell line was shown for comparison (connected by dotted lines). Expression level was classified as low, medium, and high by the number of target molecules per cell: 0–10,000 as low, 10,000–100,000 as medium, and 100,000–1 million as high. The average copy number/cell of PTK7 was 35,000 versus 120,000 for HER2. Right, PTK7 copy number on cell lines classified by tumor type.
Figure 1.
PTK7 expression profile by a novel PTK7-targeting antibody. A, mAb13 binding specificity. The specificity of an anti-PTK7 antibody mAb13 is shown as immunofluorescence colocalization of red mAb staining and green GFP-tagged target in 293T of overexpressed PTK7 in 293T cells. Representative negative staining on the un-transfected cells (blue only) is indicated by a red arrow. Scale bars, 20 μm. B, Cell binding affinity of humanized Ab13. Ab13 binds to PTK7-positive cell line OVCAR-3 at an affinity (EC50) of about 21 pmol/L measured by follow cytometry, comparing to EC50 of 60 pmol/L of the benchmark antibody h6M24. Data from 3 individual measurements. C, Representative images of IHC staining of mouse Ab13 (mAb13) on normal human tissue. PTK7 was expressed in the esophagus at basal keratinocytes but was negative in parabasal epithelium cells. Scale bar, 50 μm. D, PTK7 expression in SCLC and liver cancer. The positive rate (%) and the number (n) of SCLC and liver cancer patient samples surveyed were indicated. Scale bar, 20 μm. E, PTK7 expression in squamous cell carcinomas. The positive rate (%) and the number (n) of patient samples surveyed were indicated for each squamous cell cancer type. IHC assays were done using mAb13 on archived individual patient tissue samples. F, PTK7 expression increased in rectal cancer with metastasis. Tabulation of PTK7 expression in primary or metastatic rectal cancer. G, PTK7 expression level defined by the number of PTK7 molecules per cancer cell measured by flow cytometry (QIFIKIT using mAb13). Left, HER2 expression on the same cell line was shown for comparison (connected by dotted lines). Expression level was classified as low, medium, and high by the number of target molecules per cell: 0–10,000 as low, 10,000–100,000 as medium, and 100,000–1 million as high. The average copy number/cell of PTK7 was 35,000 versus 120,000 for HER2. Right, PTK7 copy number on cell lines classified by tumor type.
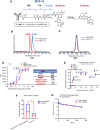
Figure 2. Structure, stability, cellular dynamics, and bystander killing effect of MTX-13. A, Structure of MTX-13. Exatecan is attached to T1000, a polysarcosine sidechain (red color) modified self-immolative (indicated by a red scissor) PABC spacer. T1000–exatecan is then linked to Ab13 through the VA–MC linker. Exatecan is released as a payload. B, Hydrophobic interaction chromatograms (HIC) MTX-13 and MTX-624 (h6M24–T1000–exatecan), which has a uniform DAR 8 distribution by the reverse-phase chromatographic analysis. C, Size exclusion chromatograms (SEC) of MTX-13/MTX-624. D, Antibody and ADC binding to cell-surface PTK7 by flow cytometry. Antibody/ADC concentration series was incubated with PTK7-positive cell line PC9 and EC50 was calculated and tabulated on the right. Data from 3 measurements. E, Correlation of exatecan release and target expression. PTK7 expression on each cell line is determined by flow cytometry and exatecan concentration in the culture media at 24 hours after treatment with 100 nmol/L MTX-13 was determined by LC/MS-MS (N = 3). F, Bystander killing effect of MTX-13 in coculture conditions in vitro. H520 and A549 cells were cocultured and treated with 10 nmol/L ADCs for 5 days. After collecting adherent cells, cell number and ratio of PTK7‐positive and PTK7‐negative cells were determined by a cell counter and a flow cytometer, respectively. Numbers of H520 and A549 viable cells. Each bar represents the mean and SD (n = 3). The number of negative cells A549 in two groups was tested by a two-tailed t test. ***, P < 0.001. G, Pharmacokinetic analysis of MTX-13 in H1975 xenograft mouse model. Mice (N = 3) inoculated with H1975 cells were intravenously administered with MTX-13, Ab13, and control ADC or vehicle on day 0. Total antibody and ADC in plasma were measured at indicated time points.
Figure 2.
Structure, stability, cellular dynamics, and bystander killing effect of MTX-13. A, Structure of MTX-13. Exatecan is attached to T1000, a polysarcosine sidechain (red color) modified self-immolative (indicated by a red scissor) PABC spacer. T1000–exatecan is then linked to Ab13 through the VA–MC linker. Exatecan is released as a payload. B, Hydrophobic interaction chromatograms (HIC) MTX-13 and MTX-624 (h6M24–T1000–exatecan), which has a uniform DAR 8 distribution by the reverse-phase chromatographic analysis. C, Size exclusion chromatograms (SEC) of MTX-13/MTX-624. D, Antibody and ADC binding to cell-surface PTK7 by flow cytometry. Antibody/ADC concentration series was incubated with PTK7-positive cell line PC9 and EC50 was calculated and tabulated on the right. Data from 3 measurements. E, Correlation of exatecan release and target expression. PTK7 expression on each cell line is determined by flow cytometry and exatecan concentration in the culture media at 24 hours after treatment with 100 nmol/L MTX-13 was determined by LC/MS-MS (N = 3). F, Bystander killing effect of MTX-13 in coculture conditions in vitro. H520 and A549 cells were cocultured and treated with 10 nmol/L ADCs for 5 days. After collecting adherent cells, cell number and ratio of PTK7‐positive and PTK7‐negative cells were determined by a cell counter and a flow cytometer, respectively. Numbers of H520 and A549 viable cells. Each bar represents the mean and SD (n = 3). The number of negative cells A549 in two groups was tested by a two-tailed t test. ***, P < 0.001. G, Pharmacokinetic analysis of MTX-13 in H1975 xenograft mouse model. Mice (N = 3) inoculated with H1975 cells were intravenously administered with MTX-13, Ab13, and control ADC or vehicle on day 0. Total antibody and ADC in plasma were measured at indicated time points.
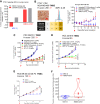
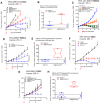
Figure 3. MTX13 outperforms h6M24-vc0101 in ovarian cancer and TNBC. A, In vivo efficacy of MTX-13 and h6M24-vc0101 in ovarian cancer (SK-OV-3 and OVCAR-3) CDX models. B–E, In vivo efficacy of MTX-13 and h6M24-vc0101 in TNBC CDX/PDX models. For all in vivo studies, cell line/PDX tumor type is labeled. Target expression in each model is shown as flow cytometry (relative MFI) and/or IHC staining on untreated mouse tumor tissue with H-score evaluated. Scale bars, 20 μm. CDX/PDX mice were intravenously administered with indicated ADCs (10 mg/kg for MTX-13 and 5 mg/kg for h6M24-vc0101 unless otherwise labeled) on day 0 (tumor size reached an average of 150–200 mm3) indicated by red arrows. Each value represents the mean and SEM (N = 4 or 5). Unpaired two-sided t test. *, P < 0.05; **, P < 0.01; ***, P < 0.001. F, A summary of tumor volume change from baseline for all ADCs in B–E.
Figure 3.
MTX13 outperforms h6M24-vc0101 in ovarian cancer and TNBC. A,In vivo efficacy of MTX-13 and h6M24-vc0101 in ovarian cancer (SK-OV-3 and OVCAR-3) CDX models. B–E,In vivo efficacy of MTX-13 and h6M24-vc0101 in TNBC CDX/PDX models. For all in vivo studies, cell line/PDX tumor type is labeled. Target expression in each model is shown as flow cytometry (relative MFI) and/or IHC staining on untreated mouse tumor tissue with H-score evaluated. Scale bars, 20 μm. CDX/PDX mice were intravenously administered with indicated ADCs (10 mg/kg for MTX-13 and 5 mg/kg for h6M24-vc0101 unless otherwise labeled) on day 0 (tumor size reached an average of 150–200 mm3) indicated by red arrows. Each value represents the mean and SEM (N = 4 or 5). Unpaired two-sided t test. *, P < 0.05; **, P < 0.01; ***, P < 0.001. F, A summary of tumor volume change from baseline for all ADCs in B–E.
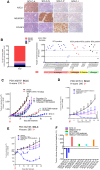
Figure 4. PTK7 is an actionable target in small cell lung cancer. A, Representative IHC staining of tumor cell nuclei for ASCL1, NEUROD1, and POU2F3 in four types of SCLC. Scale bar, 20 μm. B, PTK7 expression in a panel of human patient tissue samples of SCLC. Overall positivity is shown on the left, and expression in each patient and subtype is shown on the right. C–E, In vivo efficacy of MTX-13 in SCLC PDX models. For all in vivo models, cell line/PDX tumor type is labeled. Target expression in each model is shown as flow cytometry (relative MFI) and/or IHC staining on untreated mouse tumor tissue with H-score evaluated. Scale bars, 20 μm. CDX/PDX mice were intravenously administered with indicated ADCs (10 mg/kg for MTX-13, DS-7300a, and SC16–T1000–exatecan) and 5 mg/kg for h6M24-vc0101 unless otherwise labeled) on day 0 (tumor size reached an average of 150–200 mm3) indicated by red arrows. The SCLC PDX 362797 model was intraperitoneally injected with etoposide at 10 mg/kg on days 0, 1, 2, 7, 8, 9, 14, 15, and 16, plus cisplatin at 6 mg/kg QW*3. Each value represents the mean and SEM (N = 4 or 5). Unpaired two-sided t test. *, P < 0.05; **, P < 0.01; ***, P < 0.001. F, A summary of tumor volume change from baseline for all ADCs in C–E.
Figure 4.
PTK7 is an actionable target in small cell lung cancer. A, Representative IHC staining of tumor cell nuclei for ASCL1, NEUROD1, and POU2F3 in four types of SCLC. Scale bar, 20 μm. B, PTK7 expression in a panel of human patient tissue samples of SCLC. Overall positivity is shown on the left, and expression in each patient and subtype is shown on the right. C–E,In vivo efficacy of MTX-13 in SCLC PDX models. For all in vivo models, cell line/PDX tumor type is labeled. Target expression in each model is shown as flow cytometry (relative MFI) and/or IHC staining on untreated mouse tumor tissue with H-score evaluated. Scale bars, 20 μm. CDX/PDX mice were intravenously administered with indicated ADCs (10 mg/kg for MTX-13, DS-7300a, and SC16–T1000–exatecan) and 5 mg/kg for h6M24-vc0101 unless otherwise labeled) on day 0 (tumor size reached an average of 150–200 mm3) indicated by red arrows. The SCLC PDX 362797 model was intraperitoneally injected with etoposide at 10 mg/kg on days 0, 1, 2, 7, 8, 9, 14, 15, and 16, plus cisplatin at 6 mg/kg QW*3. Each value represents the mean and SEM (N = 4 or 5). Unpaired two-sided t test. *, P < 0.05; **, P < 0.01; ***, P < 0.001. F, A summary of tumor volume change from baseline for all ADCs in C–E.
Figure 5. MTX-13 targets squamous cell carcinoma of the lung, head and neck, esophagus, and cervix. In vivo efficacy of MTX-13 and h6M24-vc0101 in squamous cell carcinoma models. A, A PDX of squamous cell carcinoma of lung. B, Summary of MTX-13 and h6M24-vc0101 efficacy in squamous cell carcinoma of the lung. C and D, Two PDXs of squamous cell carcinoma of head and neck. E, Summary of MTX-13 and h6M24-vc0101 efficacy in squamous cell carcinoma of head and neck. F and G, Two PDXs of squamous cell carcinoma of the esophagus. H, Summary of MTX-13 and h6M24-vc0101 efficacy in squamous cell carcinoma of the esophagus. For all in vivo models, PDX tumor type is labeled. Target expression in each model is shown as IHC staining on untreated mouse tumor tissue with H-score evaluated. Scale bars, 20 μm. One to three doses of ADCs were intravenously administered on day 0 (tumor size reached an average of 150–200 mm3) and dates indicated by red arrows. Each value represents the mean and SEM (N = 5). Unpaired two-sided t test. *, P < 0.05; **, P < 0.01; ***, P < 0.001.
Figure 5.
MTX-13 targets squamous cell carcinoma of the lung, head and neck, esophagus, and cervix. In vivo efficacy of MTX-13 and h6M24-vc0101 in squamous cell carcinoma models. A, A PDX of squamous cell carcinoma of lung. B, Summary of MTX-13 and h6M24-vc0101 efficacy in squamous cell carcinoma of the lung. C and D, Two PDXs of squamous cell carcinoma of head and neck. E, Summary of MTX-13 and h6M24-vc0101 efficacy in squamous cell carcinoma of head and neck. F and G, Two PDXs of squamous cell carcinoma of the esophagus. H, Summary of MTX-13 and h6M24-vc0101 efficacy in squamous cell carcinoma of the esophagus. For all in vivo models, PDX tumor type is labeled. Target expression in each model is shown as IHC staining on untreated mouse tumor tissue with H-score evaluated. Scale bars, 20 μm. One to three doses of ADCs were intravenously administered on day 0 (tumor size reached an average of 150–200 mm3) and dates indicated by red arrows. Each value represents the mean and SEM (N = 5). Unpaired two-sided t test. *, P < 0.05; **, P < 0.01; ***, P < 0.001.
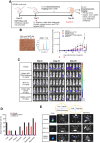
Figure 6. MTX-13 prevents metastasis in vivo in an orthotopic colon cancer xenograft model. A, Scheme of orthotopic HCT116-luc xenograft model establishment, treatment regimen, and bioluminescence imaging schedule. B, PTK7 expression (IHC and flow cytometry) and tumor growth inhibition by bioluminescence measurement (photon/second). Data are presented as the mean ± SD (n = 5). C, In vivo whole-body bioluminescence imaging of anesthetized mice before the treatment (day 0), during treatment (day 21) and after treatment (day 39). D, Organ metastasis rate as calculated by the percentage of metastasis of mouse in the whole group (n = 5). Mice are sacrificed on day 39 to obtain specific organs for ex vivo bioluminescence. E, Representative imaging of metastatic sites. Ex vivo bioluminescence imaging of primary colorectal tumor (with cecum) and metastasis organs from representative mouse of each group. Mice were intravenously administrated with two doses of vehicle (indicated by red arrows), isotype control ADCs and PTK7-targeted ADCs (10 mg/kg for MTX-13 and 5 mg/kg for h6M24-vc0101 unless otherwise labeled). Each value represents the mean and SEM (N = 4 or 5). Unpaired two-sided t test. *, P < 0.05; **, P < 0.01; ***, P < 0.001.
Figure 6.
MTX-13 prevents metastasis in vivo in an orthotopic colon cancer xenograft model. A, Scheme of orthotopic HCT116-luc xenograft model establishment, treatment regimen, and bioluminescence imaging schedule. B, PTK7 expression (IHC and flow cytometry) and tumor growth inhibition by bioluminescence measurement (photon/second). Data are presented as the mean ± SD (n = 5). C,In vivo whole-body bioluminescence imaging of anesthetized mice before the treatment (day 0), during treatment (day 21) and after treatment (day 39). D, Organ metastasis rate as calculated by the percentage of metastasis of mouse in the whole group (n = 5). Mice are sacrificed on day 39 to obtain specific organs for ex vivo bioluminescence. E, Representative imaging of metastatic sites. Ex vivo bioluminescence imaging of primary colorectal tumor (with cecum) and metastasis organs from representative mouse of each group. Mice were intravenously administrated with two doses of vehicle (indicated by red arrows), isotype control ADCs and PTK7-targeted ADCs (10 mg/kg for MTX-13 and 5 mg/kg for h6M24-vc0101 unless otherwise labeled). Each value represents the mean and SEM (N = 4 or 5). Unpaired two-sided t test. *, P < 0.05; **, P < 0.01; ***, P < 0.001.

References

    1. Niehrs C. The complex world of WNT receptor signalling. Nat Rev Mol Cell Biol 2012;13:767–79. - PubMed
    1. Raivola J, Dini A, Salokas K, Karvonen H, Niininen W, Piki E, et al. New insights into the molecular mechanisms of ROR1, ROR2, and PTK7 signaling from the proteomics and pharmacological modulation of ROR1 interactome. Cell Mol Life Sci 2022;79:276. - PMC - PubMed
    1. Karvonen H, Perttila R, Niininen W, Barker H, Ungureanu D. Targeting Wnt signaling pseudokinases in hematological cancers. Eur J Haematol 2018;101:457–65. - PubMed
    1. Tian X, Yan L, Zhang D, Guan X, Dong B, Zhao M, et al. PTK7 overexpression in colorectal tumors: clinicopathological correlation and prognosis relevance. Oncol Rep 2016;36:1829–36. - PMC - PubMed
    1. Ataseven B, Angerer R, Kates R, Gunesch A, Knyazev P, Hogel B, et al. PTK7 expression in triple-negative breast cancer. Anticancer Res 2013;33:3759–63. - PubMed

Publication types

MeSH terms