. 2023 Aug:88:102864.
doi: 10.1016/j.media.2023.102864. Epub 2023 Jun 8.

Cross Atlas Remapping via Optimal Transport (CAROT): Creating connectomes for different atlases when raw data is not available

Affiliations

Cross Atlas Remapping via Optimal Transport (CAROT): Creating connectomes for different atlases when raw data is not available

Javid Dadashkarimi et al. Med Image Anal. 2023 Aug.

Abstract

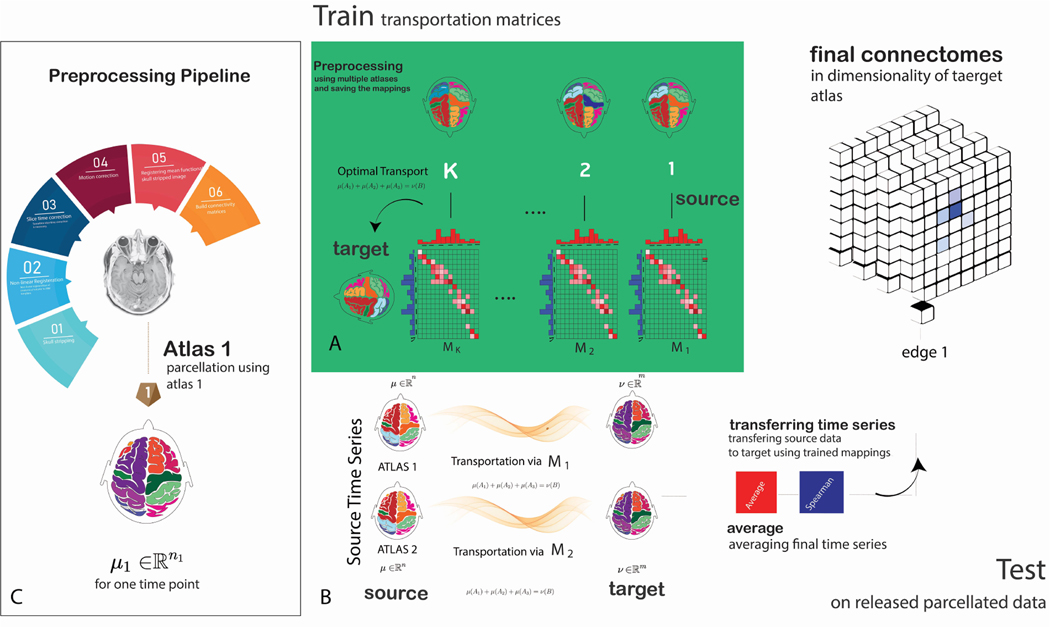
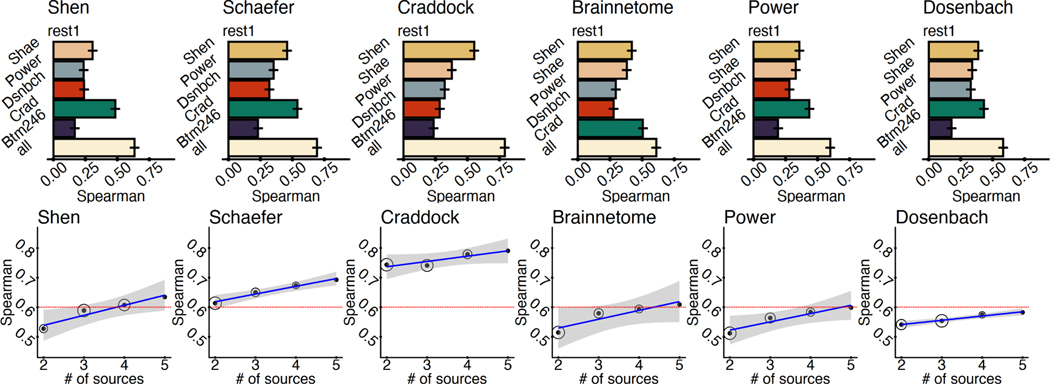
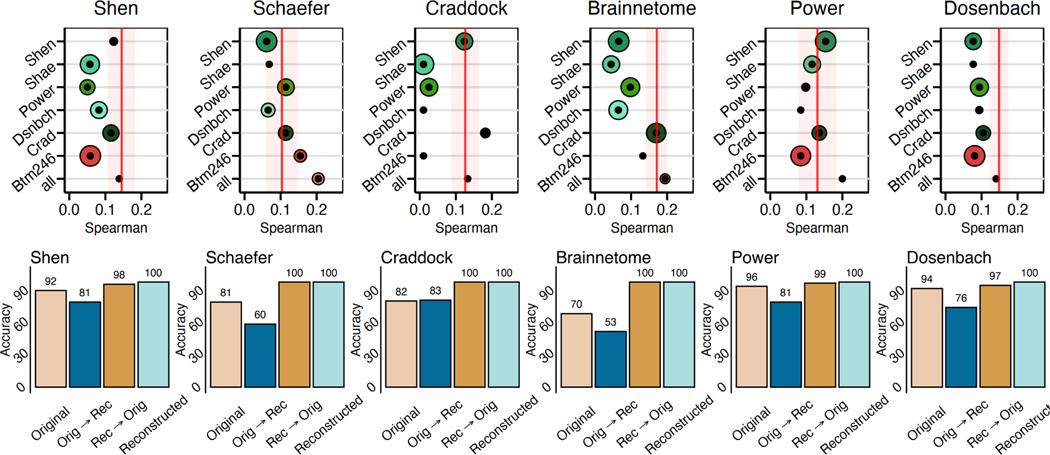
Open-source, publicly available neuroimaging datasets - whether from large-scale data collection efforts or pooled from multiple smaller studies - offer unprecedented sample sizes and promote generalization efforts. Releasing data can democratize science, increase the replicability of findings, and lead to discoveries. Partly due to patient privacy, computational, and data storage concerns, researchers typically release preprocessed data with the voxelwise time series parcellated into a map of predefined regions, known as an atlas. However, releasing preprocessed data also limits the choices available to the end-user. This is especially true for connectomics, as connectomes created from different atlases are not directly comparable. Since there exist several atlases with no gold standards, it is unrealistic to have processed, open-source data available from all atlases. Together, these limitations directly inhibit the potential benefits of open-source neuroimaging data. To address these limitations, we introduce Cross Atlas Remapping via Optimal Transport (CAROT) to find a mapping between two atlases. This approach allows data processed from one atlas to be directly transformed into a connectome based on another atlas without the need for raw data access. To validate CAROT, we compare reconstructed connectomes against their original counterparts (i.e., connectomes generated directly from an atlas), demonstrate the utility of transformed connectomes in downstream analyses, and show how a connectome-based predictive model can generalize to publicly available data that was processed with different atlases. Overall, CAROT can reconstruct connectomes from an extensive set of atlases - without needing the raw data - allowing already processed connectomes to be easily reused in a wide range of analyses while eliminating redundant processing efforts. We share this tool as both source code and as a stand-alone web application (http://carotproject.com/).

Keywords: Brain-behavior associations; Dataset harmonization; Functional connectivity; Optimal transport.


Conflict of interest statement

Declaration of Competing Interest The authors declare that they have no known competing financial interests or personal relationships that could have appeared to influence the work reported in this paper.

Figures

Fig. 1:
Fig. 1:
Schematic of CAROT: A) During training, CAROT transforms time series fMRI data from multiple source atlases to a target atlas to obtain transportation mappings. Mappings between the source and target atlases are found by employing optimal transport and solving Monge–Kantorovich transportation problem using the Sinkhorn approximation. The solution provides a transformation that maps the brain activity parcellated using the source atlas to brain activity parcellated based on the target atlas. B) During testing, for each pair of source and target atlases and a single time point in the time series data, the offline solutions are used, and time series and functional connectomes accordingly will be reconstructed in the desired target atlas. Results from several pairs of source and target atlases can be combined to improve the quality of the final reconstructed connectome. C) A standard image preprocessing pipeline to create functional connectomes.
Fig. 2:
Fig. 2:
Using multiple source atlases improves the similarity of reconstructed connectomes. A) The Spearman’s rank correlation between the reconstructed connectomes and connectomes generated directly with the target atlases are shown for each pair of source and target atlas as well as reconstructed connectomes using all of the source atlases. Using all source atlases produces higher-quality reconstructed connectomes for each target atlas. Error bars are generated from 100 iterations of randomly splitting the data into 25% for training and 75% for testing. B) For each target atlas, increasing the source atlases increases the similarity of reconstructed and original connectomes. For most atlases, a Spearman’s correlation of ρ>0.60 (red line) can be achieved by using fewer than five source atlases (i.e., all available source atlases). Circle size represents the variability of the correlation over 100 iterations of splitting the data into training and testing sets.
Fig. 3:
Fig. 3:
Reconstructed connectomes give similar aging results as the original connectomes. The top row shows the nodes with the largest number of edges significantly associated with age for original connectomes from the HCP created with the Shen atlas. The bottom row shows the same but using reconstructed Shen connectomes. These spatial maps correlate at r=0.61, suggesting that analyses with the reconstructed connectomes produce comparable neuroscientific insights as analyses with the original connectomes.
Fig. 4:
Fig. 4:
Reconstructed connectomes behave the same as original connectomes in downstream analyses. A) The reconstructed connectomes retain sufficient individual differences to predict IQ using connectome-based predictive modeling. In all cases, reconstructed connectomes based on all available source atlases (bottom circle) predicted IQ with a similar or better correlation between the observed and predicted values than the original connectome (red line). Size of the circle represents the variance of prediction performance of 100 iterations of 10-fold cross-validation. B) The reconstructed connectomes retain sufficient individual uniqueness to identify individuals using the reconstructed connectomes.

References

    1. Altschuler J, Weed J, Rigollet P, 2017. Near-linear time approximation algorithms for optimal transport via sinkhorn iteration. arXiv preprint arXiv:1705.09634.
    1. Arslan S, Ktena SI, Makropoulos A, Robinson EC, Rueckert D, Parisot S, 2018. Human brain mapping: A systematic comparison of parcellation methods for the human cerebral cortex. NeuroImage 170, 5–30. doi:10.1016/j.neuroimage.2017.04.014. segmenting the Brain. - DOI - PubMed
    1. Bassett DS, Bullmore E, 2006. Small-world brain networks. The Neuroscientist 12, 512–523. - PubMed
    1. Beaty RE, Kenett YN, Christensen AP, Rosenberg MD, Benedek M, Chen Q, Fink A, Qiu J, Kwapil TR, Kane MJ, et al., 2018. Robust prediction of individual creative ability from brain functional connectivity. Proceedings of the National Academy of Sciences 115, 1087–1092. - PMC - PubMed
    1. Bertsimas D, Tsitsiklis J,. Introduction to linear optimization, athena scientific, 1997.

Publication types

LinkOut - more resources