. 2023 Jun 22;186(13):2839-2852.e21.
doi: 10.1016/j.cell.2023.05.037.

Strain dropouts reveal interactions that govern the metabolic output of the gut microbiome

Affiliations

Strain dropouts reveal interactions that govern the metabolic output of the gut microbiome

Min Wang et al. Cell. .

Abstract

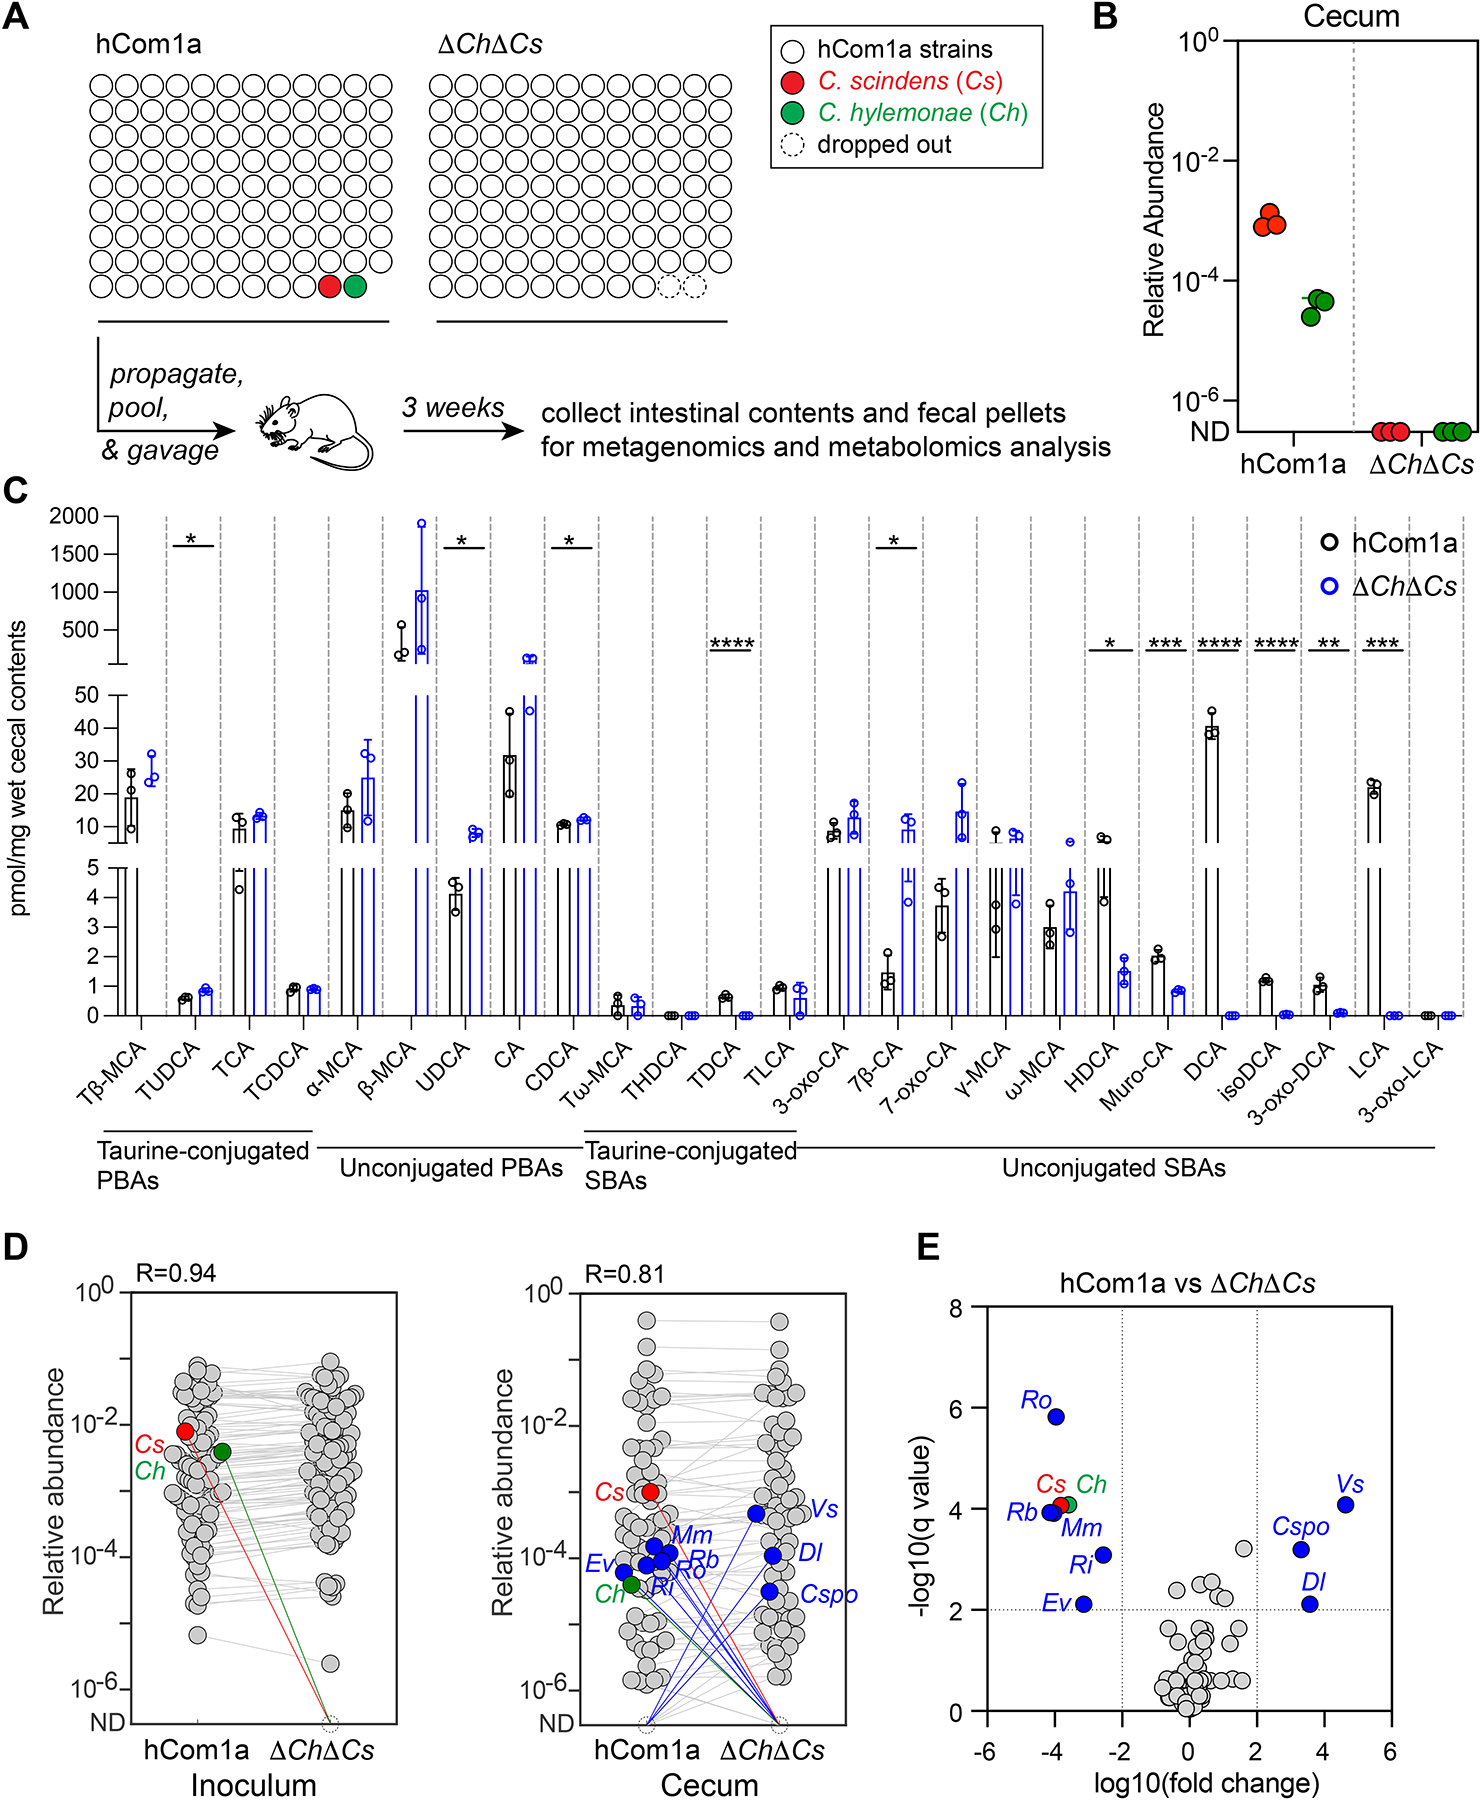
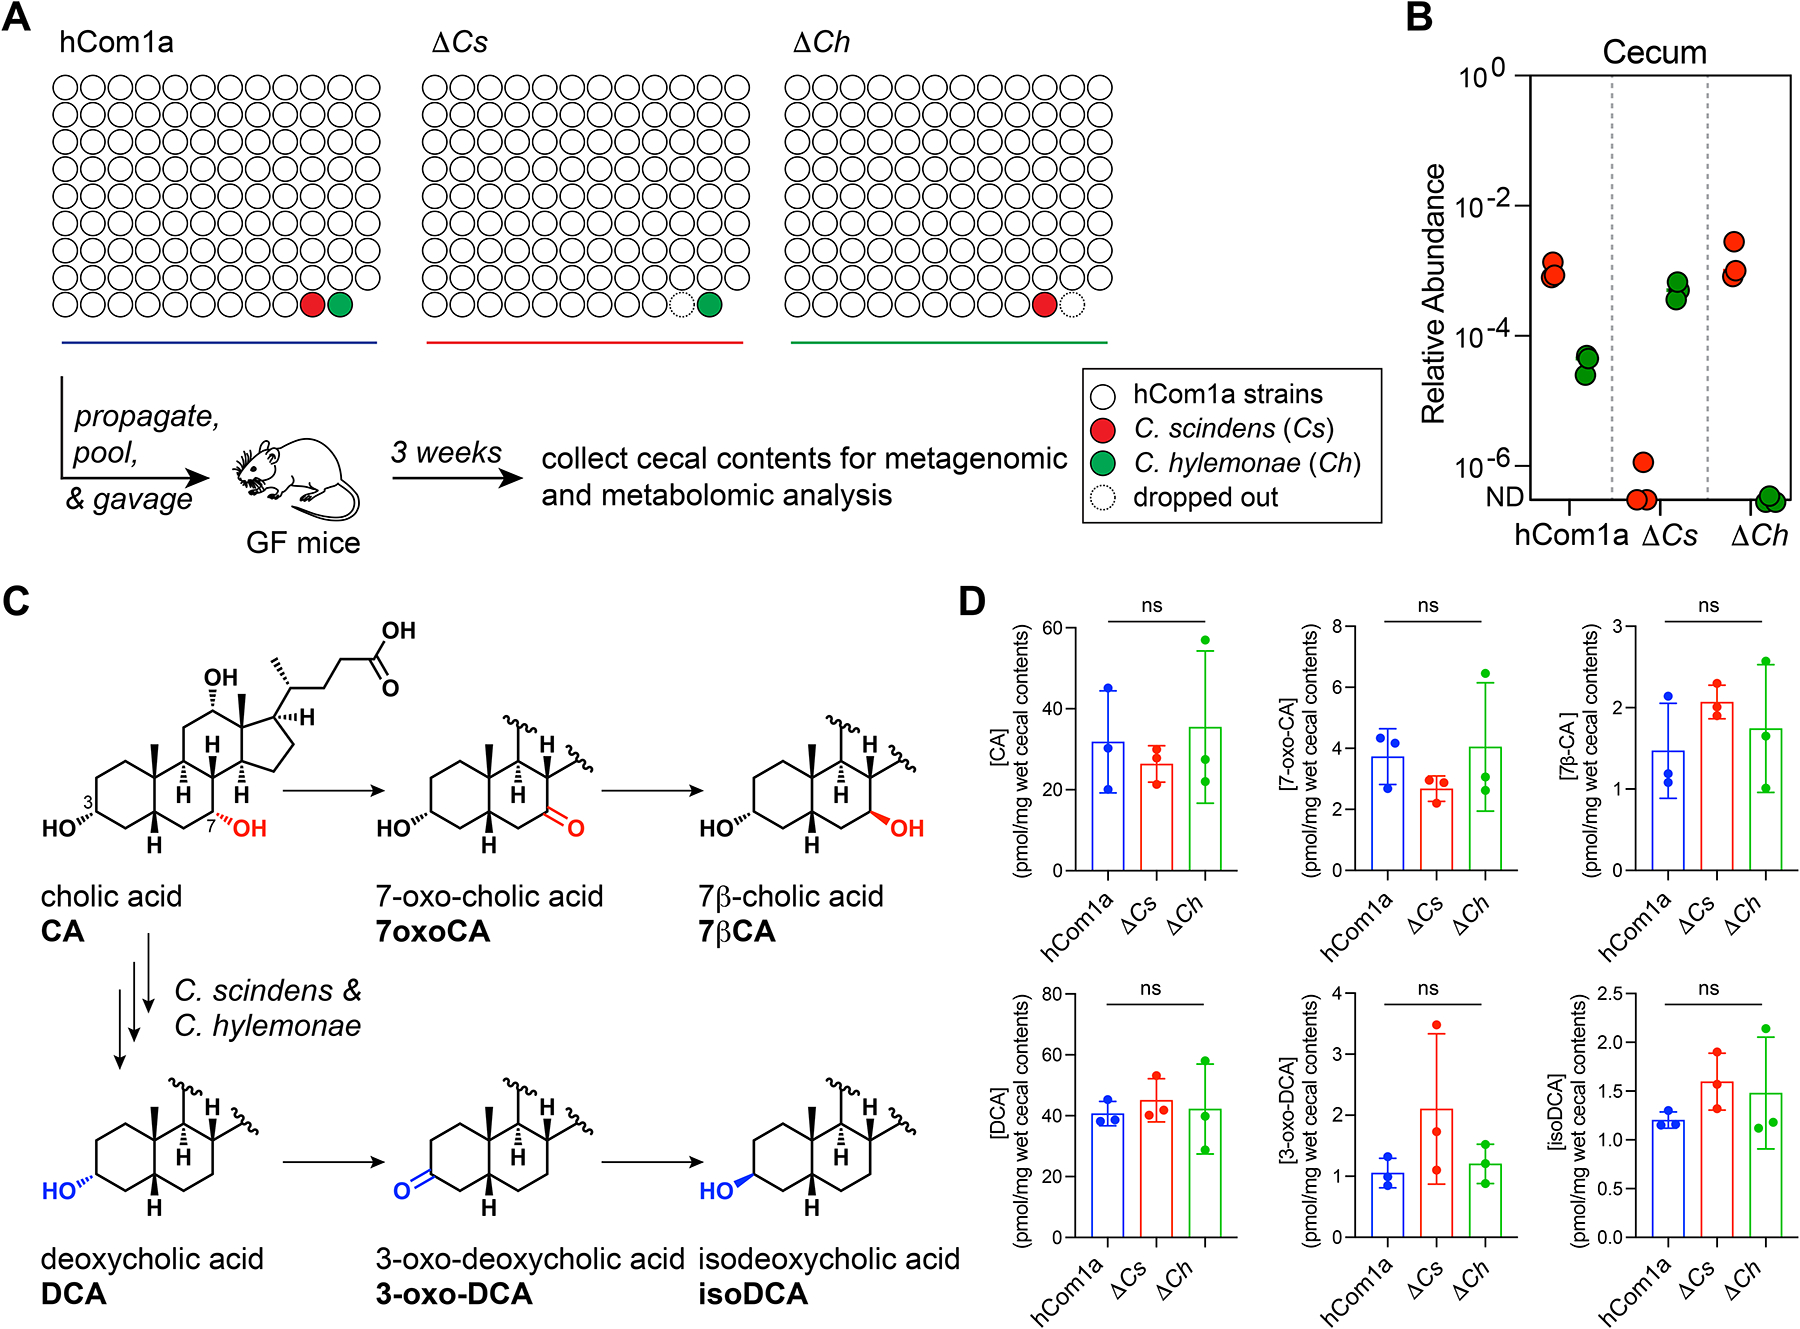
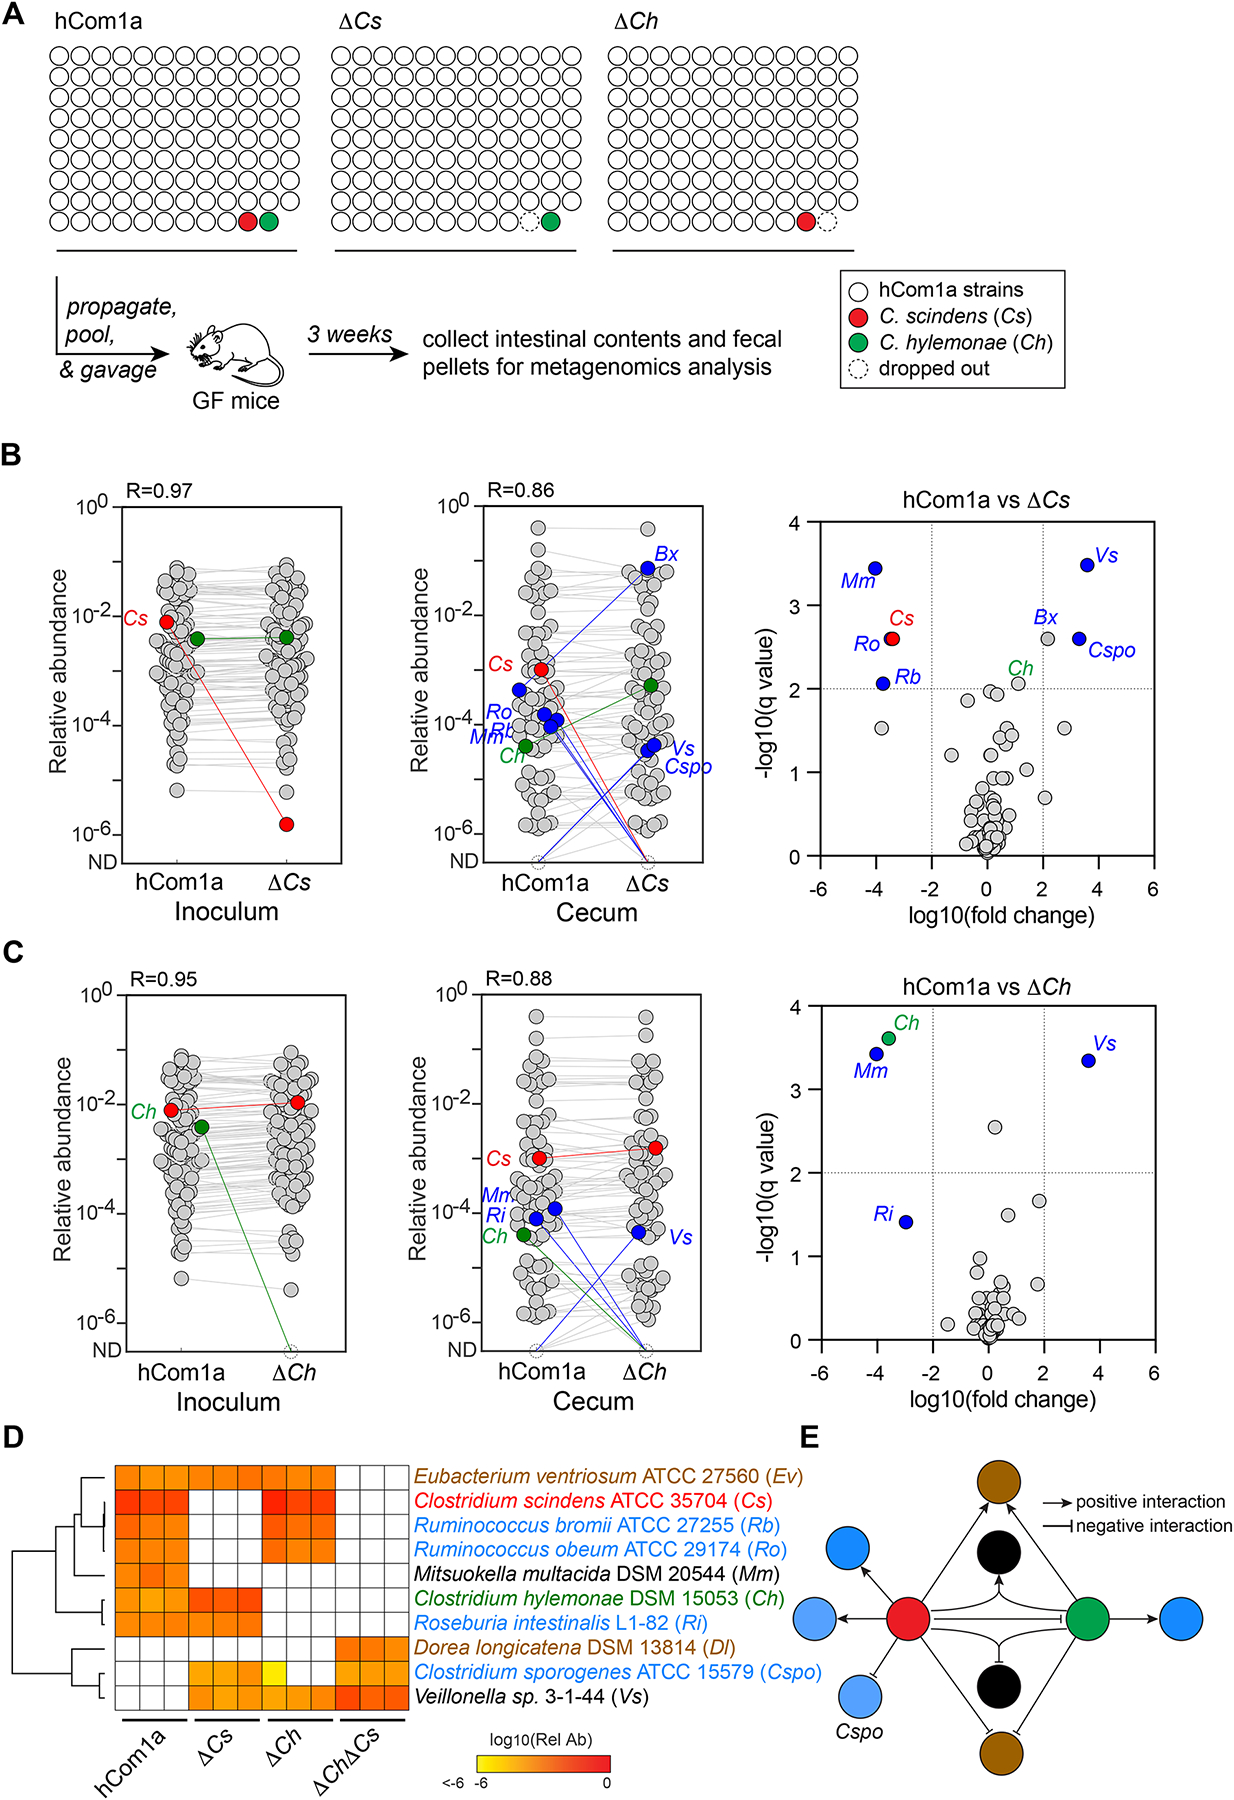
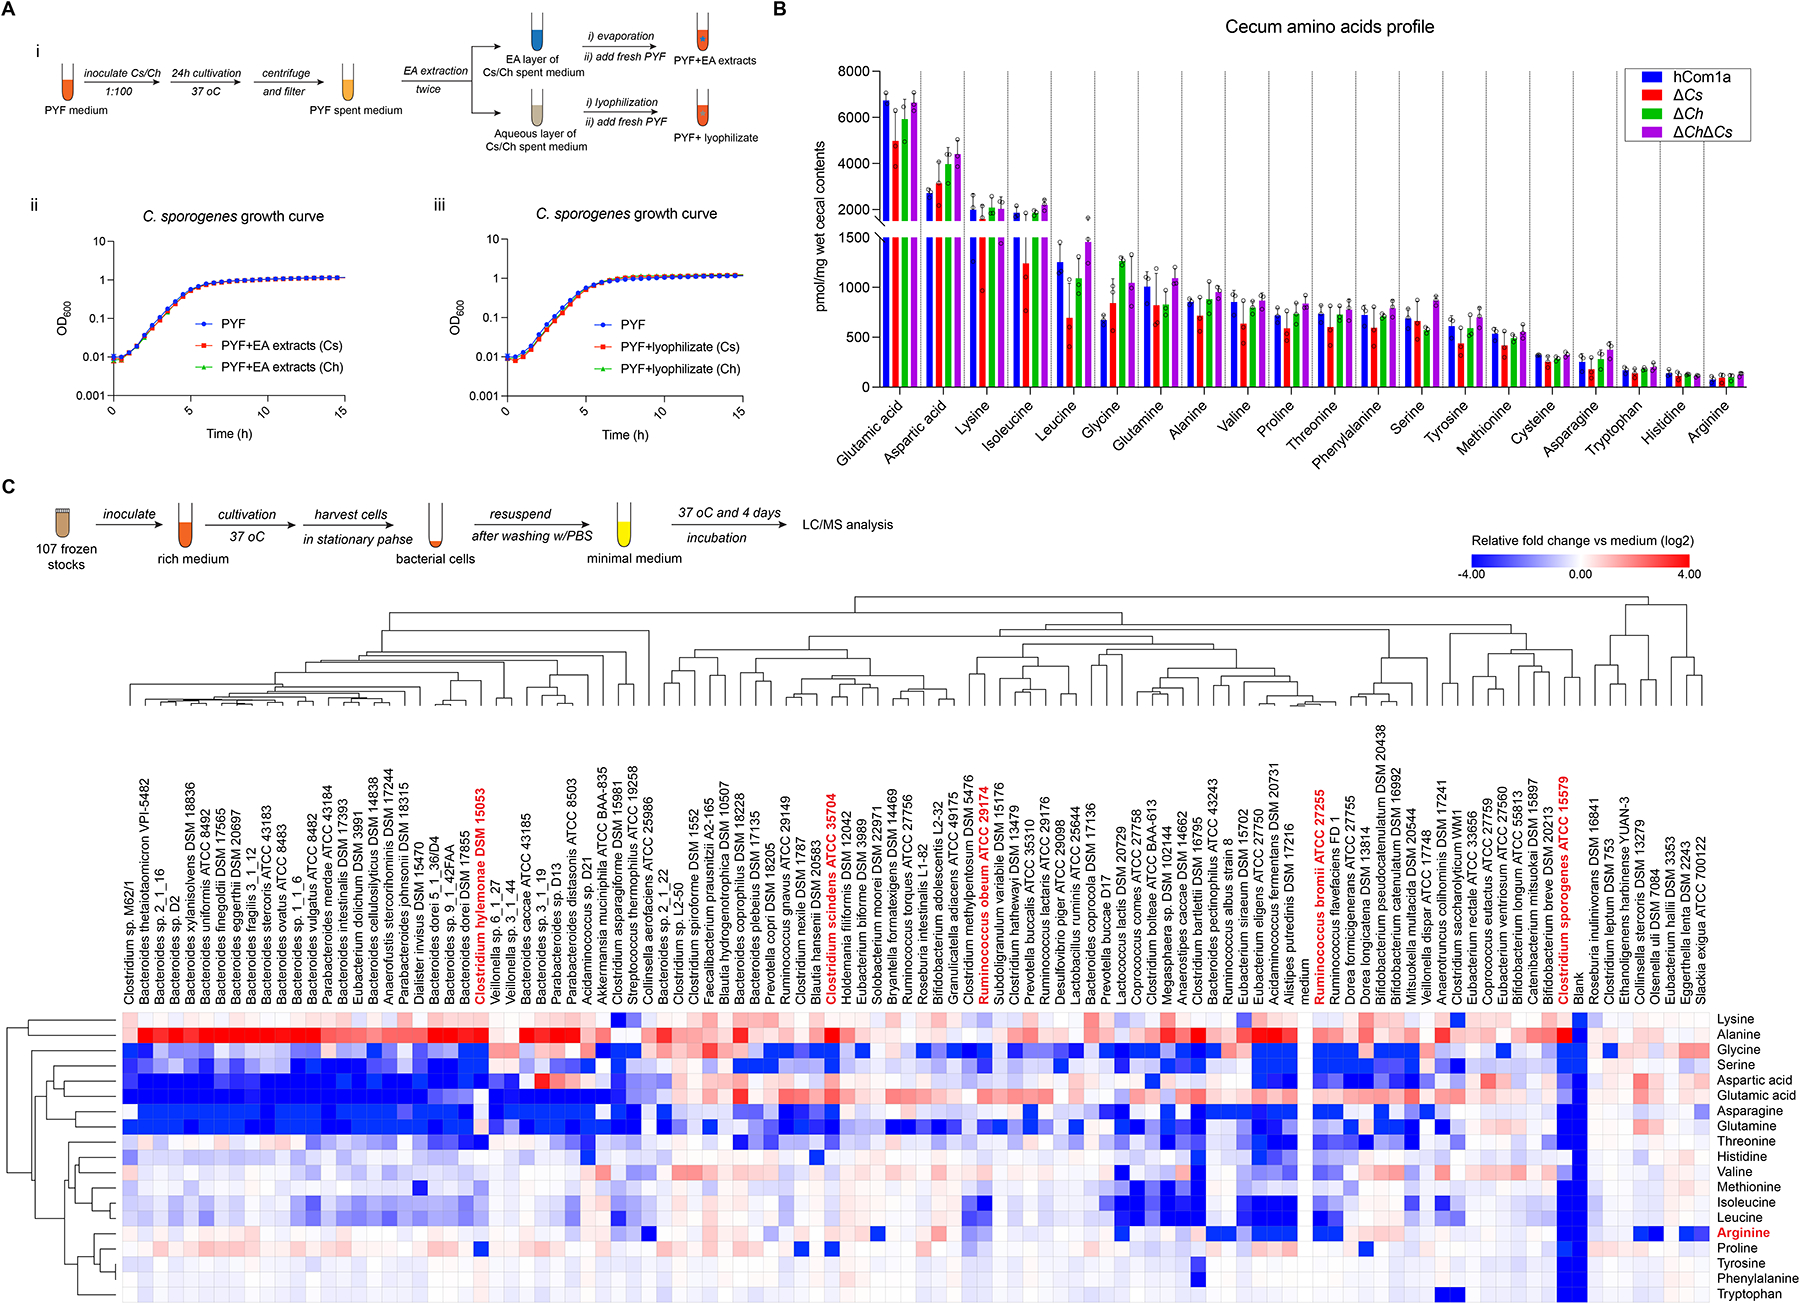
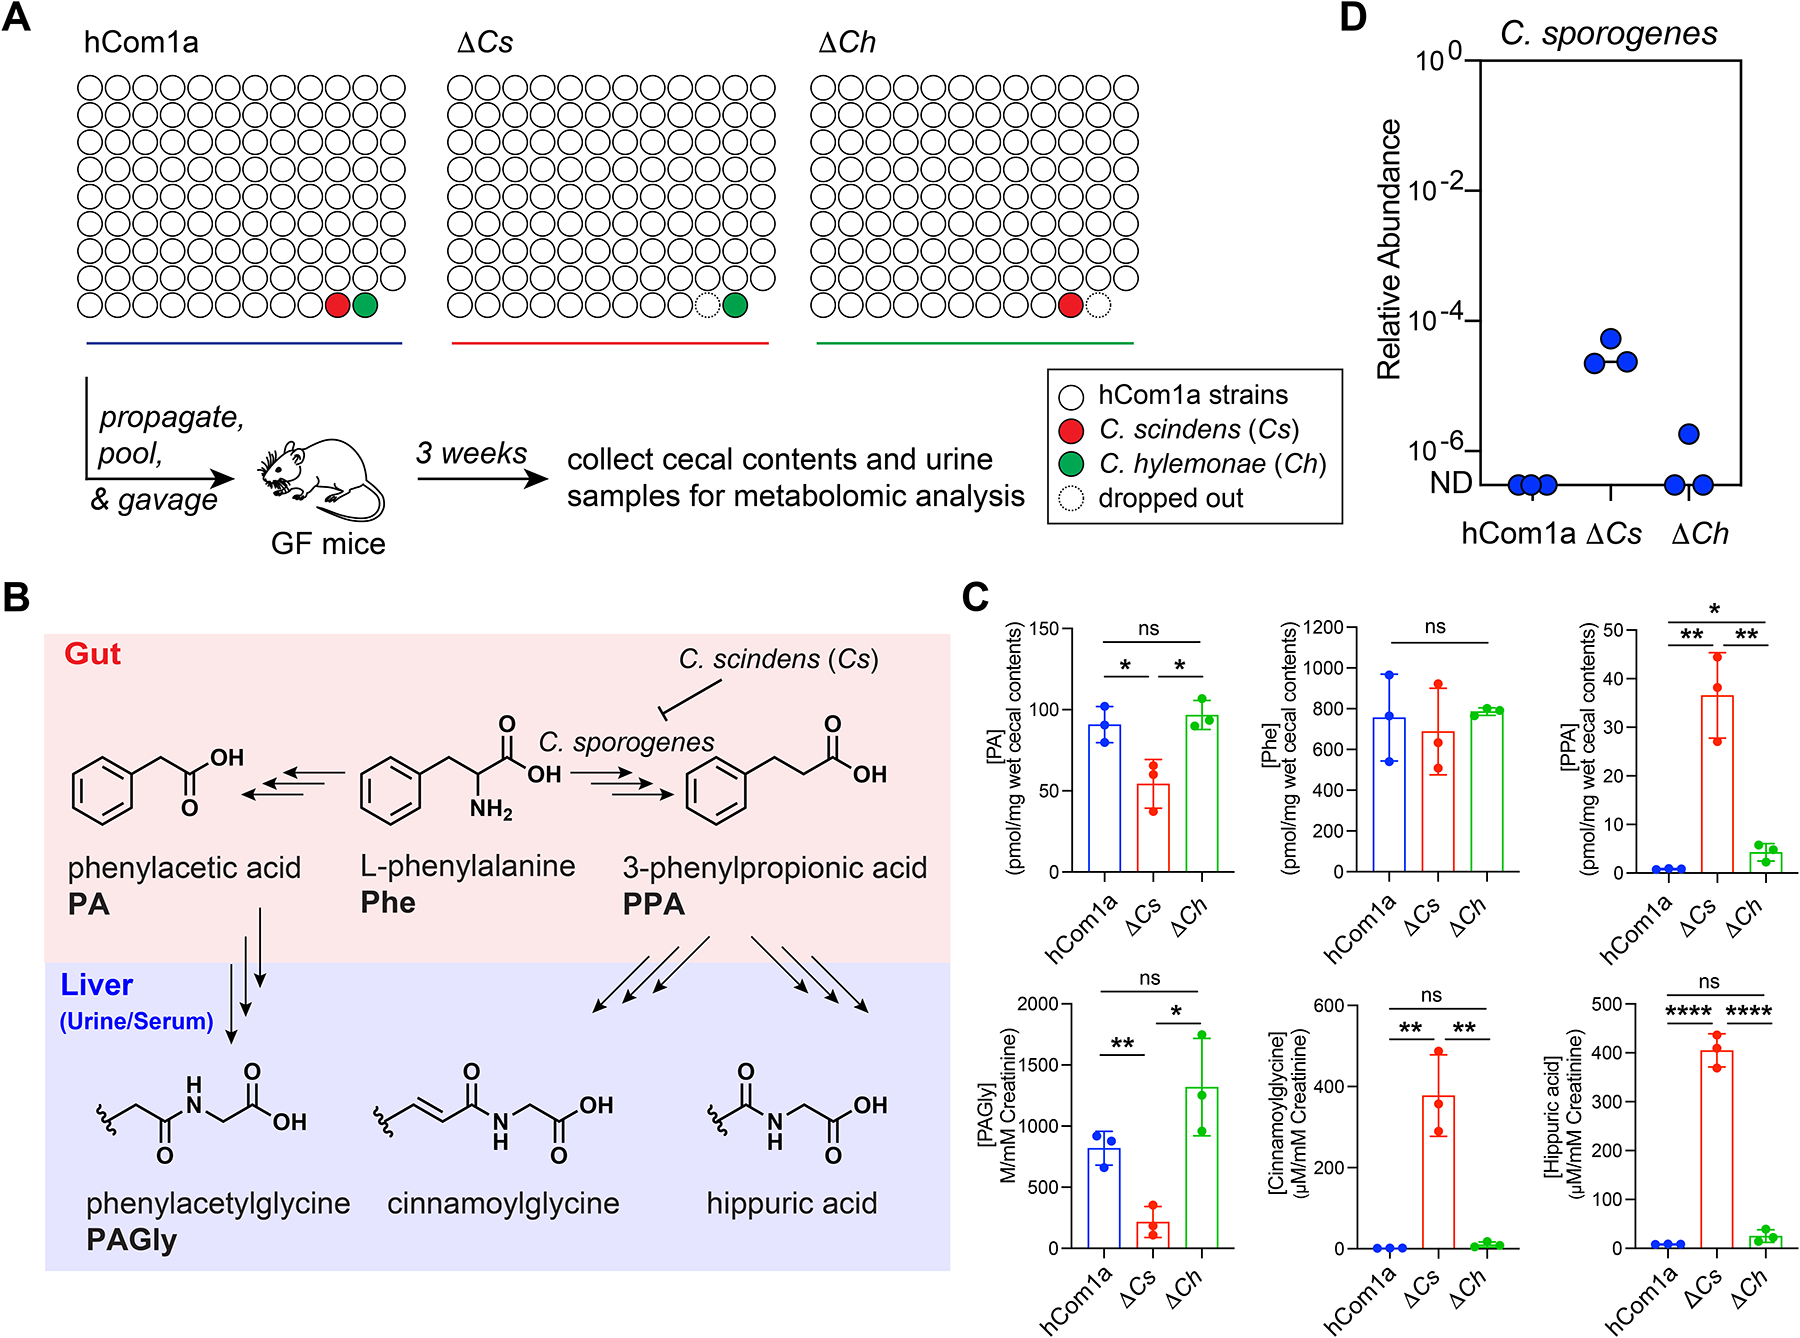
The gut microbiome is complex, raising questions about the role of individual strains in the community. Here, we address this question by constructing variants of a complex defined community in which we eliminate strains that occupy the bile acid 7α-dehydroxylation niche. Omitting Clostridium scindens (Cs) and Clostridium hylemonae (Ch) eliminates secondary bile acid production and reshapes the community in a highly specific manner: eight strains change in relative abundance by >100-fold. In single-strain dropout communities, Cs and Ch reach the same relative abundance and dehydroxylate bile acids to a similar extent. However, Clostridium sporogenes increases >1,000-fold in the ΔCs but not ΔCh dropout, reshaping the pool of microbiome-derived phenylalanine metabolites. Thus, strains that are functionally redundant within a niche can have widely varying impacts outside the niche, and a strain swap can ripple through the community in an unpredictable manner, resulting in a large impact on an unrelated community-level phenotype.

Keywords: ecology; metabolism; microbiome.


Conflict of interest statement

Declaration of interests Stanford University and the Chan Zuckerberg Biohub have patents pending for microbiome technologies on which the authors are co-inventors. M.A.F. is a co-founder and director of Federation Bio and Kelonia, a co-founder of Revolution Medicines, an Innovation Partner at the Column Group, and a member of the scientific advisory board of NGM Bio.

Figures

Figure 1:
Figure 1:. Colonizing germ-free C57BL/6N mice with a complex gut bacterial community (hCom1a).
(A) Schematic of the experiment. Frozen stocks of the 107 strains were used to inoculate cultures that were sub-cultured every 24 h and then pooled after three days. The mixed culture was used to colonize germ-free C57BL/6N mice (n=3–5 mice per replicate) by oral gavage. After four weeks of colonization, mice fed ad libitum on chow diet were sacrificed and intestinal contents were collected, subjected to metagenomic sequencing, and analyzed by NinjaMap to measure the composition of the community. (B) The architecture of hCom1a in the cecum is highly reproducible. Left: community composition is highly similar across three biological replicates. Each dot is an individual strain; the collection of dots in a column represents the community at 4 weeks averaged over multiple mice receiving the same inoculum. Strains are colored according to their average rank-order relative abundance across all samples. Right: Pearson’s pairwise correlation coefficients for technical and biological replicates. The log10(relative abundance) values of all strains were used to calculate the Pearson correlation coefficient (R). For strains not detected, the relative abundance was set as 1e-8. (C) Averaged relative abundances of the inoculum versus the communities at week 4. Strains in the community span >6 orders of magnitude of relative abundance when colonizing the mouse gut. Dots are colored by phylum according to the legend in panel D. (D) Relative abundances for most strains are tightly distributed. Each column depicts the relative abundance of an individual strain across all samples at week 4. See also Figure S1 and S7, and Table S1 and S2.
Figure 2:
Figure 2:. The 7α-dehydroxylation niche in hCom1a is composed of Clostridium scindens (Cs) and Clostridium hylemonae (Ch).
(A) A multigeneblast search of the 107 genomes in hCom1a shows that only Clostridium scindens and Clostridium hylemonae harbor the bai operon, which encodes the bile acid 7α-dehydroxylation pathway. (B) A simplified schematic showing the dehydroxylation of cholic acid (CA) to deoxycholic acid (DCA). (C) Combined extracted ion chromatogram showing that hCom1a converts CA to DCA in vitro, whereas the two-strain dropout community ΔChΔCs does not. Constituent strains were cultured separately, pooled, and subcultured (1:100) in Mega medium containing 100 μM cholic acid for 72 h. Culture supernatants were collected and analyzed by LC-MS. (D) Clostridium scindens and Clostridium hylemonae typically co-colonize the human gut. Each dot indicates one of the 81 gut metagenomic samples from the NIH HMP, and the relative abundance of Cs and Ch are indicated in the x axis and y-axis, respectively. See also Table S1.
Figure 3:
Figure 3:. Metabolic and ecological impacts of removing strains in the 7α-dehydroxylation niche.
(A) Schematic of the experiment. Germ-free C57BL/6 mice (n=3 per group) were colonized with hCom1a or ΔChΔCs and housed for 3 weeks before sacrifice. Fecal pellets and intestinal contents were subjected to metagenomic analysis or targeted metabolite profiling. (B) Cs and Ch are undetectable in ΔChΔCs-colonized mice. Relative abundances were calculated through a high-resolution metagenomic analysis of the inoculum and cecal communities. (C) Secondary bile acids are eliminated in ΔChΔCs-colonized mice. Bile acids were quantified in cecal contents by targeted LC-MS-based profiling. Statistical significance was assessed using a Student’s two-tailed t-test (*: p<0.05; **: p<0.01; ***: p<0.001; ****: p<0.0001). PBAs: primary bile acids; SBAs: secondary bile acids. (D) Average relative abundances of the inoculum (left) versus the cecal communities at week 3 (right). Each dot is an individual strain; the collection of dots in a column represents the community averaged over 3 mice co-housed in one cage. Cs and Ch are highlighted in red and green, respectively. Strains highlighted in blue went up or down in relative abundance between hCom1a-colonized and ΔChΔCs-colonized mice (FDR < 0.01, fold change > 100). (E) Volcano plot of differential strain relative abundance. The log10(fold change) values of each strain are shown; relative abundances were set at 10−8 for strains not detected. Relative abundances were analyzed using a multiple unpaired t test, corrected with FDR (Q<1%). Strains discovered with significantly different relative abundance (FDR<0.01, fold change >100) are colored blue; the full names of the blue strains can be found in Figures 5D. See also Figure S2, and Table S3 and S4.
Figure 4:
Figure 4:. Compensation and functional redundancy within the 7α-dehydroxylation niche.
(A) Schematic of the experiment. Germ-free C57BL/6 mice (n=3 per group) were colonized with hCom1a, ΔCs, or ΔCh and housed for 3 weeks before sacrifice. Cecal contents were subjected to metagenomic and targeted metabolomic profiling. (B) Compensation within the 7α-dehydroxylation niche keeps the total relative abundance of its residents similar. Relative abundances of Cs and Ch in cecal contents from hCom1a-, ΔCh-, and ΔCs-colonized mice are shown. (C) Metabolic pathways for bile acid transformation by the gut microbiota. (D) The bile acid pools of mice colonized by hCom1a, ΔCh, and ΔCs are comparable. Thus, in the context of a complete community, Ch and Cs can carry out the core function of the niche—the conversion of primary to secondary bile acids—on its own. See also Figure S3 and S5, and Table S3 and S4.
Figure 5:
Figure 5:. Single-strain dropouts reveal complex interactions among Cs, Ch, and interacting strains.
(A) Schematic of the experiment. Germ-free C57BL/6 mice (n=3 per group) were colonized with hCom1a, ΔCs, or ΔCh and housed for 3 weeks before sacrifice. Fecal pellets and intestinal contents were subjected to metagenomic analysis. (B-C) While most strains remain unchanged when dropping out Cs or Ch, a small number of strains change in relative abundance >100-fold. Left: Metagenomic analysis showing that Cs and Ch are absent in the ΔCs and ΔCh community inocula, respectively. Middle: Dropping out Cs or Ch impacts the relative abundance of five or three strains in the ΔCs and ΔCh communities, respectively. Each dot is an individual strain; the collection of dots in a column represents the community averaged over three mice co-housed in one cage. Cs and Ch are highlighted in red and green. Strains colored blue went up or down in relative abundance between hCom1a-colonized and ΔCs or ΔCh-colonized mice (FDR<0.01, fold change >100). Right: Volcano plot showing the log10(fold change) values for each strain; for strains that were not detected, relative abundances were set at 10−8. Strains with significantly different relative abundance (FDR <0.01, fold change >102) are colored blue; the full names of these strains are shown next to the heatmap in (D). The change in the relative abundance of Bacteroides xylanisolvens DSM 18836 (Bx) was close to the cutoff in ΔCs but not the other communities; this strain is not further discussed. (D) Heatmap representing the 8-strain interaction network around Cs and Ch. The relative abundance of each strain is shown in three mice colonized by hCom1a, ΔCs, ΔCh, or ΔChΔCs. Strains with relative abundance <10−6 are colored white. (E) Schematic of the interaction network. Strains are linked to the 7α-dehydroxylation niche in one of three ways: 1) Some strains are specific to Cs (Rb, Ro, and Cspo) or Ch (Ri); these interactions are presumably strain-specific and unrelated to bile acids. 2) Ev and Dl only respond to the double-strain dropout, indicating a mechanism related to secondary bile acid production. 3) The remaining strains, Mm and Vs, respond when either or both strains are missing, suggesting a requirement for the simultaneous presence of Cs and Ch. See also Figure S2 and S5, and Table S3.
Figure 6:
Figure 6:. Investigating the mechanism of the interaction between Cs and Cspo.
(A) No diffusible antimicrobial metabolites are found in the culture fluid of C. scindens (Cs) or C. hylemonae (Ch). (i) Schematic of preparing EA extracts and lyophilizate from the spent medium of Cs and Ch cultures. (ii) Growth curves of Cspo in fresh PYF medium without or with the EA extracts or lyophilizate from the spent medium of Cs or Ch. (B) Targeted profiling of amino acids in the cecum of hCom1a-, ΔCs-, ΔCh- and ΔChΔCs- colonized mice by LC-MS. (C) Targeted profiling of amino acid depletion by hCom1a strains in vitro. (Top) schematic of the experiment. (Bottom) heatmap of amino acid depletion by hCom1a strains, clustered by one minus pearson correlation. The abundance of each amino acid was normalized to the bacteria-free control (medium); in the log2 transformed data, red indicates an increased concentration while blue means the concentration has decrease. The data represent one of two independent experiments. See also Figure S6.
Figure 7:
Figure 7:. An unexpected impact of Cs on aromatic amino acid metabolism.
(A) Schematic of the experiment. Germ-free C57BL/6 mice (n=3 per group) were colonized with hCom1a or its single-strain dropout variant (ΔCs and ΔCh) and housed for 3 weeks before sacrifice. Fecal pellets, cecal contents, and urine samples were subjected to targeted metabolite profiling. (B) Certain gut bacteria can reduce phenylalanine (Phe) to phenylpropionic acid (PPA), which is converted to hippuric acid and cinnamoylglycine by the host. Other gut bacteria oxidize Phe to phenylacetic acid (PA), which is metabolized in the liver to phenylacetylglycine (PAGly). (C) ΔCs differs markedly from hCom1a and ΔCh in terms of AAA metabolite output. hCom1a and ΔCh convert phenylalanine almost exclusively to PA (from which the host generates PAGly); hippurate is nearly undetectable in the urine and serum (Figure S3). In contrast, ΔCs converts Phe predominantly to phenylpropionic acid (which the host metabolizes to hippurate); PAGly levels are very low in the urine and serum (Figure S3). (D) C. sporogenes, which is undetectable in hCom1a- and ΔCh-colonized mice, rises to a relative abundance of 10−5-10−4 in ΔCs-colonized mice. The relative abundance of Cspo in cecal contents from hCom1a-, ΔCs-, and ΔCh-colonized mice is shown. Statistical significance was assessed using a Student’s two tailed t-test (*: p<0.05; **: p<0.01; ***: p<0.001; ****: p<0.0001, n.s: no significance). See also Figure S2, S3, and S5, and Table S4.

References

    1. Samuel BS, and Gordon JI (2006). A humanized gnotobiotic mouse model of host-archaeal-bacterial mutualism. Proc. Natl. Acad. Sci 103, 10011–10016. 10.1073/pnas.0602187103. - DOI - PMC - PubMed
    1. Mahowald MA, Rey FE, Seedorf H, Turnbaugh PJ, Fulton RS, Wollam A, Shah N, Wang C, Magrini V, Wilson RK, et al. (2009). Characterizing a model human gut microbiota composed of members of its two dominant bacterial phyla. Proc. Natl. Acad. Sci 106, 5859–5864. 10.1073/pnas.0901529106. - DOI - PMC - PubMed
    1. Rey FE, Faith JJ, Bain J, Muehlbauer MJ, Stevens RD, Newgard CB, and Gordon JI (2010). Dissecting the in Vivo Metabolic Potential of Two Human Gut Acetogens. J. Biol. Chem 285, 22082–22090. 10.1074/jbc.M110.117713. - DOI - PMC - PubMed
    1. Buffie CG, Bucci V, Stein RR, McKenney PT, Ling L, Gobourne A, No D, Liu H, Kinnebrew M, Viale A, et al. (2014). Precision microbiome reconstitution restores bile acid mediated resistance to Clostridium difficile. Nature 517, 205–208. 10.1038/nature13828. - DOI - PMC - PubMed
    1. Studer N, Desharnais L, Beutler M, Brugiroux S, Terrazos MA, Menin L, Schürch CM, McCoy KD, Kuehne SA, Minton NP, et al. (2016). Functional Intestinal Bile Acid 7α-Dehydroxylation by Clostridium scindens Associated with Protection from Clostridium difficile Infection in a Gnotobiotic Mouse Model. Front. Cell. Infect. Microbiol 6, 1–15. 10.3389/fcimb.2016.00191. - DOI - PMC - PubMed

Publication types

Substances

Supplementary concepts

LinkOut - more resources