. 2023 Jul 6;186(14):3013-3032.e22.
doi: 10.1016/j.cell.2023.05.039. Epub 2023 Jun 22.

Cooperative sensing of mitochondrial DNA by ZBP1 and cGAS promotes cardiotoxicity

Affiliations

Cooperative sensing of mitochondrial DNA by ZBP1 and cGAS promotes cardiotoxicity

Yuanjiu Lei et al. Cell. .

Abstract

Mitochondrial DNA (mtDNA) is a potent agonist of the innate immune system; however, the exact immunostimulatory features of mtDNA and the kinetics of detection by cytosolic nucleic acid sensors remain poorly defined. Here, we show that mitochondrial genome instability promotes Z-form DNA accumulation. Z-DNA binding protein 1 (ZBP1) stabilizes Z-form mtDNA and nucleates a cytosolic complex containing cGAS, RIPK1, and RIPK3 to sustain STAT1 phosphorylation and type I interferon (IFN-I) signaling. Elevated Z-form mtDNA, ZBP1 expression, and IFN-I signaling are observed in cardiomyocytes after exposure to Doxorubicin, a first-line chemotherapeutic agent that induces frequent cardiotoxicity in cancer patients. Strikingly, mice lacking ZBP1 or IFN-I signaling are protected from Doxorubicin-induced cardiotoxicity. Our findings reveal ZBP1 as a cooperative partner for cGAS that sustains IFN-I responses to mitochondrial genome instability and highlight ZBP1 as a potential target in heart failure and other disorders where mtDNA stress contributes to interferon-related pathology.

Keywords: STING; Z-DNA; ZBP1; cGAS; cardiotoxicity; heart failure; mitochondrial DNA; type I interferon.


Conflict of interest statement

Declaration of interests The authors declare no competing interests.

Figures

Figure 1.
Figure 1.. ZBP1 sustains IFN-I responses to mitochondrial genome instability.
A, RNA-seq heatmaps of top 50 genes with the lowest p-values between WT and Tfam+/− genotypes. Fold changes (FC) are normalized to the average of WT MEFs. B, C, qRT-PCR analysis (B) and western blots (C) of ISGs in WT, Tfam+/−, Zbp1−/− and Tfam+/−Zbp1−/− MEFs. D, qRT-PCR analysis in ARPE-19 transfected with indicated siRNAs for 72 h. E, Schematic illustration of siRNA and plasmid transfection in 293FT-STING (left). qRT-PCR analysis in 293FT-STING transfected with indicated siRNAs and plasmids (0.25 μg/mL cGAS or ZBP1) (right). F, Representative microscopy images of WT MEFs transfected with siCtrl or siTop3a and stained with anti-pan-DNA and -HSP60 (Mito.) antibodies. Inset panels are magnified 4x. G, qRT-PCR analysis in WT, cGAS−/− and Zbp1−/− MEFs transfected with siCtrl or siTop3a for 96 h. H, qRT-PCR analysis in ARPE-19 transfected with indicated siRNAs for 72 h. I. qRT-PCR analysis in WT MEFs transfected with siCtrl or siTop3a with or without 2’,3’-dideoxycytidine (ddC, 100 μM) for 72 h. J, Representative confocal microscopy images of WT MEFs treated with vehicle (veh) or Doxorubicin (Doxo, 500 nM, 24 h) and stained with anti-pan-DNA and -HSP60 (Mito.) antibodies. Inset panels are magnified 4x. K, L, qRT-PCR analysis (K) and western blots (L) of ISGs in WT and Zbp1−/− MEFs treated with or without Doxo (50 nM, 48 h). M. Schematic illustration of plasmid transfection and Doxo treatment in 293FT-STING (left). qRT-PCR analysis in 293FT-STING transfected with indicated plasmids (0.4 μg/mL cGAS or 0.8 μg/mL ZBP1) and with or without Doxo (200 nM) treatment (right). Statistical significance was determined using analysis of variance (ANOVA) and Tukey post hoc test (A, D, E, G, H, I, L, M). *P < 0.05, **P < 0.01, and ***P < 0.001. Error bars represent SEM. See also Figure S1 and Table S1.
Figure 2.
Figure 2.. Mitochondrial genome instability promotes Z-form DNA accumulation that is stabilized by ZBP1.
A, Schematic illustration of circular Z-form and B-form DNA synthesis. B, Electrophoretic mobility shift assay (EMSA) measurement of binding of Z-DNA-specific antibody Z22 to B-DNA and Z-DNA. C, Representative images of WT MEFs transfected with indicated siRNAs for 72 h and stained with anti-Z-DNA and -TOMM20 (Mito.) antibodies. Inset panels are magnified 4x. D, Mean fluorescent intensity (MFI) quantification of cytosolic (Cyto.) and mitochondrial (Mito.) Z-DNA in WT and Zbp1−/− MEFs transfected with indicated siRNAs for 72 h. MFI percentiles are normalized to WT or Zbp1−/− MEFs transfected with siCtrl. E, F, Representative images of WT MEFs treated with veh or Doxo and stained with anti-Z-DNA and -TOMM20 antibodies (E). MFI of Cyto. and Mito. Z-DNA is quantified in (F). MFI percentiles are normalized to veh-treated WT MEFs. G, H, Representative images of ARPE-19 transfected with indicated siRNAs for 72 h and stained with anti-Z-DNA and -TOMM20 antibodies (G). Inset panels are magnified 4x. MFI of Cyto. and Mito. Z-DNA is quantified in (H). MFI percentiles are normalized to ARPE-19 transfected with siCTRL. I, qRT-PCR analysis of ISGs in WT and Zbp1−/− MEFs transfected with B-DNA or Z-DNA (125 ng/mL) for indicated time. Statistical significance was determined using ANOVA (D, I) and Tukey post hoc test (D), or unpaired t-test (F). *P < 0.05, **P < 0.01, and ***P < 0.001. Error bars represent SEM. See also Figure S2.
Figure 3.
Figure 3.. ZBP1 binds to cGAS in a DNA- and RHIM-dependent manner.
A, Representative images of COS-7 expressing indicated proteins and stained with anti-HA and -FLAG antibodies and DAPI (ev, empty vector). B, Endogenous cytosolic and nuclear co-immunoprecipitations (co-IP) in WT and Tfam+/− MEFs with or without mouse IFNβ (mIFNβ) treatment (10 ng/mL, 6 h). C, Cytosolic and nuclear co-immunoprecipitation in WT MEFs treated with or without Doxo (50 nM, 48 h). D, Schematic representation of mouse ZBP1 full-length (mZBP1 FL), truncations and mutants. E, co-IP showing interactions between mouse cGAS (mcGAS) and mZBP1 FL, truncations or mutants in 293FT. SE, short exposure; LE, long exposure. F, qPCR analysis of mt-Nd2 (left) or qRT-PCR analysis of mt-16s (right) in cell lysates from G. G, Endogenous co-IP in Tfam+/− MEFs with or without DNase I or RNase A treatment. H, Gel-filtration chromatography and SDS–PAGE analyses of recombinant mZBP1 protein. I, Schematic illustration of co-IP between recombinant mcGAS and mZBP1 with or without DNA (top). co-IP showing interactions between mcGAS and mZBP1 with or without Z-DNA or B-DNA (bottom). Densitometry of ZBP1 in cGAS immunoprecipitates is shown in graph (n = 4). J, co-IP showing interactions between mcGAS and mZBP1 FL and RHIMA + RHIMB fragment (RA+RB) in 293FT. K-M, Representative images of COS-7 expressing indicated proteins and stained with anti-HA and -FLAG antibodies and DAPI (K, M). Cytosolic cGAS-HA intensity is quantified in (L). AU, arbitrary unit. Statistical significance was determined using ANOVA and Tukey post hoc test (F, L). *P < 0.05, **P < 0.01, and ***P < 0.001. Error bars represent SEM. See also Figure S3.
Figure 4.
Figure 4.. RIPK1 and RIPK3 localize to the ZBP1-cGAS complex and sustain IFN-I signaling to mitochondrial genome instability.
A, Western blots of WT and Zbp1−/− MEFs transfected with siCtrl or siTfam for indicated time. B, Endogenous co-IP in WT and Tfam+/− MEFs. C, Endogenous co-IP in Tfam+/− MEFs transfected with indicated siRNAs for 48 h and Tfam+/−Zbp1−/− MEFs transfected with siCtrl for 48 h. D, E, Western blots (D) and qRT-PCR analysis (E) of WT and Tfam+/− MEFs transfected with indicated siRNAs for 72 h. F, G, Western blots (F) and qRT-PCR analysis (G) of WT and Tfam+/− MEFs treated with Necrostatin-1 (Nec-1, 10 μM) or GSK’872 (2.5 μM) for 48 h. H, Western blots of ARPE-19 transfected with indicated siRNAs for 72 h. I, qRT-PCR analysis in ARPE-19 transfected with siCTRL or siTFAM for 24 h and then treated with Nec-1 (100 μM) or GSK’872 (5 μM) for an additional 48 h. J, Western blots of WT MEFs transfected with siCtrl or siTop3a for 48 h and then treated with Nec-1 (10 μM) or GSK’872 (2.5 μM) for an additional 48 h. K, L, Western blots (K) and qRT-PCR analysis (L) of WT MEFs treated with veh or Doxo (50 nM) for 24 h and then treated with Nec-1 (10 μM) or GSK’872 (2.5 μM) for an additional 24 h. Statistical significance was determined using ANOVA and Šídák (E, G, I, L). *P < 0.05, **P < 0.01, and ***P < 0.001. Error bars represent SEM. See also Figure S4.
Figure 5.
Figure 5.. Doxorubicin induces mtDNA instability, mitochondrial Z-DNA accumulation, and IFN-I responses in cardiomyocytes.
A, Venn diagram of differentially expressed genes overlapping across datasets GSE40289 and GSE79413 (left). The top 5 pathways identified from the 261 commonly expressed genes from all three datasets (right). Shared gene lists from the top 3 pathways are shown (bottom). B, C, qRT-PCR analysis in veh or Doxo (250 nM) treated human induced pluripotent stem cell-derived cardiomyocytes (hiPSC-CM) (B) and murine neonatal CM (C). D, Western blots in Doxo (500 nM, 24h) or mouse IFNβ (mIFNβ, 1 ng/mL, 4 h) treated murine neonatal CMs. E, qRT-PCR analysis in anti-IgG1 or -interferon receptor 1 (α-IFNAR) antibody-blocked murine neonatal CMs exposed to mIFNβ or Doxo. CMs were pre-treated with anti-IgG1 or -IFNAR antibody at 15 μg/mL for 5 h before subjecting to mIFNβ (1 ng/mL, 4 h) or Doxo (500 nM, 24h) treatment. F, Representative images of hiPSC-CMs treated with veh or Doxo and stained with anti-DNA, -TFAM and -PDH (Mito.) antibodies and DAPI. Inset panels are magnified 7x. G, H, Representative images of hiPSC-CMs transfected with siCTRL or siZBP1 for 48 h, treated with veh or Doxo (500 nM) for an additional 24 h and stained with anti-Z-DNA and -PDH antibodies (G). Inset panels are magnified 12x. MFI quantification of Cyto. and Mito. Z-DNA is quantified in (H). MFI percentiles are normalized to veh-treated hiPSC-CMs. I, qRT-PCR analysis in hiPSC-CMs transfected with siCTRL or siZBP1 for 24 h and then treated with veh or Doxo (250 nM) for an additional 48 h. J, Western blots in Doxo (500 nM, 24 h) treated WT, Ifnar−/−, Sting−/− and Zbp1−/− murine neonatal CMs. Statistical significance was determined using unpaired t-test (B, C, E) or ANOVA and Tukey post hoc test (H, I). *P < 0.05, **P < 0.01, and ***P < 0.001. Error bars represent SEM. See also Figure S5.
Figure 6.
Figure 6.. Doxorubicin induces ZBP1 and IFN-I responses in cardiomyocytes and cardiac myeloid cells in vivo.
A, Doxo i.p. challenge regimen, cardiac cell isolation and applications diagram. B, D, Pathway analysis of RNA-seq data from cardiomyocytes isolated from adult mouse hearts post Doxo challenge compared to veh controls. Dot plots (left) and enrichment plots (right) were generated from ShinyGo and Gene Set Enrichment Analysis (GSEA) software, respectively. NES = Normalized Enrichment Score, FDR = False Discovery Rate. C, E, Heatmaps of RNA-seq data displaying the top 50 up-regulated genes in interferon alpha response pathway (C) and top 50 down-regulated genes in oxidative phosphorylation pathway (E). Log2 fold changes (Log2FC) are normalized to the average of veh challenged CMs. F, Pie charts of major non-cardiomyocyte (non-CM) populations: immune cells (Immu), endothelial cells (Endo) and fibroblasts (Fb), compositions in veh and Doxo challenged mouse hearts (n = 3 per treatment). G, Flow cytometric analysis of CD45 and CD11b on non-CM isolated from veh and Doxo challenged mouse hearts. H, Pie charts of major immune cell populations: infiltrating myeloid cells (Infil mye), resident myeloid cells (Res mye) and lymphocytes (Lymph), in veh and Doxo challenge mouse hearts (n = 4 per treatment). I-N, Flow cytometric analysis of Mx1gfp+ cells in indicated cardiac immune subpopulations. Histograms are representative of 4 independent experiments. MFI quantifications are shown on the right. O, Generation of myeloid-specific STING and IFNAR knockout mouse strains (top) and Doxo administration regimen (bottom). P, Western blots in cardiac lysates from WTLysMcre, Stingfl/flLysMcre and Ifnarfl/flLysMcre mice post veh or Doxo challenge (n = 3 per genotype per challenge). Statistical significance was determined using unpaired t-test (I-N). *P < 0.05, **P < 0.01, and ***P < 0.001. Error bars represent SEM. See also Figure S6 and Table S2.
Figure 7.
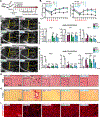
Figure 7.. The ZBP1-IFN-I axis contributes to Doxorubicin-induced cardiac injury and cardiomyopathy.
A, Doxo i.p. challenge regimen, longitudinal cardiac monitoring, and cardiac harvest timepoint diagram. B, Left ventricular ejection fraction (EF) and fractional shortening (FS) calculated from B-mode or M-mode images (n = 6 per genotype). C, D, Representative parasternal long axis images from each genotype pre-Doxo (C) and at week 10 post Doxo challenge (D). E, F, qRT-PCR analysis of ISGs (E) or natriuretic peptides Nppa, Nppb and the Myh6/7 expression ratio (F) in veh or Doxo treated WT, Zbp1−/−, Sting−/− and Ifnar−/− cardiac lysates (n = 3 per genotype per treatment). G-I, Representative images of H&E staining (G), picrosirius red (P. Red) staining (H) and ATP5A1 and DAPI immunofluorescent staining (I) of the heart sections from veh treated WT mice and 10-week post Doxo treated WT, Zbp1−/−, Sting−/− and Ifnar−/− mice. Arrows in G indicate significant cardiomyocyte vacuolization in Doxo-treated WT heart section. Statistical significance was determined using ANOVA and Dunnett (B) or Šídák (E, F) post hoc test. *P < 0.05, **P < 0.01, and ***P < 0.001. Error bars represent SEM. See also Figure S7.

References

    1. West AP, and Shadel GS (2017). Mitochondrial DNA in innate immune responses and inflammatory pathology. Nat. Rev. Immunol 17, 363–375. 10.1038/nri.2017.21. - DOI - PMC - PubMed
    1. Riley JS, and Tait SW (2020). Mitochondrial DNA in inflammation and immunity. EMBO Rep. 21. 10.15252/embr.201949799. - DOI - PMC - PubMed
    1. Marchi S, Guilbaud E, Tait SWG, Yamazaki T, and Galluzzi L (2022). Mitochondrial control of inflammation. Nat. Rev. Immunol, 1–15. 10.1038/s41577-022-00760-x. - DOI - PMC - PubMed
    1. Chen D, Tong J, Yang L, Wei L, Stolz DB, Yu J, Zhang J, and Zhang L (2018). PUMA amplifies necroptosis signaling by activating cytosolic DNA sensors. Proc. Natl. Acad. Sci 115, 3930–3935. 10.1073/pnas.1717190115. - DOI - PMC - PubMed
    1. Szczesny B, Marcatti M, Ahmad A, Montalbano M, Brunyánszki A, Bibli S-I, Papapetropoulos A, and Szabo C (2018). Mitochondrial DNA damage and subsequent activation of Z-DNA binding protein 1 links oxidative stress to inflammation in epithelial cells. Sci. Rep 8, 914. 10.1038/s41598-018-19216-1. - DOI - PMC - PubMed

Publication types

LinkOut - more resources