. 2023 Aug;22(8):100605.
doi: 10.1016/j.mcpro.2023.100605. Epub 2023 Jun 22.

Facioscapulohumeral Muscular Dystrophy is Associated With Altered Myoblast Proteome Dynamics

Affiliations

Facioscapulohumeral Muscular Dystrophy is Associated With Altered Myoblast Proteome Dynamics

Yusuke Nishimura et al. Mol Cell Proteomics. 2023 Aug.

Abstract

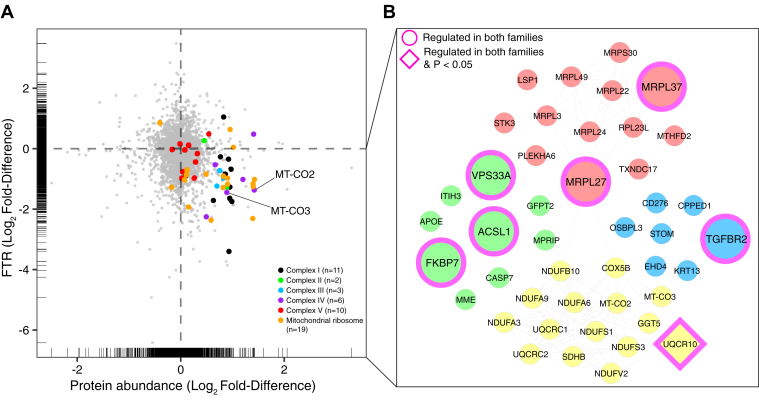
Proteomic studies in facioscapulohumeral muscular dystrophy (FSHD) could offer new insight into disease mechanisms underpinned by post-transcriptional processes. We used stable isotope (deuterium oxide; D2O) labeling and peptide mass spectrometry to investigate the abundance and turnover rates of proteins in cultured muscle cells from two individuals affected by FSHD and their unaffected siblings (UASb). We measured the abundance of 4420 proteins and the turnover rate of 2324 proteins in each (n = 4) myoblast sample. FSHD myoblasts exhibited a greater abundance but slower turnover rate of subunits of mitochondrial respiratory complexes and mitochondrial ribosomal proteins, which may indicate an accumulation of "older" less viable mitochondrial proteins in myoblasts from individuals affected by FSHD. Treatment with a 2'-O-methoxyethyl modified antisense oligonucleotide targeting exon 3 of the double homeobox 4 (DUX4) transcript tended to reverse mitochondrial protein dysregulation in FSHD myoblasts, indicating the effect on mitochondrial proteins may be a DUX4-dependent mechanism. Our results highlight the importance of post-transcriptional processes and protein turnover in FSHD pathology and provide a resource for the FSHD research community to explore this burgeoning aspect of FSHD.

Keywords: FSHD; biosynthetic labelling; deuterium oxide; fractional synthesis rate; heavy water; mitochondria; mitochondrial ribosome; protein turnover; proteome dynamics; skeletal muscle.


Conflict of interest statement

Conflict of interest The authors declare that they have no known competing financial interests or personal relationships that could have appeared to influence the work reported in this paper.

Figures

None
Graphical abstract
Fig. 1
Fig. 1
Dynamic proteome profiling of two pairs of FSHD and UASb myoblasts.A, experimental design and workflow for sample preparation and analysis. B, characteristics of FSHD and UASb donors, including shortened length of the 4q D4Z4 repeat array (bold red) and muscle score using the Medical Research Council (MRC) scale where 5/5 is maximum strength. Data were retrieved from Homma et al. (21). C, matrix correlation of abundance data, n = 4420 proteins, using Pearson’s correlation coefficient. Bi, biceps; Del, deltoid.
Fig. 2
Fig. 2
Differences in protein abundance between FSHD and UASb myoblasts.A, volcano plot comparing the Log2 Fold-Difference (FSHD/UASb) protein abundance plotted against the −Log10p value (n = 4420). Colored data points represent proteins more abundant (red, log2 Diff. > 1), less abundant (blue, log2 Diff. < −1), or stable (grey, log2 Diff. < 1 and > −1) in FSHD compared to UASb myoblasts. The dashed horizontal line shows a threshold of statistical significance (p < 0.05). Gene ontology (GO) analysis of cellular component and biological process in proteins (B) depleted (log2 Diff. < −1) or (C) enriched (log2 Diff. > 1) in FSHD compared to UASb myoblasts. GO terms were ranked by −log10 (q value) and the number of proteins included in each GO term reported alongside each entry. Each bar chart colour scale represents the level of GO enrichment. STRING protein interaction network for proteins (D) depleted (log2 Diff. < −1) or (E) enriched (log2 Diff. > 1) in FSHD compared to UASb myoblasts. The STRING interaction network was generated using a minimum interaction score of 0.7 and the interaction network was clustered using k-means clustering. Proteins without interaction partners were omitted from visualization.
Fig. 3
Fig. 3
Differences in protein turnover rate between FSHD and UASb myoblasts.A, volcano plot comparing the Log2 fold-difference (FSHD/UASb) in protein turnover plotted against the −Log10p value (n = 2324 proteins). Colored data points represent proteins with greater (red, log2 Diff. > 1), lesser (blue, log2 Diff. < −1), or stable (grey, log2 Diff. < 1 and > −1) rates of turnover in FSHD compared to UASb myoblasts. Dashed horizontal line denotes a significance threshold of p < 0.05. B, gene ontology (GO) analysis of cellular component and biological process for proteins exhibiting a lesser turnover rate in FSHD compared to UASb (log2 Diff. < −1). GO terms were ranked by -log10 (q value) and the number of proteins included in each GO term reported alongside each entry. Each bar chart colour scale represents the level of GO enrichment. C, density plot of log10 transformed fractional protein turnover rate (FTR, %/h) in FSHD and UASb myoblasts. The vertical black line in each density plot indicates the median for each sample, whereas the red vertical line indicates (0 log10) represents an FTR of 1%/h. No difference in FTR profile (one-way ANOVA, p = 0.37) were detected between FSHD and UASb myoblasts. STRING protein interaction networks for proteins with (D) lesser turnover rate (log2 Diff. < −1) or (E) greater turnover rate (log2 Diff. > 1) in FSHD compared to UASb myoblasts. The STRING interaction network was generated using a minimum interaction score of 0.7 and the interaction network was clustered using k-means clustering. Proteins without interaction partners were omitted from visualization.
Fig. 4
Fig. 4
Mitochondrial proteins are more abundant but exhibit slower protein turnover rates in FSHD myoblasts.A, scatter plot comparing the differences in the Log2 Fold-Difference (FSHD/UASb) between protein abundance (x-axis) and protein FTR (y-axis). Rug plots display the distribution of individual data both in X and Y axis. B, STRING interaction network of proteins more abundant (log2 Diff. > 0.6) and slower FTR (log2 Diff. < −0.6) in FSHD myoblasts. The STRING interaction network was generated using a minimum interaction score of 0.7 and the interaction network was clustered using k-means clustering.
Fig. 5
Fig. 5
Dysregulation of mitochondrial protein is common in FSHD despite variation between families. Principal Component Analysis (PCA) on (A) protein abundance and (B) FTR data in FSHD and UASb myoblasts of Family #15 and family #16. Venn diagrams of abundance (C) and FTR (D) data illustrating the number of strongly regulated (log2 Diff. > 1 or < −1) proteins common to family #15 and family #16. Scatter plots illustrating family-specific Log2 Fold-Differences (FSHD/UASb) in protein abundance (x-axis) and protein FTR (y-axis). Black circles represent proteins strongly regulated (log2 Diff. > 1 or < −1) in abundance and FTR, only mitochondrial proteins were annotated (green circles). Blue circles in (F; family #16A/16U) highlight nine mitochondrial proteins that were strongly regulated in family #15 (E).
Fig. 6
Fig. 6
Dysregulation of mitochondrial proteins tends to be reversed by 2′-MOE antisense oligomer treatment targeting DUX4.A, experimental design of a subsequent independent study including treatment of FSHD and UASb myoblasts with a 2′-MOE modified antisense oligomer targeting exon three of DUX4. Scatter plots (BE) compare the Log2 Fold-Difference between FSHD and UASb (x-axis) and the Log2 Fold-Difference in 2′-MOE treated FSHD myoblasts against vehicle control for abundance data of family #15 (B) or family #16 (C) and FTR data of family #15 (D) or family #16 (E). Rug plots display the distribution of data on x-axis and y-axis. A linear regression line with 95% confidence intervals was drawn in each figure panel. The negative slope of the regression line indicates a counter effect of 2′-MOE modified antisense oligomer treatment against FSHD.
Fig. 7
Fig. 7
Accumulation of “older” less viable mitochondrial proteins may contribute to the pathophysiology of FSHD. FSHD myoblasts exhibit a greater protein abundance but a slower turnover rate of mitochondrial respiratory complex subunits and mitochondrial ribosomal subunits, which may indicate an accumulation of ‘older’ less viable mitochondrial proteins compared to UASb myoblasts. This may contribute to the reduced respiratory function specifically observed in Complex I as recently shown by Heher et al. (8) in DUX4 expressing iDUX4 myoblasts. Impaired mitochondrial function is proposed as one of the major pathophysiological mechanisms of FSHD. Created with BioRender.com.

References

    1. Statland J.M., McDermott M.P., Heatwole C., Martens W.B., Pandya S., van der Kooi E.L., et al. Reevaluating measures of disease progression in facioscapulohumeral muscular dystrophy. Neuromuscul. Disord. 2013;23:306–312. - PMC - PubMed
    1. Lemmers R.J., van der Vliet P.J., Klooster R., Sacconi S., Camano P., Dauwerse J.G., et al. A unifying genetic model for facioscapulohumeral muscular dystrophy. Science. 2010;329:1650–1653. - PMC - PubMed
    1. Rickard A.M., Petek L.M., Miller D.G. Endogenous DUX4 expression in FSHD myotubes is sufficient to cause cell death and disrupts RNA splicing and cell migration pathways. Hum. Mol. Genet. 2015;24:5901–5914. - PMC - PubMed
    1. Winokur S.T., Chen Y.W., Masny P.S., Martin J.H., Ehmsen J.T., Tapscott S.J., et al. Expression profiling of FSHD muscle supports a defect in specific stages of myogenic differentiation. Hum. Mol. Genet. 2003;12:2895–2907. - PubMed
    1. Winokur S.T., Barrett K., Martin J.H., Forrester J.R., Simon M., Tawil R., et al. Facioscapulohumeral muscular dystrophy (FSHD) myoblasts demonstrate increased susceptibility to oxidative stress. Neuromuscul. Disord. 2003;13:322–333. - PubMed

Publication types

MeSH terms