. 2023 Jun 23;14(1):3763.
doi: 10.1038/s41467-023-39425-1.

Molecular mechanism of phosphopeptide neoantigen immunogenicity

Affiliations

Molecular mechanism of phosphopeptide neoantigen immunogenicity

Yury Patskovsky et al. Nat Commun. .

Erratum in

  • Author Correction: Molecular mechanism of phosphopeptide neoantigen immunogenicity.
    Patskovsky Y, Natarajan A, Patskovska L, Nyovanie S, Joshi B, Morin B, Brittsan C, Huber O, Gordon S, Michelet X, Schmitzberger F, Stein RB, Findeis MA, Hurwitz A, Van Dijk M, Chantzoura E, Yague AS, Pollack Smith D, Buell JS, Underwood D, Krogsgaard M. Patskovsky Y, et al. Nat Commun. 2023 Jul 27;14(1):4522. doi: 10.1038/s41467-023-40274-1. Nat Commun. 2023. PMID: 37500629 Free PMC article. No abstract available.

Abstract

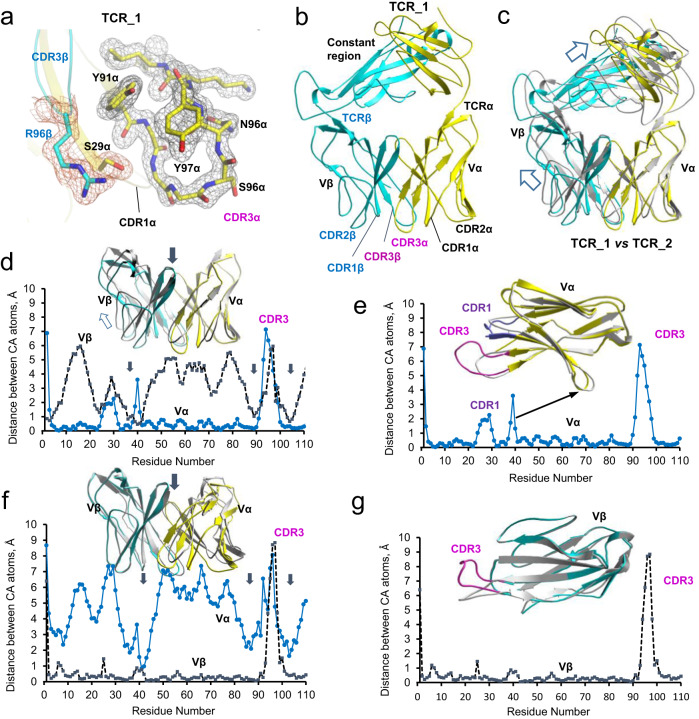
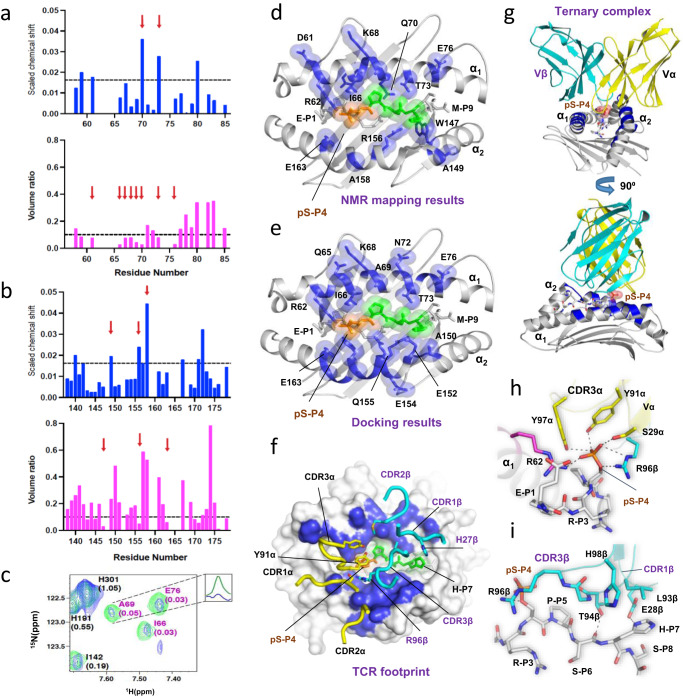
Altered protein phosphorylation in cancer cells often leads to surface presentation of phosphopeptide neoantigens. However, their role in cancer immunogenicity remains unclear. Here we describe a mechanism by which an HLA-B*0702-specific acute myeloid leukemia phosphoneoantigen, pMLL747-755 (EPR(pS)PSHSM), is recognized by a cognate T cell receptor named TCR27, a candidate for cancer immunotherapy. We show that the replacement of phosphoserine P4 with serine or phosphomimetics does not affect pMHC conformation or peptide-MHC affinity but abrogates TCR27-dependent T cell activation and weakens binding between TCR27 and pMHC. Here we describe the crystal structures for TCR27 and cognate pMHC, map of the interface produced by nuclear magnetic resonance, and a ternary complex generated using information-driven protein docking. Our data show that non-covalent interactions between the epitope phosphate group and TCR27 are crucial for TCR specificity. This study supports development of new treatment options for cancer patients through target expansion and TCR optimization.


Conflict of interest statement

All authors have directly participated in the planning, execution, or analysis of the study and drafting or revising of the manuscript, and have read and approved the final version of the manuscript. Y.P., L.P., S.N., A.N. and M.K. have no financial interests to disclose. D.U., B.M., X.M., B.J., C.B., O.H., S.G., E.C, A.S.Y., F.S., R.B.S., M.A.F., A.H., D.P., M.v.D., J.S.B. have ownership of equity securities and/or are currently or previously employed by Agenus. This does not alter our adherence to policy of the journal on sharing the data and materials.

Figures

Fig. 1
Fig. 1. Specificity of TCR27 towards pMLL747–755 and pDOT1L998–1006 epitopes.
a Schematic representation of in vitro experimental procedures. T cells from healthy donors were isolated, activated and transduced with lentivirus expressing TCR27. TCR27 expression was analyzed at day 7 by flow cytometry. T cell cytotoxicity and activation were evaluated between days 10 and 15. H = hours. b TCR27-transduced T cell activation by different peptides. HLA-B*0702-expressing T2 (Target) cells were pulsed with various concentrations of pMLL747–755 peptide and its analogs. Peptide-pulsed Target cells were co-cultured with TCR27-transduced T cells or with non-transduced (control) T cells. T cell upregulation of CD25 and CD69 was analyzed by flow cytometry in triplicate and expressed as mean ± SEM. The shown in figure P value between the pMLL747–755 and E7P- pMLL747–755 (phosphonate) datasets was calculated using a two-sided Mann–Whitney U test. c PMLL747–755 and a set of the mutant peptides carrying single residue substitutions were analyzed in the T cell activation assay by detecting CD25/CD69 markers using flow cytometry. Peptide activity (as a mean value of triplicate) was color-coded according to the ratio of activation induced by mutant peptide to that induced by the WT peptide, in which the WT peptide activity is set at 1.0. d Comparison of epitope-specific T cell activation between pMLL747–755 and pDOT1L998–1006. Legends the same as in (b). The shown in figure P value between the pMLL747–755 and MLL747–755 datasets was calculated using a two-sided Mann–Whitney U test.
Fig. 2
Fig. 2. High structural similarity between HLA-B*0702 complexes with different peptides.
a Sensorgrams demonstrate binding between TCR27 and pMHC, they were obtained by Bio-Layer Interferometry as described in Methods. KD values were determined using steady-state analysis. The difference between duplicates did not exceed 3%. b The structures of peptides in complex with HLA-B*0702. The sigmaA-weighted Fo-Fc (omit) electron density map (σ = 3.0, cutoff radius = 1.5 Å) was drawn around each peptide present in the corresponding pMHC crystal structure. Peptides KD values were determined using an Alpha assay as outlined in Methods. Residues others than Serine at P4 are colored. c The inter-chain H-bond network inside the peptide-binding cavity of a binary pMLL747–755/HLA-B*0702 complex (cartoon model). Individual amino acid residues are shown as sticks and the water molecules as non-bonded spheres. H-bonds presented as dotted lines. d Scheme of the HLA-peptide interface for a binary pMLL747–755/HLA-B*0702 complex. Amino acid residues were colored according to their properties (polar, nonpolar, basic, acidic, or aromatic); the hydrogen bonds are shown as lines and alpha helices as tubes. e Alignment of the crystal structures for pMLL747–755/HLA-B*0702 (carbon atoms are gray) and MLL747–755/HLA-B*0702 (carbon atoms are yellow). H-bonds (dotted lines) are shown between MLL747–755 and Arg62. Individual residues are presented as sticks. The two alternate conformations for Ile66 are marked by a two-headed arrow. Hydrogen-bond distance cutoff was 3.5 Å. f Alignment of the crystal structures for pDOT1L998–1006/HLA-B*0702 (carbon atoms are gray) and DOT1L998–1006/HLA-B*0702 (carbon atoms are yellow). H-bonds are shown between DOT1L998–1006 and Arg62 or Arg156.
Fig. 3
Fig. 3. The presence of phosphoserine at P4 causes unique local conformational changes at the peptide-MHC binding site.
The amino acid residues are drawn as sticks. The Ile66 alternate conformations are marked by arrows. H-bonds (distance cutoff <3.5 Å) are the dotted lines between peptide and Arg62 or Gln155 residues, respectively. a Cartoon representation of the MLL747–755/HLA-B*0702 structure, carbons are yellow. b Cartoon representation of the OSE-MLL747–755/HLA-B*0702 structure, peptide carbons are gray. c Cartoon representation of the E7P-MLL747–755/HLA-B*0702 structure, peptide carbons are gray. d Superimposition of the E7P-MLL747–755/HLA-B*0702 (carbon atoms are yellow) and pMLL747–755/HLA-B*0702 crystal structures. H-bonds are shown between E7P-MLL747–755 and Arg62 or Gln155.
Fig. 4
Fig. 4. Similarity between the pMHC structures with pMLL747–755 and pDOT1L998–1006 epitopes indicates the presence of a shared TCR recognition motif.
In a and b, amino acid residues are sticks, H-bonds (distance cutoff <3.5 Å) - dotted lines. a Alignment of the crystal structures for pMLL747–755/HLA-B*0702 (carbon atoms are gray) and DOT1L998–1006/HLA-B*0702 (carbon atoms are yellow). H-bonds are shown between DOT1L998–1006 and Arg62 or Arg156. The arrow points to the direction of a helical shift. b Distinct H-bond patterns (bonds are dotted lines) in the crystal structures of pMLL747–755/HLA-B*0702 and pDOT1L998–1006/HLA-B*0702. Only HLA residues with different conformations and/or interaction patterns are shown. The carbon atoms in epitopes are colored in gray. Individual residues in pMLL747–755 (c) or pDOT1L998–1006 (e) peptides (all atoms are presented as Van-der-Waals spheres) are shaded according to relative solvent exposure (from none - white to 100% - dark blue). The cartoon models display the respective peptide-binding sites in HLA-B*0702. The minor alternate conformation of pSer-P4 in the pMHC structure with pMLL747–755 was omitted for clarity. Identical residues in epitope sequences are red-colored. Relative solvent-exposed surface area (SASA) is presented as a percentage of all surface area (ASA) for each epitope residue in the crystal structures of pMLL747–755/HLA-B*0702 (d) or pDOT1L998–1006/HLA-B*0702/ (f). Anchor residues are marked by down arrows.
Fig. 5
Fig. 5. The crystal structure of TCR27 is similar to other human TCRs but displays large conformational heterogeneity.
Cartoon representation. a TCR_1 structure. The sigmaA-weighted 2Fo-Fc electron density map is shown around amino acid residues that belong to the CDR3 loops. Individual residues are stick models. b Overall structure of the TCR27 (TCR_1) heterodimer, including locations of the separate chains, constant or variable regions, and the CDR loops. c Superposition of the TCR_1 and TCR_2 structures was performed using the atomic coordinates of the corresponding Vα domains. d, e Structural alignment of the TCR_1 and TCR_2 variable regions using the coordinates of the corresponding Vα domains. The Cα difference plots between TCR_1 and TCR_2 variable regions (d) or the isolated Vα domains only (e) show similarity between their tertiary structures except for different orientations of the CDR3α loops. The transition between the two quaternary conformations is a result of the Vβ domain rotation around the center of rotation, an approximate position of which is indicated by the down arrows. f, g. Structural alignment of TCR_1 and TCR_2 variable regions using the coordinates of the corresponding Vβ domains. The Cα difference plots between the TCR_1 and TCR_2 variable regions (f) or the isolated Vβ domains only (g) demonstrate increased flexibility of the CDR3β loops. The transition between the two conformations could be the result of Vα domain “rotation” around the rotation axis, the approximate position of which is depicted by the down arrows.
Fig. 6
Fig. 6. NMR mapping of the HLA-epitope interface reveals consistency between the pMHC crystal structure and its conformation in solution.
a Plot of scaled chemical shift changes (CSP) versus residue number between 15N-TROSY spectra of pMLL747–755/HLA-B*0702 and MLL747–755/HLA-B*0702 complexes. The line at CSP = 0.043ppm indicates a threshold at 1δ over mean CSP. The four amino acid clusters, #1 (58–62), #2 (66-77), #3 (152–156) and #4 (167–173) with highest CSP values are outlined. b Zoomed-in view of the overlay of 15N-TROSY spectra of pMLL747–755/HLA-B*0702 (green) and MLL747–755/HLA-B*0702 complexes (blue) showing CSPs of residues (indicated by the arrows) belonging to clusters #2 and #3. c Cartoon view of the two alpha helices involved in epitope binding: NMR cluster #1 surrounding Arg62 (orange), NMR cluster #2 surrounding Ile66 (orange), NMR cluster #3 around Gln155 (orange), and NMR cluster #4 near Glu-P1 (blue). The peptide is shown as gray sticks, and pSer-P4 is presented as a space-filling model. The minor alternate conformation for pSer-P4 was omitted for clarity. d Overlay of pMHC structures with pMLL747–755 (carbons are gray) and MLL747–755 (carbons are yellow). The carbon atoms in HLA-B*0702 are colored in blue (with pMLL747–755) or yellow (with MLL747–755), respectively. The dashed lines show H-bonds between pMLL747–755 and HLA residues. The arrowheads indicate the AA residues, NMR spectra of which can be affected by neighbors, explaining the reason for peaks clustering observed in (a).
Fig. 7
Fig. 7. TROSY-NMR mapping of the TCR-pMHC interface and proof of a ternary complex conformation.
a NMR mapping of the HLA-B*0702 interface residues in the α1 helix. Top—Plot of CSP observed between 15N-TROSY spectra of pMHC (pMLL747–755/HLA-B*0702) alone and that of a 1:1 molar ratio mixture of TCR27: pMHC. The CSP value of 0.016 indicates a threshold at 1σ over mean CSP. Bottom - Plot of ratio of peak volumes between 15N-TROSY spectra of pMLL747–755/HLA-B*0702 alone and that of a 1:1 molar ratio mixture of TCR27:pMLL747–755/HLA-B*0702. The line of 0.1 indicates a significance threshold value (1σ under mean volume ratio). The arrows indicate residues with significant changes in the CSP values and volume ratios. b NMR mapping of HLA-B*0702 residues in the α2 helix. Designations are the same as in (a). c Zoomed-in view of the overlay of 15N-TROSY spectra for pMLL747–755/HLA-B*0702 (green) alone and that of a 1:1 molar ratio mixture of TCR27:pMLL747–755/HLA-B*0702 (blue). The numbers in parentheses indicate the ratios of the peak volumes between the two spectra. Inset box shows the 1D 1H plane of Ala69 in the two spectra, colored as described above. d HLA-B*0702 residues at the TCR-pMHC interface mapped by NMR. Cartoon model with perturbed (both CSP and peak volume change) residues (sticks and semi-transparent spheres) colored in blue. The epitope’s pSer-P4 and P5-P7 residues (sticks and spheres) are colored in orange and green, respectively. e The pMHC residues (sticks and spheres) at the TCR-pMHC interface (cutoff interatomic distance <4 Å) are colored in blue. This TCR27:pMLL747–755/HLA-B*0702 complex was generated by Haddock docking (scenario #4). f TCR27 footprint over pMHC in the ternary complex (scenario #4, cutoff interatomic distance <4 Å). Projections of the Vα and Vβ chains over HLA-B*0702 are shown as shaded areas, the epitope residues are sticks, and the CDR loops are coils with residues as sticks. The carbon atoms are yellow in TCRα and dark blue in TCRβ. The carbon atoms in epitope residues P5–P7 are green. g Overall conformation of the TCR27:pMLL747–755/HLA-B*0702 ternary complex. The second view (bottom) was obtained by rotation of the complex (top) around the vertical axis (90°). The truncated model includes only the variable region of the TCR, the peptide-binding domain of the HLA heavy chain (both are shown as cartoons) and the pMLL747–755 peptide (stick model). The helices are labeled as α1 and α2. h H-bonds (dotted lines) between the phosphate group of pSer-P4 and TCR27 amino acid residues (stick models) in a TCR27:pMLL747–755/HLA-B*0702 ternary complex. i Interactions between TCR27 and pMLL747–755 include atoms of amino acid residues located at the CDR3β loop and epitope (P4–P7). Cartoon and stick representation. H-bonds are dotted lines.

References

    1. Luksza M, et al. A neoantigen fitness model predicts tumour response to checkpoint blockade immunotherapy. Nature. 2017;551:517–520. - PMC - PubMed
    1. Blass E, Ott PA. Advances in the development of personalized neoantigen-based therapeutic cancer vaccines. Nat. Rev. Clin. Oncol. 2021;18:215–229. - PMC - PubMed
    1. Zarling AL, et al. Identification of class I MHC-associated phosphopeptides as targets for cancer immunotherapy. Proc. Natl Acad. Sci. USA. 2006;103:14889–14894. - PMC - PubMed
    1. Bassani-Sternberg M, et al. Direct identification of clinically relevant neoepitopes presented on native human melanoma tissue by mass spectrometry. Nat. Commun. 2016;7:13404. - PMC - PubMed
    1. Yen YT, et al. Protein phosphatase 2A inactivation induces microsatellite instability, neoantigen production and immune response. Nat. Commun. 2021;12:7297. - PMC - PubMed

Publication types