. 2023 Jun 23;14(1):3732.
doi: 10.1038/s41467-023-39345-0.

TRPV4-Rho GTPase complex structures reveal mechanisms of gating and disease

Affiliations

TRPV4-Rho GTPase complex structures reveal mechanisms of gating and disease

Do Hoon Kwon et al. Nat Commun. .

Abstract

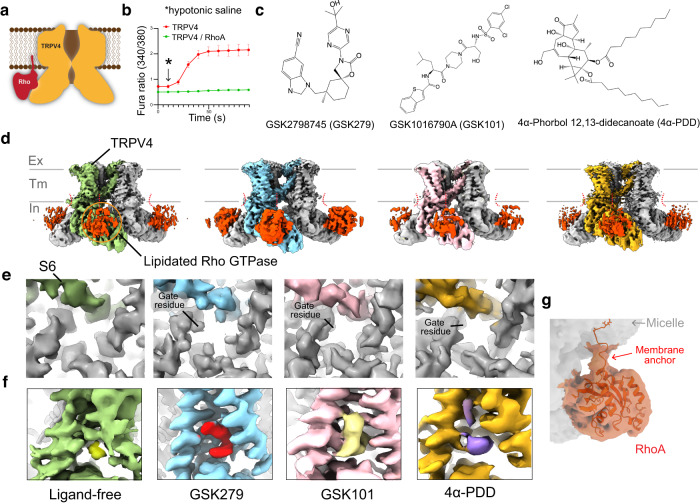
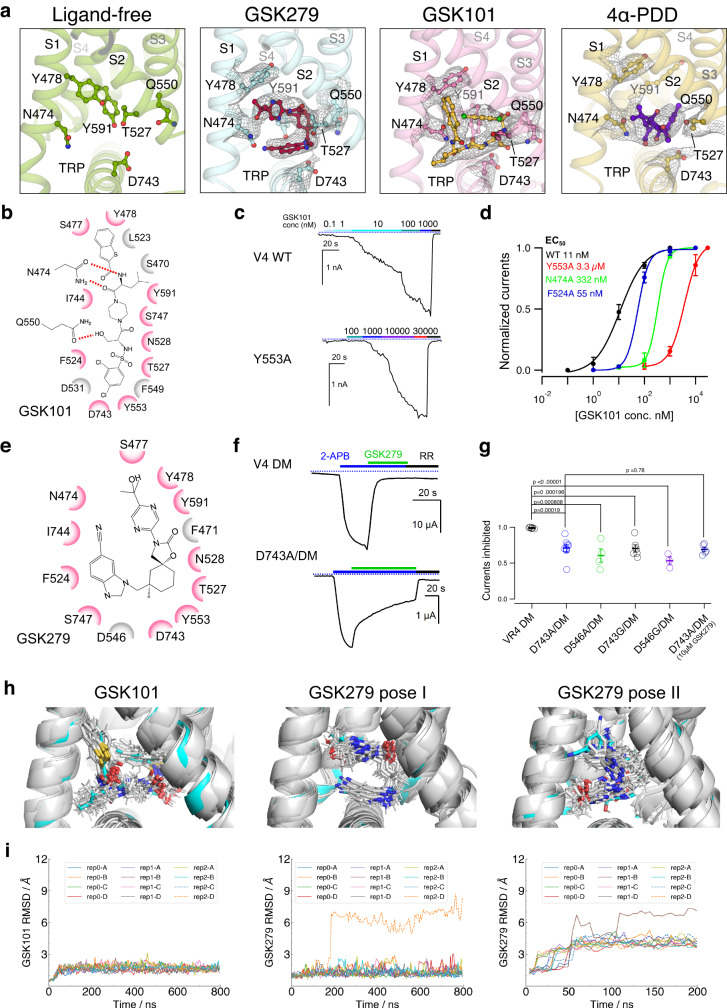
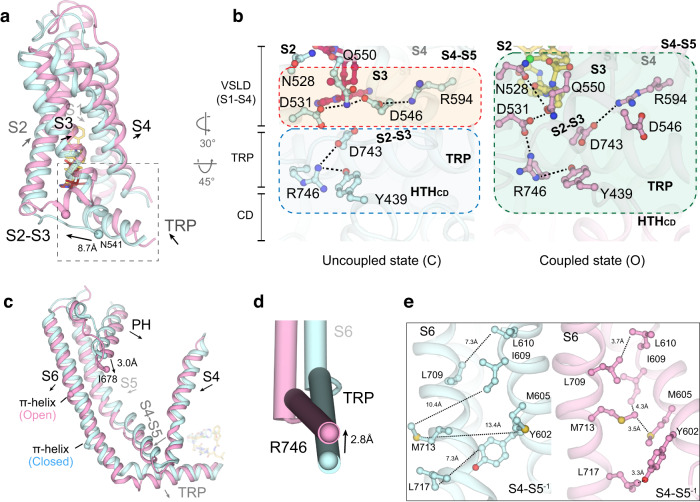
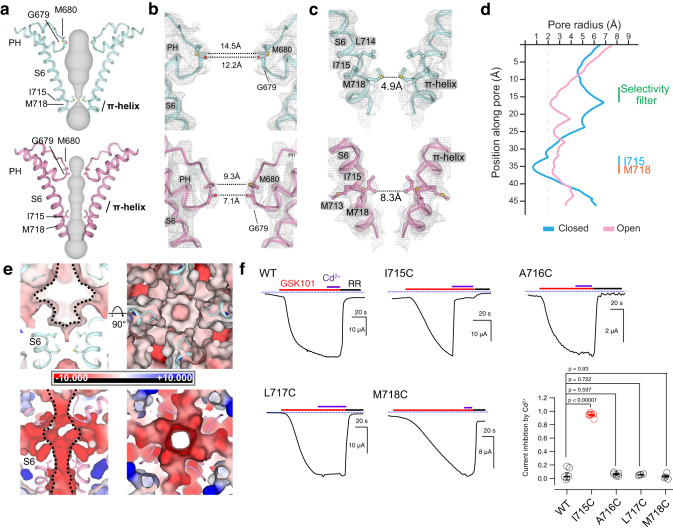
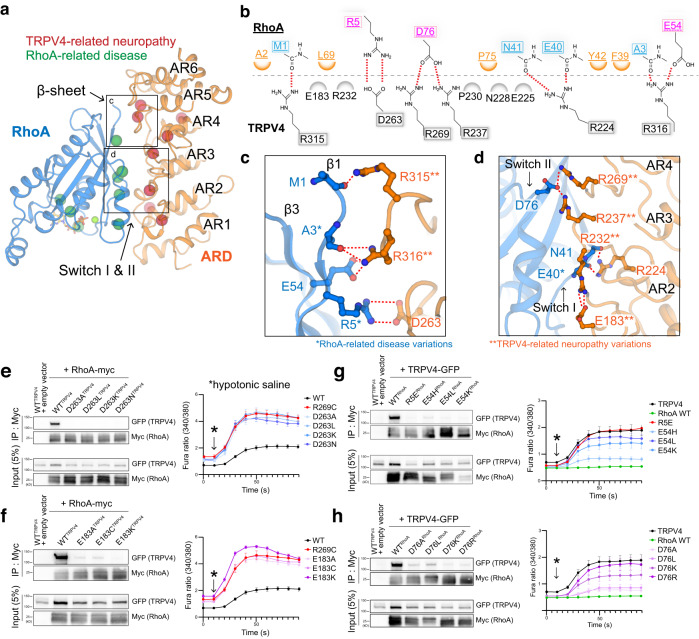
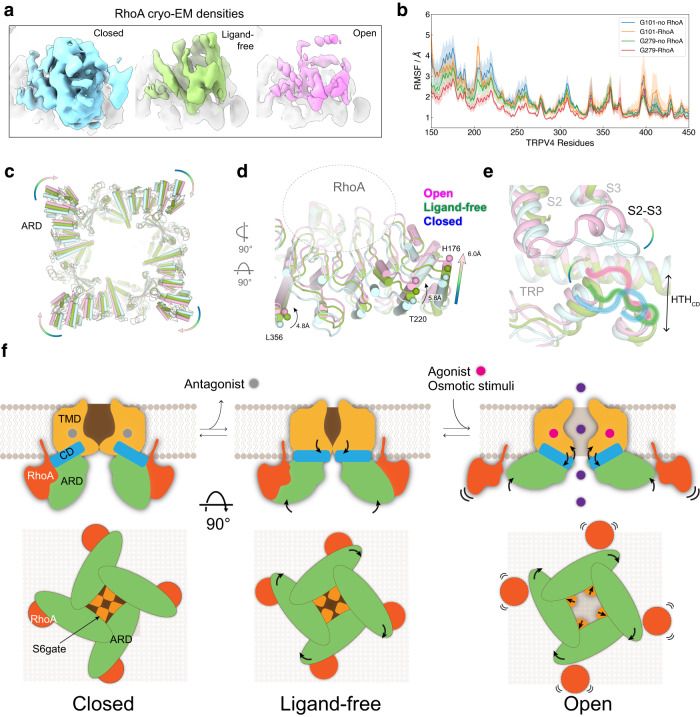
Crosstalk between ion channels and small GTPases is critical during homeostasis and disease, but little is known about the structural underpinnings of these interactions. TRPV4 is a polymodal, calcium-permeable cation channel that has emerged as a potential therapeutic target in multiple conditions. Gain-of-function mutations also cause hereditary neuromuscular disease. Here, we present cryo-EM structures of human TRPV4 in complex with RhoA in the ligand-free, antagonist-bound closed, and agonist-bound open states. These structures reveal the mechanism of ligand-dependent TRPV4 gating. Channel activation is associated with rigid-body rotation of the intracellular ankyrin repeat domain, but state-dependent interaction with membrane-anchored RhoA constrains this movement. Notably, many residues at the TRPV4-RhoA interface are mutated in disease and perturbing this interface by introducing mutations into either TRPV4 or RhoA increases TRPV4 channel activity. Together, these results suggest that RhoA serves as an auxiliary subunit for TRPV4, regulating TRPV4-mediated calcium homeostasis and disruption of TRPV4-RhoA interactions can lead to TRPV4-related neuromuscular disease. These insights will help facilitate TRPV4 therapeutics development.


Conflict of interest statement

The authors declare no competing interests.

Figures

Fig. 1
Fig. 1. Functional characterization and structure determination of the human TRPV4-Rho GTPase complex.
a Schematic drawing of the functional TRPV4-Rho GTPase interaction. b Averaged calcium imaging traces before and after hypotonic stimulation, denoted by the arrow. Expression of wild type human TRPV4 alone causes elevated baseline and stimulated calcium influx relative to the co-expression of human TRPV4 and RhoA. Data are presented as means ± SEM, n = 11 wells per condition, with 20–40 transfected cells per well. c Chemical structures of GSK1016790A (GSK101), GSK2798745 (GSK279), and 4α-phorbol 12,13-didecanoate (4α-PDD). d Cryo-EM structures of the TRPV4-Rho GTPase complex in the ligand-free, GSK279-bound closed, GSK101-bound open, and 4α-PDD-bound states, as indicated. Map thresholding: 0.24 (green), 0.25 (cyan), 0.25 (pink), 0.26 (gold). e Close-up view at the S6 gate of 3D reconstructions from (d) viewed from the intracellular side, at thresholding 0.19, 0.25, 0.25, and 0.21, respectively. f Close-up view at the ligand binding site of 3D reconstructions from (d) at thresholding 0.25, 0.36, 0.33, and 0.2, respectively. g Cryo-EM density of RhoA and its prenylated tail of the GSK279-TRPV4-RhoA reconstruction, at thresholding 0.09. Source data for (b) are provided as a Source Data file.
Fig. 2
Fig. 2. Antagonist- and agonist-binding in the TRPV4 channel.
a Cryo-EM densities (gray mesh) for ligands (GSK279; red stick, GSK101; gold stick, and 4α–PDD; violet stick) in ligand-free, closed, open, and 4α-PDD-open states. Densities are contoured at 0.23, 0.36, 0.33, and 0.195 thresholding, respectively. Sidechains of key residues are shown in sticks. b Ligplot schematics of GSK101-TRPV4 interactions, where residues within 3.8 Å to the ligands are shown. Pink colored residues are involved in both GSK101 and GSK279 bindings. c Representative patch clamp recording of wild type TRPV4 and mutant Y553A at −60 mV at increasing concentrations of GSK101, followed by block with ruthenium red (RR, 50 µM), as indicated by the colored horizontal lines. The blue-dotted lines indicate the zero-current level. d Mean normalized concentration-response relations for GSK101. Data are shown as mean ± SEM. (n = 3–5 oocytes). The continuous curves are fits to the Hill equation with EC50 as indicated in the figure. e Ligplot schematics of GSK279-TRPV4 interactions. f Representative two-electrode voltage-clamp recording of TRPV4 mutant (TRPV4DM), and additional mutants made with the background TRPV4DM as indicated in the figure. g Summary of inhibition by GSK279 relative to current from saturating 2-APB (2 mM) at room temperature. Values for individual oocytes are shown as open circles with mean ± SEM shown (The n values are 6, 9, 4, 6, 3 oocytes, respectively. For D743A with 10 µM GSK279 inhibition, the n = 5 oocytes.). P values are calculated by two-tailed Student’s t test as indicated in the figure. h Ligand-binding conformational ensemble from 12 replicas of GSK101 (left), GSK279 pose I (middle) and GSK279 pose II (right). i Ligand RMSD values of GSK101 show stable ligand binding with an average RMSD of 1.65 Å. Each trajectory represents a subunit (A/B/C/D) in one of the three replicas (left). Ligand RMSD values of GSK279 pose I show stable ligand binding with an average RMSD of 1.28 Å, except for one outliner ligand, rep2-D, which stumbles out of the pocket (middle). Ligand RMSD values of GSK279 pose II show large deviations from the initial configuration with an average RMSD of 4.33 Å (right). Source data for (c, d, f, and g) are provided as a Source Data file.
Fig. 3
Fig. 3. Ligand-dependent conformational changes of TRPV4.
a Comparison of conformational changes in the VSLD of GSK279-TRPV4-RhoA (cyan) and GSK101-TRPV4-RhoA (pink). Ligands are shown as sticks. Arrows indicate helix movements and rotations. b Comparison of coupling networks at the VSLD, CD and TRP domain in closed and open states. Dashed lines indicate hydrogen bonds and salt bridges. c Comparison of conformational changes at the pore domain of GSK279-TRPV4-RhoA (cyan) and GSK101-TRPV4-RhoA (pink). Ligands are shown in sticks. Arrows indicate helix movement with distances indicated between reference points (as spheres). d Close-up view of S6b and the TRP helix. Arrows indicate helical movements with distances indicated between reference points (as spheres). e Side-by-side comparison of the closed (cyan) and open states (pink) at inter-subunit interfaces. Sidechains are shown as sticks. Dashed lines indicate the distances between corresponding residues.
Fig. 4
Fig. 4. Structural changes in the S6 gate and the SF of the pore during channel gating.
a Ion permeation pathway in the closed and open states shown as gray surfaces. S6 helices from two protomers are shown in cartoon. Only two subunits are shown for clarity. Gate and selectivity filter residues shown as sticks. b, c Close-up views of the SF region (b) and the S6 gate (c) for the closed and open states. The dotted lines indicate diagonal distances between gating residues of opposite protomers. Gray mesh indicates cryo-EM densities of TRPV4-focused maps contoured at 0.3 (top) and 0.35 (bottom) thresholding, respectively. d Pore radii calculated using the HOLE program in Coot for representative TRPV4 structures as color-coded. The minimal radius for a hydrophobic gate to be open is considered 2.0 Å. Residues corresponding to the SF (M680 and G679) and the S6 gate (I715 and M718) are denoted. e APBS surface electrostatics of the pore in the closed and open states as viewed from the membrane plane (right) and from the extracellular side (left). S6 helices and SF region are shown in cartoon and gating residues as sticks. f Representative time-course recording of WT TRPV4 and mutants. Currents elicited by 5 µM GSK101 and co-application with 10 µM Cd2+ followed by 20 µM ruthenium red (RR) as indicated by colored horizontal lines. The voltage was ramped from −60 mV to +60 mV in 300 ms every 2 seconds. The currents at −60 mV were used for the plot. Dotted blue lines indicate zero-current level. Right panel, summary of current inhibition by 10 µM Cd2+ relative to 5 µM GSK101-induced currents. Values for individual oocytes are shown as open circles with mean ± SEM (WT n = 6, I715C n = 7, A716C n = 6, L717C n = 4, M718C n = 4), P values are calculated by two-tailed Student’s t test as indicated in the figure. Source data for (f) are provided as a Source Data file.
Fig. 5
Fig. 5. Interaction between TRPV4 ARD and RhoA.
a Overall interaction interface of TRPV4 ARD and RhoA. Disease-causing mutations mapped onto the TRPV4-RhoA interface. Disease-causing mutations of TRPV4 and RhoA are shown as red and green spheres, respectively. b DIMplot schematics of TRPV4 ARD and Rho GTPase interactions, with critical positions labeled. Pink-colored residues indicate interactions via sidechains. Blue-colored residues indicate backbone-sidechain interactions. Orange-colored residues indicate hydrophobic interactions. c, d Detailed TRPV4 ARD-RhoA interactions within the β1-β3 region (c) and switch region (d). RhoA residues are colored blue, TRPV4 residues are colored orange. * disease-causing mutations in RhoA and **neuropathy-causing mutations in human TRPV4. The red dashed lines indicate salt bridge interactions. eh (Left panels) Co-immunoprecipitation of HEK293T cells transfected with TRPV4-GFP (e E183A/C/K; f D263A/L/K/N) and RhoA-Myc (g R5E, E54L/H/K; h D76A/L/K/R) demonstrates that mutations at the TRPV4-RhoA interface reduces their interaction. (Right panels) Averaged ratiometric calcium plots from ratiometric calcium imaging experiments. MN‐1 cells were transfected with GFP‐tagged TRPV4 plasmids only (e, f) and GFP‐tagged TRPV4 and RhoA-Myc plasmids (g, h) and loaded with Fura‐2 AM calcium indicator. Baseline and hypotonic saline-stimulated calcium responses were then measured over time. N = 9 wells per condition, with 20–40 transfected cells per well. Data are shown as mean ± SEM. Source data for (eh) are provided as a Source Data file.
Fig. 6
Fig. 6. Structural basis of RhoA-dependent gating of TRPV4.
a Side-by-side comparison of cryo-EM densities of RhoA in closed (cyan), ligand-free (green), and open (pink) states at thresholding 0.25. 4 Å low-pass filter and the same B-factor (−50) are applied to all cryo-EM maps. b Root-mean-square-fluctuation (RMSF) of residues in the TRPV4 ARD in GSK101-TRPV4, GSK101-TRPV4-RhoA, GSK279-TRPV4, and GSK279-TRPV4-RhoA systems from all-atom MD simulations. In the GSK279-bound state, RhoA binding significantly reduced ARD fluctuation. Shades indicate standard deviations from 12 replicas. ce Comparison of closed, ligand-free, and open structures viewed from the intracellular side (c) Close-up view of the ARD (d) and coupling domain (e HTHCD, TRP, and S2–S3). Arrows indicate movements of the ARD. ARD/CD rigid-body movement occurs at an individual protomer level. f Ligand-dependent channel gating of TRPV4-RhoA. Schematic illustration of the conformational rearrangements in the S6 gate, ARD, and RhoA during TRPV4 gating.

References

    1. Lavanderos, B. et al. TRP Channels regulation of Rho GTPases in brain context and diseases. Front. Cell Developmental Biol.8, 582975 (2020). - PMC - PubMed
    1. Cachero TG, Morielli AD, Peralta EG. The small GTP-binding protein RhoA regulates a delayed rectifier potassium channel. Cell. 1998;93:1077–1085. doi: 10.1016/S0092-8674(00)81212-X. - DOI - PubMed
    1. Pochynyuk O, Stockand JD, Staruschenko A. Ion channel regulation by Ras, Rho, and Rab small GTPases. Exp. Biol. Med. 2007;232:1258–1265. doi: 10.3181/0703-MR-76. - DOI - PubMed
    1. Chinigo, G., Pla, A. F. & Gkika, D. TRP Channels and Small GTPases Interplay in the Main Hallmarks of Metastatic Cancer. Front. Pharmacol.11, 581455 (2020). - PMC - PubMed
    1. Staruschenko A, et al. Rho small GTPases activate the epithelial Na+ channel. J. Biol. Chem. 2004;279:49989–49994. doi: 10.1074/jbc.M409812200. - DOI - PubMed

Publication types