. 2023 Jun 23;14(1):3761.
doi: 10.1038/s41467-023-39291-x.

NFIC regulates ribosomal biology and ER stress in pancreatic acinar cells and restrains PDAC initiation

Affiliations

NFIC regulates ribosomal biology and ER stress in pancreatic acinar cells and restrains PDAC initiation

Isidoro Cobo et al. Nat Commun. .

Abstract

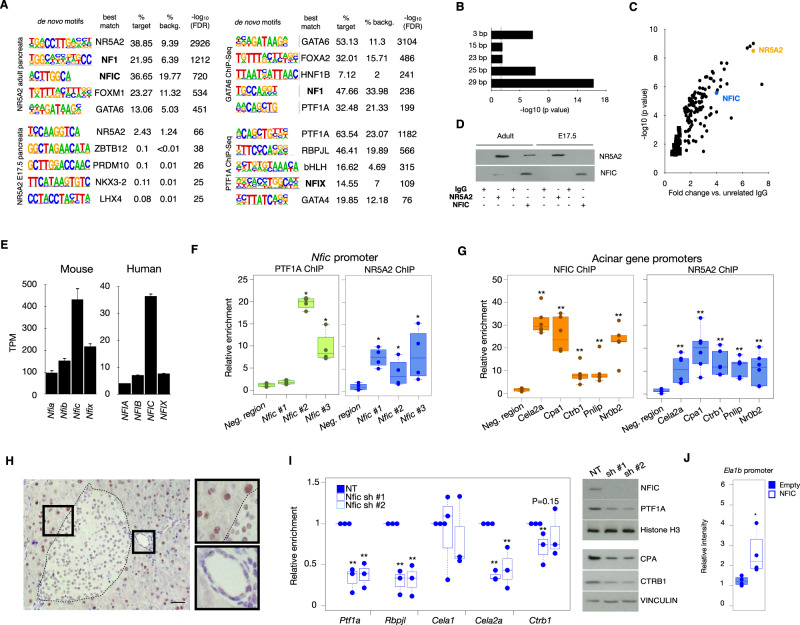
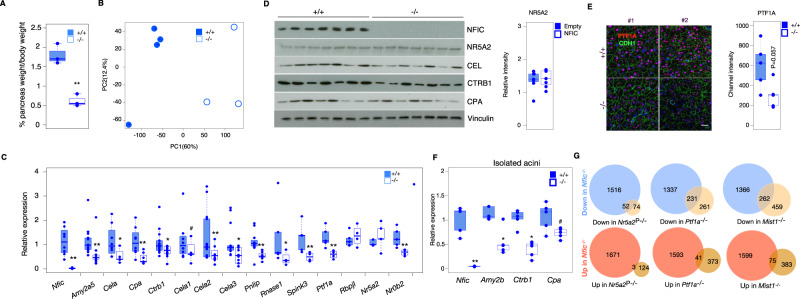
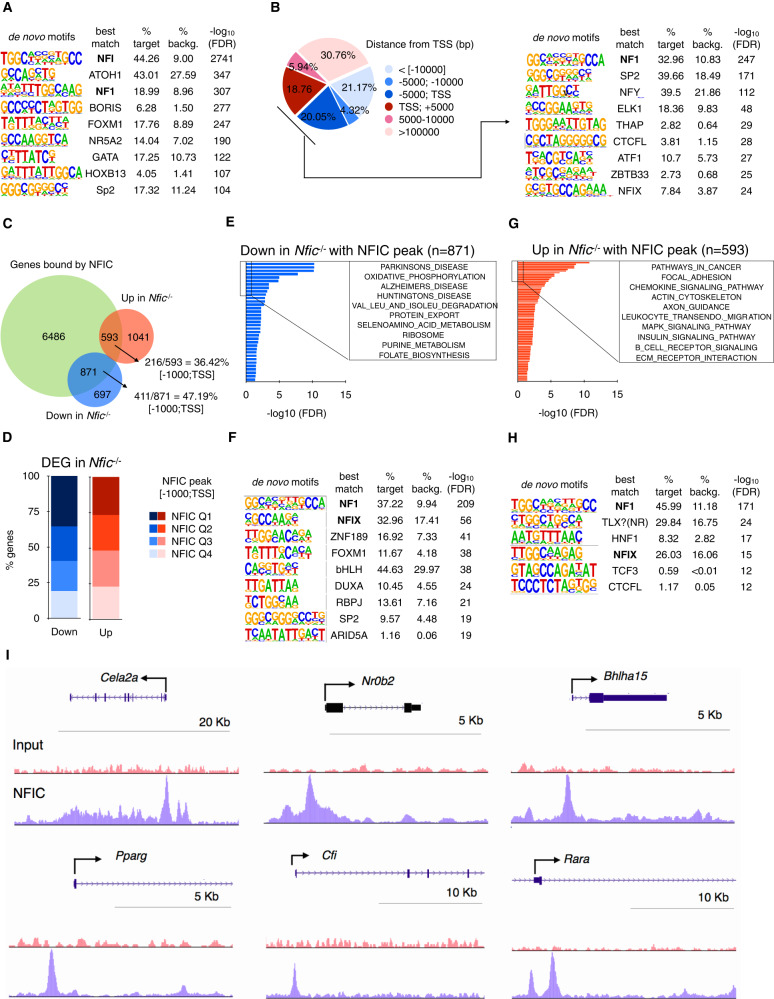
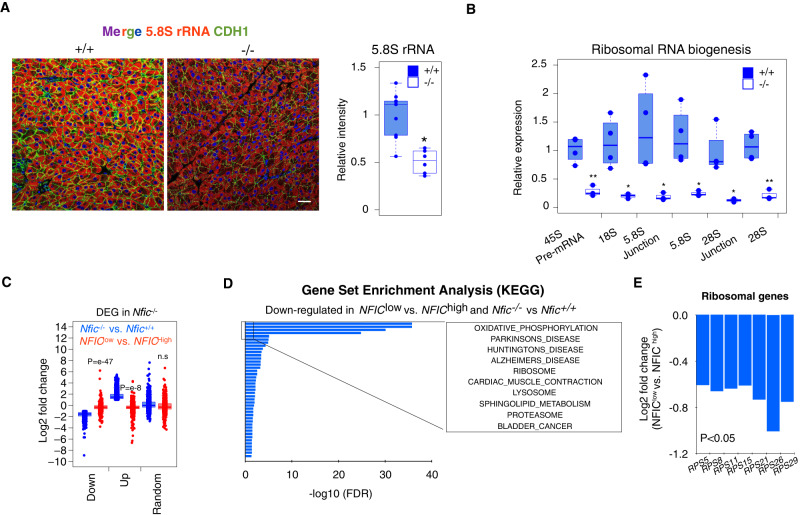
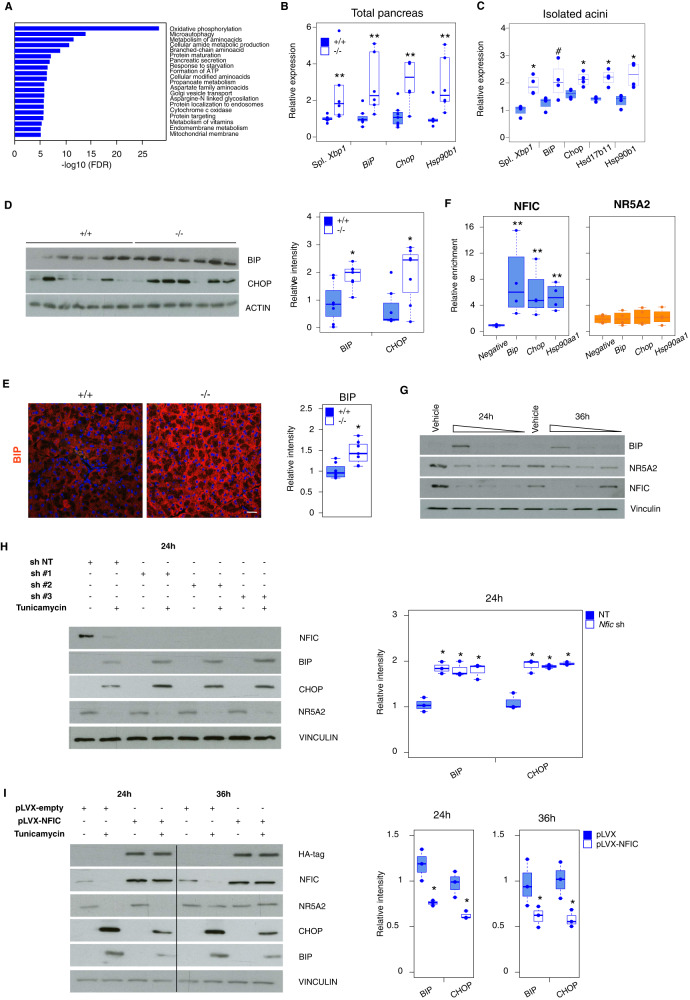
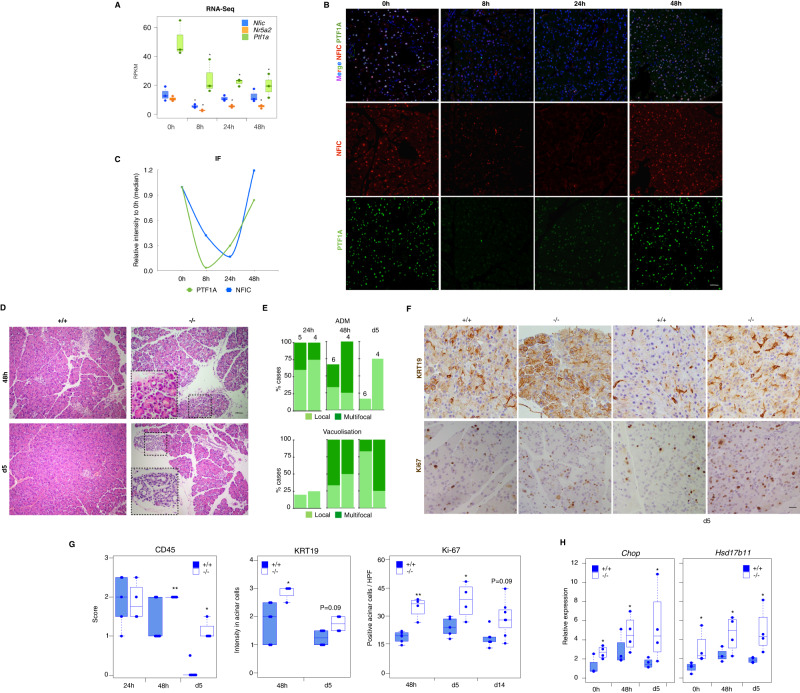
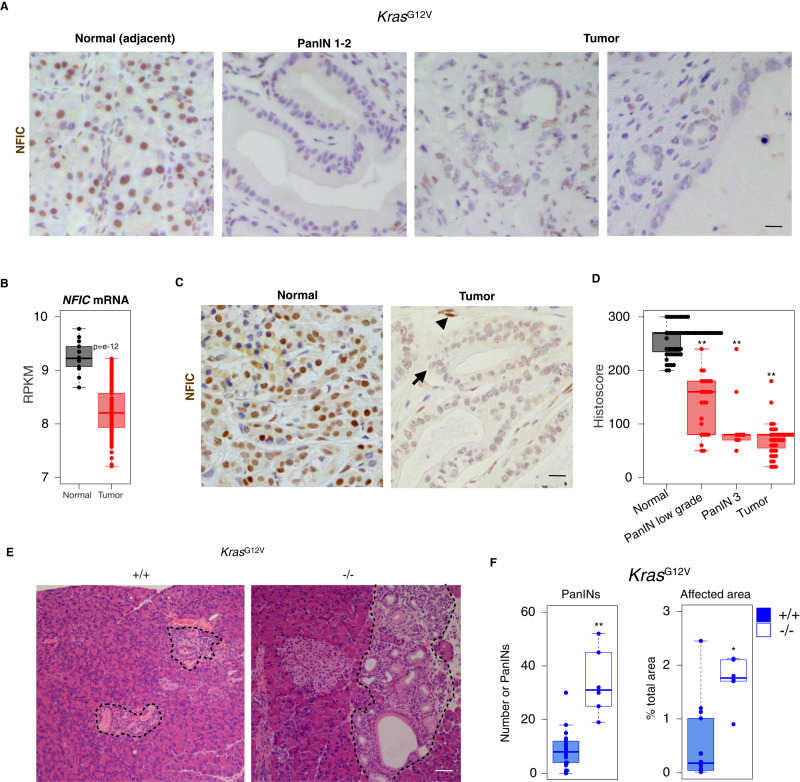
Pancreatic acinar cells rely on PTF1 and other transcription factors to deploy their transcriptional program. We identify NFIC as a NR5A2 interactor and regulator of acinar differentiation. NFIC binding sites are enriched in NR5A2 ChIP-Sequencing peaks. Nfic knockout mice have a smaller, histologically normal, pancreas with reduced acinar gene expression. NFIC binds and regulates the promoters of acinar genes and those involved in RNA/protein metabolism, and Nfic knockout pancreata show defective ribosomal RNA maturation. NFIC dampens the endoplasmic reticulum stress program through binding to gene promoters and is required for resolution of Tunicamycin-mediated stress. NFIC is down-regulated during caerulein pancreatitis and is required for recovery after damage. Normal human pancreata with low levels of NFIC transcripts display reduced expression of genes down-regulated in Nfic knockout mice. NFIC expression is down-regulated in mouse and human pancreatic ductal adenocarcinoma. Consistently, Nfic knockout mice develop a higher number of mutant Kras-driven pre-neoplastic lesions.


Conflict of interest statement

The authors declare no competing interests.

Figures

Fig. 1
Fig. 1. NFIC is an NR5A2 interactor and an acinar regulator.
A HOMER de novo motif analysis for NR5A2, PTF1A and GATA6 ChIP-Seq in mouse pancreata showing enrichment in NF1/NFI motifs. B SpaMo analysis showing distance conservation of the NR5A2 and NFIC motifs in the regions bound by NR5A2. C IP-MS analysis using lysates from normal mouse pancreas reveals that NFIC is among the top NR5A2 interactors identified (one-tailed T-test with a permutation-based FDR control was used for statistical analysis). D Immunoprecipitation-western blotting analysis showing that NFIC and NR5A2 are part of the same complex in adult, but not in embryonic, pancreas (one representative image of 2 independent experiments shown). E Expression of NFI transcripts in mouse (left panel, n = 4 replicates) or human (right panel, GTEX n = 328 samples) pancreata assessed by RNA-Seq showing that NFIC is the family member expressed at highest levels. F ChIP-qPCR shows binding of NR5A2 and PTF1A at the Nfic promoter (one region in NR5A2 peak1 and two regions in NR5A2 peak3), compared to a control (Neg) region (normalized to unrelated IgG) (n = 4/group, two-tailed Mann–Whitney U-test) (Nfic #1: PTF1A, P = 0.3429; NR5A2, P = 0.028) (Nfic #2: PTF1A, P = 0.028; NR5A2, P = 0.048) (Nfic #3: PTF1A, P = 0.028; NR5A2, P = 0.028). G ChIP-qPCR of NR5A2 and NFIC binding to the promoter of digestive enzyme genes and Nr0b2; controls as in panel F (n = 6/group, two-tailed Mann-Whitney U-test) (NR5A2 ChIP: Cela, Cpa1, Ctrb1, Pnlip and Nr0b2, P = 0.002; NFIC ChIP: Cela, Ctrb1, Pnlip and Nr0b2, P = 0.002; Cpa1, P = 0.005). H IHC analysis of NFIC expression in normal adult mouse pancreas showing higher expression in acinar cells and lower expression in endocrine and ductal cells (insets) (One representative image of 4 replicates is shown, scale bar = 10 μm). I Lentiviral Nfic knockdown in 266-6 cells showing reduced expression of transcripts coding for digestive enzyme transcripts and pancreatic TFs (RT-qPCR) (left panel, two-tailed Mann–Whitney U-test); western blotting analysis of the corresponding samples interfered with non-targeting (NT) or Nfic-targeting shRNAs (n = 3/group; one representative image of 3 independent experiments is shown). (Ptf1a in Nfic sh#1, P = 0.003 and in Nfic sh#2, P = 0.002; Rbpjl in Nfic sh#1, P = 0.0001 and in Nfic sh#2, P = 0.0004; Cela2a in Nfic sh#1, P = 0.0012 and in Nfic sh#2, P = 0.009; Ctrb1 in Nfic sh#1, P = 0.01 and in Nfic sh#2, P = 0.15). J Ela1b-luciferase promoter-reporter analysis shows increased activity upon expression of NFIC in HEK293 cells (n = 4/group) (P = 0.029). Barplots are presented as mean values +/− SD. Boxplots show the minimum, the maximum, the sample median, and the first and third quartiles. Source data are provided as a Source Data file.
Fig. 2
Fig. 2. NFIC is required for normal acinar cell differentiation.
A The pancreas of Nfic-/- mice has a reduced relative size (n = 3/group, two-tailed Student T-Test, P = 0.0013). B Principal component analysis of the RNA-Seq transcriptomes from WT and Nfic-/- mice. C RT-qPCR showing reduced expression of transcripts coding for digestive enzymes and pancreatic TF in Nfic-/- pancreata [n = 3/group; P < 0.1 (#), P < 0.05 (*), P < 0.01 (**), two-tailed Mann Whitney U-Test. Nfic, P = 0.0015; Amy2a5, P = 0.0006; Cela, P = 0.011; Cpa, P = 0.009; Ctrb1, P = 0.034; Cela1, P = 0.2187; Cela2, P = 0.024; Cela3, P = 0.028; Pnlip, P = 0.003; Rnase1, P = 0.25; Spink3, P = 0.035; Ptf1a, P = 0.015; Rbpjl, P = 0.73; Nr5a2, P = 0.015; Nr0b2, P = 0.035]. D Western blotting showing reduced expression of digestive enzymes, but not NR5A2 (P = 0.654), in Nfic-/- pancreata (n = 7/group). E IF analysis of the expression of PTF1A in pancreatic epithelial CDH1+ cells of Nfic WT and KO mice. (Scale bar = 10 μm). Fluorescence quantification shown in the accompanying bar graph (P = 0.03, two-tailed Student T-test). Densitometric quantification of panel 3B: band intensity normalized to loading control, relative to wild-type pancreata (n = 5/group). F RT-qPCR showing reduced expression of transcripts coding for digestive enzymes in primary acini from Nfic-/- mice [n = 5/group, P < 0.1 (#), P < 0.05 (*), P < 0.01 (**); two-tailed Mann–Whitney U-test. Nfic, P = 0.008; Amy2b, P = 0.015; Ctrb1, P = 0.007; Cpa, P = 0.095]. G Comparison of the overlap of DEG in the pancreas of Nfic-/- vs. that of mice lacking NR5A2, PTF1A, and MIST1 (details in text). Statistics: two-tailed Student T-test. Significant overlap is shown for downregulated genes compared to a random list of genes. “N-1” chi-squared test was used to calculate statistical significance. Barplots are presented as mean values +/− SD. Boxplots show the minimum, the maximum, the sample median, and the first and third quartiles. Source data are provided as a Source Data file.
Fig. 3
Fig. 3. NFIC binds to genomic regions associated to genes involved in acinar differentiation, ER stress, UPR, and inflammation.
A De novo motif analysis of NFIC ChIP-Seq peaks showing NFI as the top-motif; bHLH, NR5A2 and GATA are among the additional top motifs. B Distribution of NFIC ChIP-Seq peaks showing binding to regions close to the TSS (left) and the corresponding enrichment of the NFI, ELK and CTCF motifs (right). C Venn diagram showing the overlap between genes with an NFIC peak and those de-regulated in the Nfic-/- pancreas showing a greater overlap for the down-regulated genes. D Bar graph of the distribution of NFIC ChIP-Seq peaks based on score intensity and the overlap with genes de-regulated in Nfic-/- pancreata showing slight greater overlap in Q1, Q2 for the down-regulated genes. EH Gene set enrichment analysis of genes bound by NFIC and down-regulated (E) or up-regulated (F) in Nfic-/- pancreata showing downregulation of bona fide acinar, ribosomal, and metabolic genes and up-regulation of pathways related to inflammation and signaling. Motif analysis of genes with an NFIC peak that are down-regulated (G) or up-regulated (H) in Nfic-/- pancreata: NFI is the top motif in both groups. I UCSC browser shots of NFIC ChIP-Seq data showing enrichment at the Cela2a, Nr0b2, Bhlha15, Pparg, Cfi, and Rara loci. Source data are provided as a Source Data file.
Fig. 4
Fig. 4. NFIC regulates aspects of protein biosynthesis in the pancreas.
A IF analysis with an antibody recognizing 5.8 S rRNA and CDH1 shows decreased expression of both in Nfic-/- acinar cells. (Scale bar = 5 μm). Quantification is shown in the accompanying panel (n ≥ 6/group, P < 0.05 (*), two-tailed Mann–Whitney U-test) (P = 0.038). B RT-qPCR analysis showing altered ribosomal RNA maturation in Nfic-/- pancreata (n = 4/group; P < 0.01 (**), two-tailed Student T-test) (18S, P = 0.01); 5.8S Junction, P = 0.04; 5.8S, P = 0.01; 28S Junction, P = 0.01; 28S, P = 0.002; 45S, P = 0.003. C Boxplot plot displaying the relationship between the expression of upregulated, down-regulated, or a random set of genes, in control Nfic+/+ vs. Nfic-/- mice and in histologically normal human pancreatic tissues samples [top 10 low- vs. top 10 high- NFIC expressing samples, as determined by RNA-Seq analysis (NFIClow vs. NFIChigh)]. Data shows the concordant pattern between down-regulated genes in Nfic-/- mice and NFIClow human pancreata. “N-1” two-tailed chi-squared test was used to calculate statistical significance. The P-value was calculated comparing to a random gene list. D GSEA for genes that are concurrently down-regulated in Nfic-/- vs. WT pancreata and in NFIClow vs. NFIChigh human pancreata. Genes were computed with KEGG data sets showing the similarities with those gene sets under-represented in Nfic-/- mice. E Bar plot displaying the lower expression of genes coding for ribosomal proteins in NFIClow vs. NFIChigh human pancreata (RPS5, P = 3.1 e-4; RPS8, P = 5.2 e-5; RPS11, P = 4.1 e-4; RPS15, P = 7.3 e-4; RPS21, P = 4.6 e-7; RPS26, P = 8.2 e-3; RPS29, P = 5.3 e-4; an integration of Fisher’s exact test and likelihood ratio were used to calculate statistical significance). Barplots are presented as mean values +/− SD. Boxplots show the minimum, the maximum, the sample median, and the first and third quartiles. Source data are provided as a Source Data file.
Fig. 5
Fig. 5. NFIC regulates UPR and ER stress resolution.
A GSEA analysis of the UPR and ER stress gene sets down-regulated in Nfic-/- pancreata and up-regulation of UPR. B, C RT-qPCR analysis of ER stress-related transcripts in WT and Nfic-/- pancreata (n 6/group) (B) and in freshly isolated acini (n 3/group) (C). Two-tailed Mann–Whitney U-test was used to calculate statistical significance in B and C, except for BiP in C where two-tailed Student T-test was used (B Xbp1 spliced, P = 0.0038; BiP, P = 0.009; Chop, P = 0.008; Hsp90b1, P = 0.0101) (C Xbp1 spliced, P = 0.028; BiP, P = 0.005; Chop, P = 0.008; Hsd17b11, P = 0.028; Hsp90b, P = 0.01). D Western blotting showing up-regulation of BIP and CHOP in Nfic-/- pancreata (n = 7/group) (two-tailed Mann–Whitney U-test; BiP, P = 0.0175; CHOP, P = 0.047). Bar graph with densitometric quantification of data. E IF analysis of BIP in wild type and Nfic-/- pancreata (n ≥ 7/group). Boxplot shows quantification of the BIP expression intensity in WT and Nfic-/- pancreata. Individual dots correspond to the average of at least 15 images for each pancreas, scale bar = 10 μm. F ChIP-qPCR showing binding of NFIC, but not NR5A2, to the promoters of Hspa5/Bip-1, Ddit3 and Hsp90aa1 (n = 4) (two-tailed Mann–Whitney U-test; BiP, Chop and Hsp90aa1, P = 0.0286 in the NFIC ChIP). G 266-6 cells incubated for 24 h or 36 h with vehicle or increasing TM concentrations (10 nM, 1 nM, 0.1 nM). Data shows the up-regulation of BIP and the down-regulation of NFIC by 24/36 h and the down-regulation of NR5A2 by 24 h in TM-treated cells (one of three independent experiments is shown). H Up-regulation of BIP and CHOP in 266-6 cells treated with TM upon Nfic knockdown. Boxplot shows quantification of data (n = 3 replicates/group) [two-tailed Student T-test; BiP in Nfic sh#1, P = 0.002; in Nfic sh #2, P = 0.004; in Nfic sh #3, P = 0.005. Chop in Nfic sh #1, P = 0.0038; in Nfic sh #2, P = 0.002; in Nfic sh #3, P = 0.001]. I Reduced BIP and CHOP expression in control and NFIC-overexpressing 266-6 cells treated with TM [two-tailed Student T-test; 24 h: BiP, P = 0.01; CHOP, P = 0.02; 36 h: BiP, P = 0.04; CHOP, P = 0.03]. Boxplots show quantification of data (n = 3 replicates/group). P < 0.1 (#), P < 0.05 (*), P < 0.01 (**); two-tailed Mann–Whitney U-test to calculate the significance in all panels. Boxplots show the minimum, the maximum, the sample median, and the first and third quartiles. Source data are provided as a Source Data file.
Fig. 6
Fig. 6. NFIC is dynamically regulated during acute caerulein pancreatitis and is required for a homeostatic recovery.
A RNA-Seq analysis of Nfic, Nr5a2, and Ptf1a expression in wild-type mice upon induction of a mild acute pancreatitis (n = 3/group). Significance was calculated compared to expression at 0 h (P < 0.05 (*) (T-test analogical method; Nfic at 8 h, P = 0.014; at 24 h, P = 0.45; at 48 h, P = 0.54; Nr5a2 at 8 h, P = 0.023; at 24 h, P = 0.033; at 48 h, P = 0.036; Ptf1a at 8 h, P = 0.012; at 24 h, P = 0.027; at 48 h, P = 0.034). B IF analysis of NFIC and PTF1A upon pancreatitis induction showing NFIC down-regulation (n = 4/group, scale bar = 20μm). C Quantification of PTF1A+ and NFIC+ cells in wild-type mice during pancreatitis. D Histological analysis of wild-type and Nfic-/- pancreata 48 h and 5 days after the induction of pancreatitis showing increased damage in mutant mice (n 4/condition, scale bar = 20 μm). E Pancreatitis scoring shows impaired recovery of Nfic-/- mice at 48 h and day 5 (n 4/condition). Damage was scored as (0–3) for each parameter analyzed (n = 4/group). F, G IHC reveals increased expression of KRT19, a higher number of KI67+ acinar cells, and increased infiltration by CD45+ cells in Nfic-/- pancreata. Representative images are shown in (F), (scale bar = 10 μm); quantification of CD45, KRT19 and Ki67 expression (G) as described in Methods [n = 5/ group; P < 0.1 (#), P < 0.05 (*), P < 0.01 (**); two-tailed Mann–Whitney U-test. CD45: at 24 h, P = 1; at 48 h, P = 0.061; at day 5, P = 0.008). KRT19: at 48 h, P = 0.021; at day 5, P = 0.049. KI-67: at 24 h, P = 0.009; at 48 h, P = 0.038; at day 14, P = 0.059]. H RT-qPCR expression analysis showing up-regulation of Ddit3 and Hsd17b11 in Nfic-/- pancreata in basal conditions and after induction of an acute pancreatitis (n = 4 mice/group). Chop: at 0 h, P = 0.034; at 48 h, P = 0.046; at day 5, P = 0.057; Hsd17b11: at 0 h, P = 0.028; at 48 h, P = 0.057; at day 5, P = 0.028. Data are presented as mean values +/− SD. P < 0.05 (*). Source data are provided as a Source Data file.
Fig. 7
Fig. 7. NFIC restrains the formation of preneoplastic lesions in the pancreas.
A IHC analysis of NFIC expression shows down-regulation in PanINs (right) and tumor cells compared to adjacent normal acinar cells (left) (one representative image of 5 replicates is shown, scale bar = 5 μm). B NFIC mRNA analysis of tumor samples and normal adjacent tissue assessed by microarrays showing reduced expression in tumor samples (n = 14 for normal tissue and n = 118 for tumor, P = e-12, two-tailed Mann–Whitney U-test). C, D IHC analysis of NFIC expression in human PDAC specimens showing reduced expression in tumoral cells (arrow) compared to normal adjacent tissue or stromal cells (arrowheads) (n = 56 for normal; n = 25 for PanIN1-2; n = 9 for PanIN-3; n = 43 for tumor; scale bar = 5 μm). Two-tailed Mann–Whitney U-test; PanIN1-2 vs. Normal, P = 1.666e-12; PanIN3 vs. Normal, P = 0.000004; Tumor vs. Normal, P = 2.2e-16. E, F Histological analysis of the pancreas of 14–20 week-old Kras G12Vor Kras; G12VNfic-/- mice showing increased number of PanINs and of the relative area occupied by pre-neoplastic lesions (n 6/genotype, scale bar = 20 μm). Two-tailed Mann–Whitney U-test; in F (# PanIN P = 0.0007; affected area P = 0.007). D, F Boxplots show the minimum, the maximum, the sample median, and the first and third quartiles. P < 0.05 (*), P < 0.01 (**). Source data are provided as a Source Data file.

Similar articles

Cited by

References

    1. Pandol, S. J. The Exocrine Pancreas (Morgan & Claypool Life Sciences, 2012). - PubMed
    1. Rose SD, Swift GH, Peyton MJ, Hammer RE, MacDonald RJ. The role of PTF1-P48 in pancreatic acinar gene expression. J. Biol. Chem. 2001;276:44018–44026. doi: 10.1074/jbc.M106264200. - DOI - PubMed
    1. Beres TM, et al. PTF1 is an organ-specific and Notch-independent basic helix-loop-helix complex containing the mammalian Suppressor of Hairless (RBP-J) or its paralogue, RBP-L. Mol. Cell. Biol. 2006;26:117–130. doi: 10.1128/MCB.26.1.117-130.2006. - DOI - PMC - PubMed
    1. Martinelli P, et al. Gata6 is required for complete acinar differentiation and maintenance of the exocrine pancreas in adult mice. Gut. 2013;62:1481–1488. doi: 10.1136/gutjnl-2012-303328. - DOI - PubMed
    1. Pin CL, Rukstalis JM, Johnson C, Konieczny SF. The bHLH transcription factor Mist1 is required to maintain exocrine pancreas cell organization and acinar cell identity. J. Cell Biol. 2001;155:519–530. doi: 10.1083/jcb.200105060. - DOI - PMC - PubMed

Publication types