. 2023 Jun 23;9(1):189.
doi: 10.1038/s41420-023-01481-3.

Role of liensinine in sensitivity of activated macrophages to ferroptosis and in acute liver injury

Affiliations

Role of liensinine in sensitivity of activated macrophages to ferroptosis and in acute liver injury

Jing Li et al. Cell Death Discov. .

Abstract

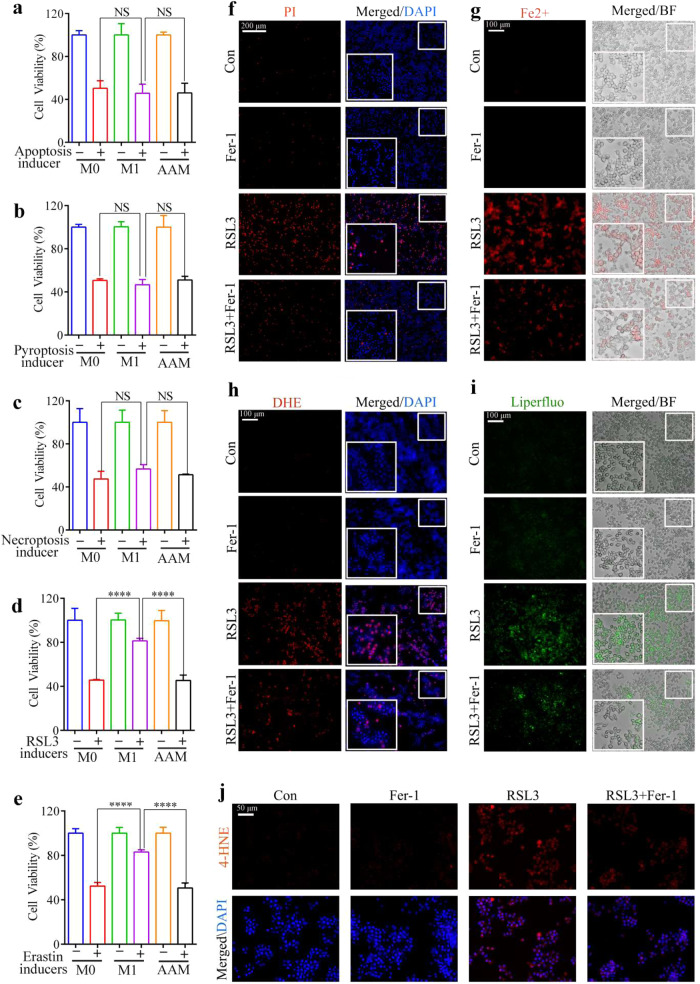
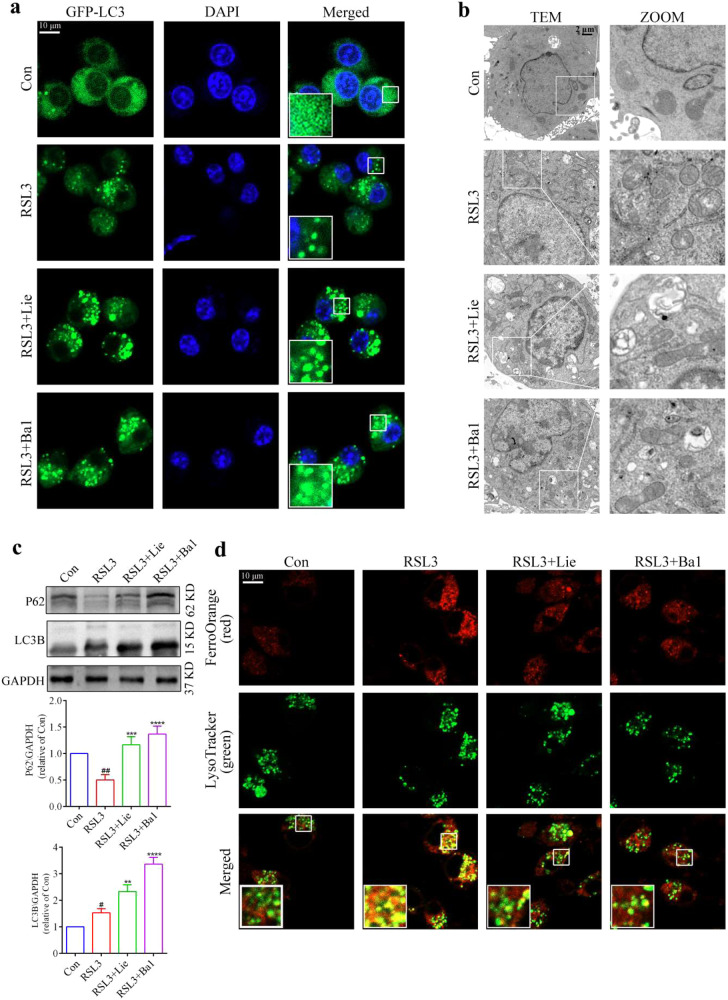
Acute liver injury (ALI) is an acute inflammatory liver disease with a high mortality rate. Alternatively, activated macrophages (AAMs) have been linked to the inflammation and recovery of ALI. However, the mechanism underlying AAM death in ALI has not been studied sufficiently. We used liensinine (Lie) as a drug of choice after screening a library of small-molecule monomers with 1488 compounds from traditional Chinese remedies. In ALI, we evaluated the potential therapeutic effects and underlying mechanisms of action of the drug in ALI and found that it effectively inhibited RSL3-induced ferroptosis in AAM. Lie significantly reduced lipid peroxidation in RSL3-generated AAM. It also improved the survival rate of LPS/D-GalN-treated mice, reduced serum transaminase activity, suppressed inflammatory factor production, and may have lowered AAM ferroptosis in ALI. Lie also inhibited ferritinophagy and blocked Fe2+ synthesis. Following combined treatment with RSL3 and Lie, super-resolution microscopy revealed a close correlation between ferritin and LC3-positive vesicles in the AAM. The co-localization of ferritin and LC3 with LAMP1 was significantly reduced. These findings suggest that Lie may ameliorate ALI by inhibiting ferritinophagy and enhancing AMM resistance to ferroptosis by inhibiting autophagosome-lysosome fusion. Therefore, Lie may be used as a potential therapeutic agent for patients with ALI.


Conflict of interest statement

The authors declare no competing interests.

Figures

Fig. 1
Fig. 1. Sensitivity of alternatively activated macrophages to lipid peroxidation-driven ferroptosis.
ae CCK-8 assay for cell viability after the treatment of macrophages (M0, M1, AAM) with the apoptosis inducer (20 μM, 24 h), pyroptosis inducers (7 μg/ml, 24 h), necrosis inducer (4×, 24 h), RSL3 inducer (5 μM, 5 h), and erastin inducer (60 μM, 24 h). fi AAM was treated with RSL3 (5 μM, 5 h) in the presence or absence of Fer-1 (400 nM). f PI staining to assess cell death, Scale bar = 200 µm. g Live cell fluorescence imaging to detect lipid peroxide production using Liperfloo, Scale bar = 100 µm. h Live cell fluorescence imaging of FerroOrange (red), Scale bar = 100 µm. i Fluorescence imaging of the superoxide anion fluorescence detection probe Dihydroethidium (DHE), Scale bar = 100 µm. j Expression of the 4-hydroxynonenal (4-HNE) protein was measured by immunofluorescence, Scale bar = 50 µm. Results were presented as mean ± SD. (n = 3, ****p < 0.0001. Con control, NS not significant).
Fig. 2
Fig. 2. Fer-1 attenuates liver injury induced by LPS/D-GalN in mice, accompanied by increased numbers of alternatively activated macrophages.
a Liver injury was assessed using histopathology and hematoxylin and eosin (H&E) staining, Scale bar = 100 µm. b, c The levels of AST and ALT in serum. dg Serum content of TNF-α, IL-6, IL-1β, and HMGB1. h Transmission electron microscopy (TEM) shows a representative liver tissue image, Scale bar = 2 μm. i Representative fluorescence imaging of the superoxide anion fluorescence detection probe dihydroethidium (DHE) in liver tissue, Scale bar = 50 µm. j, k Assessment of MDA and GSH contents in liver tissue. l Expression of iNOS and CD206 was detected using immunocytochemistry in the liver tissue, Scale bar = 100 µm. Results were presented as mean ± SD (n = 5). (##p < 0.01, vs. Con. **p < 0.01, vs. D-GalN/LPS. Con Control, NS not significant).
Fig. 3
Fig. 3. Use of the traditional Chinese medicine liensinine against alternatively activated macrophage ferroptosis in vitro.
a Schematic of the drug-screening program. b AAM was treated with the 1488 candidates in combination with RSL3 (5 μM) for 5 h, and cell viability was measured using the CCK-8 assay kit. Each point represents the percentage of cell viability for a concentration of 10 μM of the candidate compound. c Chemical structure diagram of liensinine (Lie). d CCK-8 assay for cell viability. e Amount of LDH in the cell supernatant. f PI staining to assess cell death, Scale bar = 200 µm. g Live cell fluorescence imaging of FerroOrange (red), Scale bar = 100 µm. h Fluorescence imaging of the superoxide anion fluorescence detection probe dihydroethidium (DHE), Scale bar = 100 µm. i Live cell fluorescence imaging using Liperfloo, Scale bar = 100 µm. j Expression of the 4-HNE protein was measured by immunofluorescence, Scale bar = 50 µm. k Representative electron micrograph image of cells, Scale bar = 2 μm. Results were presented as mean ± SD. (n = 3, ####p < 0.0001, vs. Con. *p < 0.05, ***p < 0.001, vs. RSL3. Con Control, NS not significant).
Fig. 4
Fig. 4. Liensinine treatment attenuates LPS/D-GalN-induced pathological liver injury and inflammatory responses in mice.
a Survival was monitored over a 24 h period (n = 10/group). b, c Serum ALT and AST levels. d Histopathology, hematoxylin, and eosin (H&E) staining, Scale bar = 100 µm. eh Determination of the levels of the inflammatory factors HMGB1, TNF-α, IL-6, and IL-1β in mice sera. i Expression of iNOS and CD206 in liver tissue was detected by immunofluorescence, Scale bar = 50 µm. Results were presented as mean ± SD (n = 5). (##p < 0.01, vs. Con. *p < 0.05, **p < 0.01, ****p < 0.0001, vs. LPS/D-GalN. Con control, NS not significant).
Fig. 5
Fig. 5. Liensinine inhibits LPS/D-GalN-induced alternatively activated macrophage ferroptosis in mice.
a, b Assessment of GSH and MDA contents in liver tissues. (##p < 0.01, vs. Con. **p < 0.01, vs. LPS/D-GalN. Con Control). c Superoxide anion fluorescence detection probe dihydroethidium (DHE) was used to assess the level of ROS in the liver, Scale bar = 50 µm. d Representative electron micrograph of liver tissue, Scale bar = 2 µm. e Fluorescence analysis showing the co-localization of iNOS (green) with 4-HNE (red) in the liver, Scale bar = 10 µm. f Fluorescence analysis showing the co-localization of CD206 (green) with 4-HNE (red) in the liver, Scale bar = 10 µm. fh Macrophages were depleted by intraperitoneal injections of clodronate liposomes (CLs) for 48 h. Mice-depleted macrophages were treated with Lie (60 mg/kg) intraperitoneally for 2 h and then injected with LPS/D-GalN for 6 h, after which the liver and blood were collected for subsequent experiments (n = 5/group). f Histopathology, hematoxylin, and eosin (H&E) staining, Scale bar = 100 µm. g, h Assessment of GSH and MDA contents in the mice sera. im Assessment of serum inflammatory factors IL-1β, IL-6, HMGB1, and TNF-α. Results were presented as mean ± SD (n = 5). (*p < 0.05, **p < 0.01. Con control).
Fig. 6
Fig. 6. Liensinine inhibits ferritinophagy to inhibit alternatively activated macrophage ferroptosis.
a EGFP-LC3 spot aggregation was observed under confocal microscopy, Scale bar = 10 µm (n = 3). b Expression of autophagy-related proteins LC3B-I, LC3B-II, and P62 was detected using western blots. c Representative electron micrograph image, Scale bar = 2 µm (n = 3). d Representative immunofluorescence images of FerroOrange (red) and LysoTracker Green (green) were used to examine the subcellular localization of Fe2+ in cells, Scale bar = 10 µm. Results were presented as mean ± SD. (n = 3, ##p < 0.01, #p < 0.05, vs. Con. **p < 0.01, ***p < 0.001, ****p < 0.0001, vs. RSL3. Con Control, NS not significant).
Fig. 7
Fig. 7. Liensinine induces ferritinophagic flux alterations by blocking autophagosome-lysosome fusion in alternatively activated macrophages.
a Confocal microscopy images of the co-localization of ferritin (red) with LAMP1 (green), Scale bar = 100 µm (n = 3). b Confocal microscopy images of the co-localization of ferritin (red) with GFP-LC3 (green), Scale bar = 10 µm (n = 3). c Confocal microscopy images of immunostained GFP-LC-3 (green) and LAMP1 (red), Scale bar = 10 µm (n = 3). d Confocal microscopy images of LysoTracker Green (red) and GFP-LC3 (green), Scale bar = 10 µm (n = 3).

Similar articles

Cited by

References

    1. Kakisaka K, Suzuki Y, Takikawa Y. Disease severity of acute liver injury caused by drug-induced liver injury may affect the response to corticosteroid therapy. Liver Int. 2020;40:1781. doi: 10.1111/liv.14338. - DOI - PubMed
    1. Gowda C, Newcomb CW, Liu Q, Carbonari DM, Lewis JD, Forde KA, et al. Risk of acute liver injury with antiretroviral therapy by viral hepatitis status. Open Forum Infect Dis. 2017;4:x12. doi: 10.1093/ofid/ofx012. - DOI - PMC - PubMed
    1. Puri P, Lee WM, Fontana RJ, Kim NK, Durkalski V, McGuire BM, et al. Alcohol consumption is associated with the severity and outcome of acute liver injury/failure. Liver Int. 2020;40:360–7. doi: 10.1111/liv.14327. - DOI - PubMed
    1. Chen T, Li R, Chen P. Gut microbiota and chemical-induced acute liver injury. Front Physiol. 2021;12:688780. doi: 10.3389/fphys.2021.688780. - DOI - PMC - PubMed
    1. Perez RDGA, Kortgen A, Leonhardt J, Zipprich A, Bauer M. Critical care hepatology: definitions, incidence, prognosis, and role of liver failure in critically ill patients. Crit Care. 2022;26:289. doi: 10.1186/s13054-022-04163-1. - DOI - PMC - PubMed