. 2023 Jun 23;14(1):3742.
doi: 10.1038/s41467-023-39241-7.

Systems-level analyses of protein-protein interaction network dysfunctions via epichaperomics identify cancer-specific mechanisms of stress adaptation

Affiliations

Systems-level analyses of protein-protein interaction network dysfunctions via epichaperomics identify cancer-specific mechanisms of stress adaptation

Anna Rodina et al. Nat Commun. .

Abstract

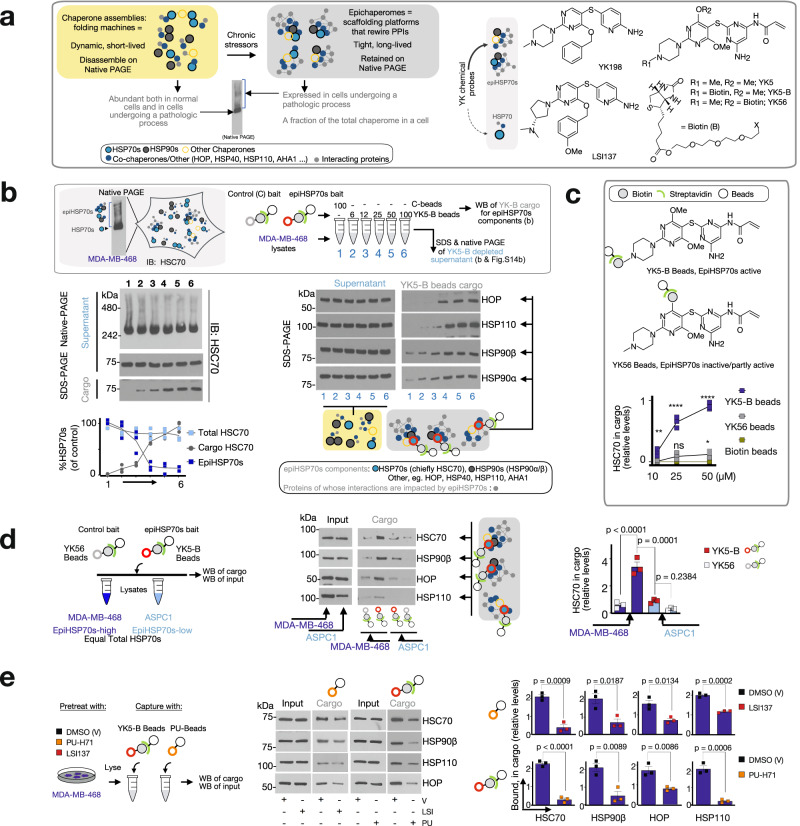
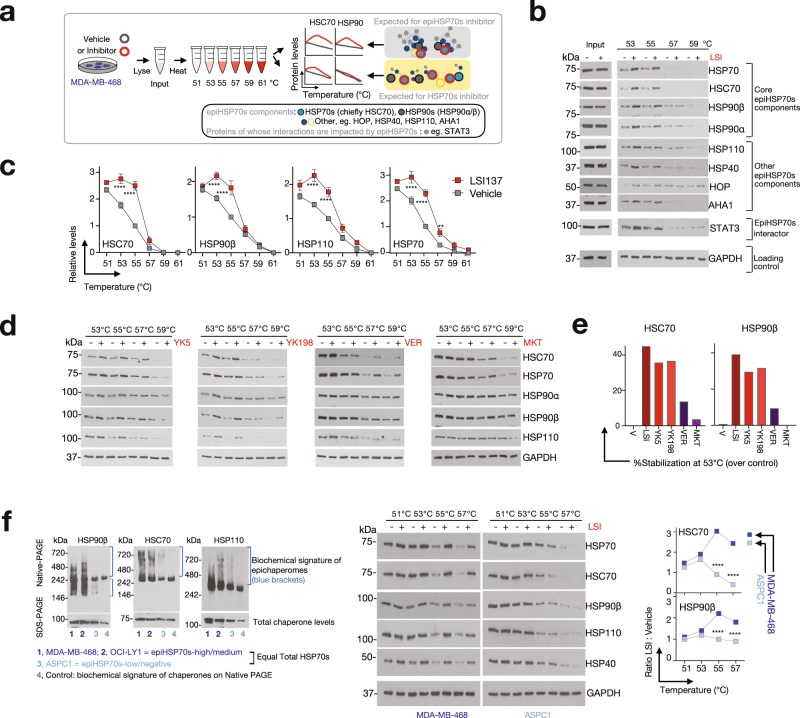
Systems-level assessments of protein-protein interaction (PPI) network dysfunctions are currently out-of-reach because approaches enabling proteome-wide identification, analysis, and modulation of context-specific PPI changes in native (unengineered) cells and tissues are lacking. Herein, we take advantage of chemical binders of maladaptive scaffolding structures termed epichaperomes and develop an epichaperome-based 'omics platform, epichaperomics, to identify PPI alterations in disease. We provide multiple lines of evidence, at both biochemical and functional levels, demonstrating the importance of these probes to identify and study PPI network dysfunctions and provide mechanistically and therapeutically relevant proteome-wide insights. As proof-of-principle, we derive systems-level insight into PPI dysfunctions of cancer cells which enabled the discovery of a context-dependent mechanism by which cancer cells enhance the fitness of mitotic protein networks. Importantly, our systems levels analyses support the use of epichaperome chemical binders as therapeutic strategies aimed at normalizing PPI networks.


Conflict of interest statement

Memorial Sloan Kettering Cancer Center holds the intellectual rights to this portfolio. Samus Therapeutics Inc, of which G.C. has partial ownership, and is a member of its scientific advisory board, has licensed the epichaperome portfolio. G.C., A.R. and T.T. are inventors on the licensed intellectual property. All other authors declare no competing interests.

Figures

Fig. 1
Fig. 1. Characterization of the epiHSP70s probes through affinity purification techniques.
a Schematic showing the biochemical and functional distinctions between epiHSP70s and HSP70s (left). Chemical structure of several YK-type ligands (right). See also Supplementary Figs. 1–13. b, c Affinity purifications with indicated probe concentrations performed in MDA-MB-468 cell homogenates. Data are presented as mean, two-way ANOVA, n = 3, p < 0.0001, F (2, 36) = 80.18 (b) and two-way ANOVA, n = 3, p < 0.0001, F (2, 18) = 390.4 (c), with Dunnett’s post-hoc. YK5-B versus Control, p = 0.0013, p < 0.0001 and p < 0.0001 and YK56 versus Control, p = 0.9796, p = 0.0655 and p < 0.0116 at 10, 25 and 50 µM, respectively. See also Supplementary Fig. 14a–c. d Epichaperome components captured by the YK5-B probe and the control probe YK56 in epiHSP70s-high (MDA-MB-468) and -low (ASPC1) cancer cells, which have equal total chaperone levels, as indicated. Data are presented as mean ± s.e.m., one-way ANOVA, n = 3, p < 0.0001, F (3, 8) = 49.61, with Tukey’s post-hoc. e EpiHSP70s components captured by the probes in cells pre-treated with vehicle, LSI137 (1 µM) or PU-H71 (1 µM), as indicated. Data are presented as mean ± s.e.m., n = 3, unpaired two-tailed t-test; df = 4; PU-beads: t = 8.878, 3.823, 4.226, and 12.50 and YK5-B beads: t = 16.04, 4.759, 4.802 and 9.947 for HSC70, HSP90β, HOP and HSP110, respectively. d, e Protein amount loaded for Input represents 10% of the protein amount incubated with the beads. Abbreviations: HSP90, heat shock protein 90; HSC70, heat shock cognate 70; HOP, HSP-organizing protein; AHA1, activator of HSP90 ATPase activity 1. Source data are provided as a Source Data file.
Fig. 2
Fig. 2. Characterization of the epiHSP70s probes through the cellular thermal shift assay (CETSA).
a CETSA outline for experiments in (be). Homogenates from cells treated with vehicle (DMSO) or inhibitors (LSI137, 10 µM; YK5, 20 µM; YK198, 25 µM; VER155008, 50 µM; MKT077, 20 µM) were aliquoted and heated to a range of temperatures. Detection of changes in protein stability for epiHSP70s component chaperones and co-chaperones was performed by Western blot analysis. b, c Representative gels (b) and melting curves (c) for vehicle- and LSI137-treated cells. Data are presented as mean ± s.e.m., two-way ANOVA, vehicle (V), n = 11, LSI137 (LSI), n = 5, p < 0.0001, F (1, 84) = 103.3, 38.04, 61.46 and 88.14 for HSC70, HSP90β, HSP110 and HSP70, Sidak’s post-hoc; p < 0.0001 for HSC70, HSP90β, HSP110 and HSP70 at 53 °C and 55 °C, LSI compared to V. Values normalized to those obtained for vehicle at 55 °C. See also Supplementary Fig. 15a, b. d Representative gels (n = 3 repeats) for cells treated as in (a) with vehicle-, YK5-, YK198-, VER155008 (VER)- and MKT077 (MKT). e Treatment-specific stabilization of epiHSP70s components in cell extracts heated at 53 °C, for experiments as in (a). Graph, mean values normalized to those obtained for Vehicle at 55 °C. f Comparative analysis of the stability of epiHSP70s component chaperones performed, as in (a), in epiHSP70s-high (MDA-MB-468) and epiHSP70s-low (ASPC1) cancer cells (see Native PAGE). Both cell lines have similar total levels of HSP70s and HSP90s (see SDS PAGE here, and see immunofluorescence further). Graph, mean (n = 3). Data are presented as mean ± s.e.m., two-way ANOVA, n = 3, p < 0.0001, F (1, 16) = 386.4 and 246.5 for HSC70 and HSP90, respectively. Sidak’s post-hoc, p < 0.0001 for HSC70 and HSP90β at 55 °C and 57 °C, MDA-MB-468 compared to ASPC1. Source data, along with relevant statistical analyses and analysis data, are provided as a Source Data file.
Fig. 3
Fig. 3. Characterization of the epiHSP70s probes through immunoprecipitation techniques.
a Experiment outline. See also Supplementary Fig. 15c. be Monitoring by SDS-PAGE (b), Native-PAGE (c) or immunoprecipitation with an anti-HSC70 antibody (d, e) followed by immunoblotting, of epiHSP70s components (i.e. constituent chaperones and co-chaperones, d) and of epiHSP70s interactor proteins (i.e. STAT3, e) in cells treated as in (a). Data in (b), graph, mean of indicated individual biological replicates (n = 6, time 0 h and n = 3 for each other time point). Data in (ce) are presented as mean ± s.e.m., n = 3 biological replicates, one-way ANOVA (c) HSC70: p = 0.0039, F (5, 12) = 6.465; HSP90β: p = 0.0024, F (5, 12) = 7.238; HOP: p = 0.0273, F (5, 12) = 3.787; (d) HSP90: p = 0.0083, F (5, 12) = 5.332; HOP: p = 0.0281, F (5, 12) = 3.751; and (e) STAT3: p = 0.0011, F (5, 12) = 8.693, with Dunnett’s post-hoc. β-actin, protein loading control; IgG, isogenic control. Source data are provided as a Source Data file.
Fig. 4
Fig. 4. Principles for the use of YKs in epichaperomics and as chemical probes to revert context-dependent epiHSP70s-mediated perturbations in PPI networks.
a In epichaperomics, a multitude of endogenous baits (i.e., the distinct epichaperome structures characteristic of a specific cellular context), each having individual interactors, are natively present. Chemical probes are needed to bind core, nucleating, epichaperome components (such as HSP70s) and trap these individual epiHSP70s bound to their interacting proteins, thus retaining interactions through subsequent isolation steps and enabling their unbiased identification by mass spectrometry (MS). These characteristics enable robust identification of interactors, increasing the likelihood to correctly assign the context-specific function of a given protein. By eliminating the need for exogenous introduction of a tagged protein as bait, epichaperomics is applicable for dissecting native cellular states, and thus appropriate for the analysis of both cultured cells and primary specimens. A bioinformatics pipeline was designed to: identify the proteins whose connectivity is pathologically altered via epiHSP70s in the specific biological context; construct the context-specific PPI network maps; derive biological insight on PPI network dysfunctions and the functional outcome of these PPI network dysfunctions. A decided advantage of the epichaperomics approach is that it investigates PPI network dysfunctions in disease. This directly informs on stressor-to-phenotype relationships and provides context-dependent insights into dysfunction, as opposed to standard proteomics which inform on changes in the levels of proteins. b Data support a biochemical mode of action with an initial trapping of the epichaperomes by YK, followed by a time dependent collapse of these assemblies, independent of the total expression of HSP70s. epiHSP70s disruption potentially reverts context-dependent perturbations in PPI networks, a process detrimental to cancer cell survival.
Fig. 5
Fig. 5. Quality control of the interactors isolated by the epiHSP70s probe.
a Experimental design to probe the utility and robustness of YK5-B in epichaperomics analyses. b Theoretical basis showing improved interactor identification and coverage for epichaperomics baits when compared to conventional affinity purification baits that do not differentiate between chaperones and epichaperomes. Coomassie blue stained SDS-PAGE of the eluted interactors captured by traditional antibody purification vs epichaperomics is shown on the right. MW, molecular weight marker; IgG, isogenic control. c Silver-stained gel of the protein cargo captured by YK5-B beads (at 1x or 2x YK5-B load). Cargo was washed with either binding buffer or high-salt buffer before being subjected to SDS-PAGE, as indicated in the schematic. The cargo captured by an HSP70s antibody is shown for reference. Gel images (b, c) are representative of three independent experiments. d Schematic showing the grading system implemented to stratify proteins identified by YK5-B capture. Source data are provided as Supplementary Data files.
Fig. 6
Fig. 6. Biological activity on YK-agents in a panel of cancer cells and in primary breast cancer explants in culture.
a Sensitivity of cancer cells (measured by ATP levels) to epiHSP70s (YK198) and epiHSP90s (PU-H71) disrupters (72 h treatment). 73 cancer cell lines encompassing the indicated 9 tumor types are presented. Data are mean of biological replicates (n = 3). Pie chart, % of cell lines sensitive or resistant to YK198. b Experimental design to probe epichaperome levels and YK-agent (YK5 at 5 µM or YK198 at 2.5 µM) sensitivity of individual breast cancer (BC) specimens. c As in (b) for epichaperome levels. H high, M medium, L low. The gel image shows representative primary tumors of individual BC patients (n = 8). d As in (b) for sensitivity. DMSO, vehicle control. Scale bar, %cell death. PT primary tumor. TNBC, triple-negative; HER2 + , HER2-positive; ER + PR + , estrogen receptor and progesteron receptor-positive BCs. e, f Representative cases as in (b) that contain BC cells along benign cells (i.e. lacking epichaperomes). TUNEL (e) and H&E (f) stained specimens. In (e), the control section of PT85 treated with vehicle (n = 2 explants) shows viable invasive ductal carcinoma (IDC) cells (red arrows) and apoptotic (~30%) IDC cells (black arrows). Following treatment with YK198 (n = 2 explants), there is a marked increase of apoptosis ( ~ 80%). A benign vessel (dark blue arrow) remains unaltered. In (f), the control section of PT19 treated with vehicle (left panel, n = 5 explants) displays viable IDC cells (red arrow heads) and apoptotic (~30%) IDC cells (black arrows heads) associated with a benign host lymphocytic infiltration. Following treatment with YK5 (n = 5 explants), there is a marked increase of apoptosis (~95%) (middle panel). Benign ducts (green arrows) and the surrounding host lymphocytes (light blue arrow) within the same section, remain unaltered and are surrounded by apoptotic IDC cells (inset, right panel). Arrows and arrowheads show representative cells. Scale bar, black, 500 µm; yellow, 200 µm; red, 100 µm. Source data along with biospecimen characteristics and sample availability are provided as Supplementary Data files.
Fig. 7
Fig. 7. Functional mapping of interactors identified by the epiHSP70s bait.
a, b PPI mapping (a) and functional annotation (b, Reactome pathway mapping) of the interactors identified by the YK5-B probe in MDA-MB-468 cells. Proteins graded as in Fig. 5d are shown. The location of select epiHSP70s components (HSP70s, HSP90s and HOP) and interactors (STAT3, NuMA, PLK1, Aurora A) is also shown in (a). c Reactome pathway enrichment analysis detailing the functional annotation of Grade A proteins mapped as in (a). Probe was added to live cells for capture, see Fig. 5a. d Proteome-wide functional changes (analysed by Reactome pathway mapping) induced by pharmacologic or genetic epiHSP70 inhibition in MDA-MB-468 cells, as indicated. e Validation of select proteins and protein pathways identified in panels (c, d). See Figs. 8–10 for detailed validation with focus on Cell cycle. Gel images are representative of three independent experiments. Source data are provided as Source data and Supplementary Data files.
Fig. 8
Fig. 8. EpiHSP70s are key context-dependent regulators of mitosis in epiHSP70s-positive cancers.
ad Localization and expression of epichaperomes in interphase and mitotic cells monitored by IF (a, b, d) and Native-PAGE (c). Micrographs are representative of n = 30 mitotic cells. epiTCO, epichaperome detection reagent; DAPI, chromosomes stain. Mitotic proteins and structures are shown for reference: NuMA (at spindle pole in mitotic cells and in the nucleus in interphase cells), pericentrin (PCNT, centrosome), α-tubulin (spindle). Scale bar, 5 μm. Graph (c), mean of n = 3 experiments. Graphs (d), median, dotted line and quartiles, dashed lines, one-way ANOVA, n = 40 cells, p < 0.0001, F (3, 156) = 537.7, with Sidak’s post-hoc. See also Supplementary Fig. 22. e, f Cell cycle (e) and confocal microscopy (f) analyses of epiHSP70s-high/medium (MDA-MB-468 and HeLa) and -low/negative (ASPC1) cells released from thymidine block into Vehicle or YK198 (2 µM). Graphs: (e) mean, n = 3 and (f) one-way ANOVA; n = 20 captured areas, p < 0.0001, F (3, 76) = 23.82 with Sidak’s post-hoc. See also Supplementary Figs. 23–26. g Graphs (mean) and micrographs (representative time-lapse microscopy images) of cancer cells released from thymidine block into Vehicle (n = 85 cells) or YK198 (n = 103 cells). Micrographs shows representative cells as they enter mitosis, fail to establish a proper mitotic plate, and undergo apoptosis. Scale bar, 25 μm. See also Supplementary Fig. 27. Source data, along with relevant statistical analyses and analysis data, are provided as a Source Data file.
Fig. 9
Fig. 9. epiHSP70s are context-dependent regulators of mitotic proteins in cancer.
a Reactome mapping of cell cycle-related protein pathways identified by the epiHSP70s epichaperomics in the epiHSP70s-high MDA-MB-468 cancer cells. b Stages of the mitotic cell cycle progression where most proteins, and in turn protein pathways, were identified to be dysregulated through epiHSP70s formation. Adapted from https://en.wikipedia.org/wiki/Mitosis. c Heatmaps show epiHSP70s interactors, as identified by the YK5-B bait, that were mapped to the indicated pathways. Representative proteins are annotated on the maps. For fully annotated maps see Supplementary Fig. 28. Proteins are graphed based on their interactor grade value (i.e. p-values calculated as in Fig. 5d). Scale bar, negative log10 (p-value). Changes in protein connectivity as detected by YK5-B epichaperomics compared to protein levels as determined by quantitative proteomics, are also shown. Gray bar, log10 spectral counts (SC) values, YK5-B interactors. Blue/red bars, normalized intensity values as per ref. . Schematic: proteins involved in Recruitment of NuMA to mitotic centrosomes act in both assembling and pulling the mitotic spindle and in attaching it to the cell cortex. d Select mitotic proteins identified as in (c) were confirmed to be biochemically epiHSP70s-dependent by CETSA (d) and chemical bait-precipitation (see Supplementary Fig. 30) followed by western blot analysis. Melting curves for vehicle- and LSI137-treated (20 μM, 1.5 h) epiHSP70s-high (MDA-MB-468) and -low (ASPC1) cancer cells, with equivalent HSP70s levels, are shown. Representative gels and graphed data (n = 3 individual data points are shown). Values normalized to those obtained for Vehicle at 51 °C. Abbreviations: NUMA1, Nuclear Mitotic Apparatus Protein 1; PLK1, Polo Like Kinase 1; AURKA, Aurora kinase A; TPX2, TPX2 microtubule nucleation factor. Source data are provided as Source data and Supplementary Data files.
Fig. 10
Fig. 10. epiHSP70s impact mitotic spindle in part, via regulation of NuMA activities related to spindle assembly, pulling and anchoring.
a Cells synchronized with a CDK1 inhibitor at the G2/M phase border were released into vehicle or YK198, as indicated. Tubulin foci associated with NuMA or pericentrin (centrosomes) were analysed by IF. Graphs, individual cells (n = 50 cells each for vehicle and YK198 treated cells, 2 independent experiments, mean±s.e.m.) and violin plots for YK198 treated cells (median, dotted line and quartiles, dashed lines, unpaired two-tailed Mann-Whitney test). b Cells synchronized with a CDK1 inhibitor and arrested at metaphase by the addition of the proteasome inhibitor MG132, were released into vehicle or YK198, as indicated. NuMA on the spindle pole or centrosomes, and the distance between spindle poles and from spindle pole to cell membrane were analysed by IF. Graphs, violin plots for Vehicle and YK198 treated cells (median, dotted line and quartiles, dashed lines, unpaired two-tailed Mann–-Whitney test, n = 50 individual cells each, 2 independent experiments). c Same as in (b) with microtubules stabilized by paclitaxel, as indicated. NuMA intensity on the spindle pole and in the cytosol is graphed. Graphs, violin plots for Vehicle and YK198 treated cells (median, dotted line and quartiles, dashed lines, unpaired two-tailed Mann-Whitney test, n = 50 individual cells each, 2 independent experiments). Representative IF micrographs are shown for (ac). Scale bar, 10 μm for all images. d Schematic of the findings showing how NuMA is functionally dependent on epiHSP70s in mitotic cells. NuMA, together with its protein partners and regulatory proteins, is required for the proper assembly and maintenance of the mitotic spindle as well as spindle orientation and elongation. These NuMA-associated functions are impaired when epiHSP70s are inhibited. Source data, along with relevant statistical analyses and analysis data, are provided as a Source Data file.

References

    1. Nussinov R, Tsai CJ, Jang H. Protein ensembles link genotype to phenotype. PLoS Comput. Biol. 2019;15:e1006648. doi: 10.1371/journal.pcbi.1006648. - DOI - PMC - PubMed
    1. Joshi S, et al. Adapting to stress—chaperome networks in cancer. Nat. Rev. Cancer. 2018;18:562–575. doi: 10.1038/s41568-018-0020-9. - DOI - PMC - PubMed
    1. Haigis KM, Cichowski K, Elledge SJ. Tissue-specificity in cancer: The rule, not the exception. Science. 2019;363:1150–1151. doi: 10.1126/science.aaw3472. - DOI - PubMed
    1. Sahni N, et al. Widespread macromolecular interaction perturbations in human genetic disorders. Cell. 2015;161:647–660. doi: 10.1016/j.cell.2015.04.013. - DOI - PMC - PubMed
    1. Barabasi AL, Oltvai ZN. Network biology: understanding the cell’s functional organization. Nat. Rev. Genet. 2004;5:101–113. doi: 10.1038/nrg1272. - DOI - PubMed

Publication types