. 2023 Jun 23;13(1):10194.
doi: 10.1038/s41598-023-36812-y.

Longitudinal investigation of changes in resting-state co-activation patterns and their predictive ability in the zQ175 DN mouse model of Huntington's disease

Affiliations

Longitudinal investigation of changes in resting-state co-activation patterns and their predictive ability in the zQ175 DN mouse model of Huntington's disease

Mohit H Adhikari et al. Sci Rep. .

Abstract

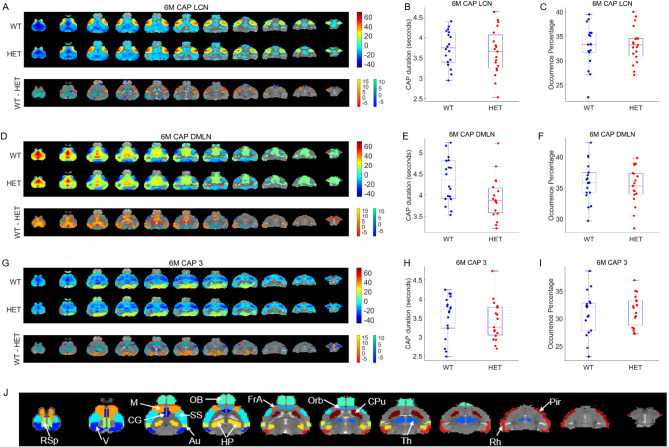
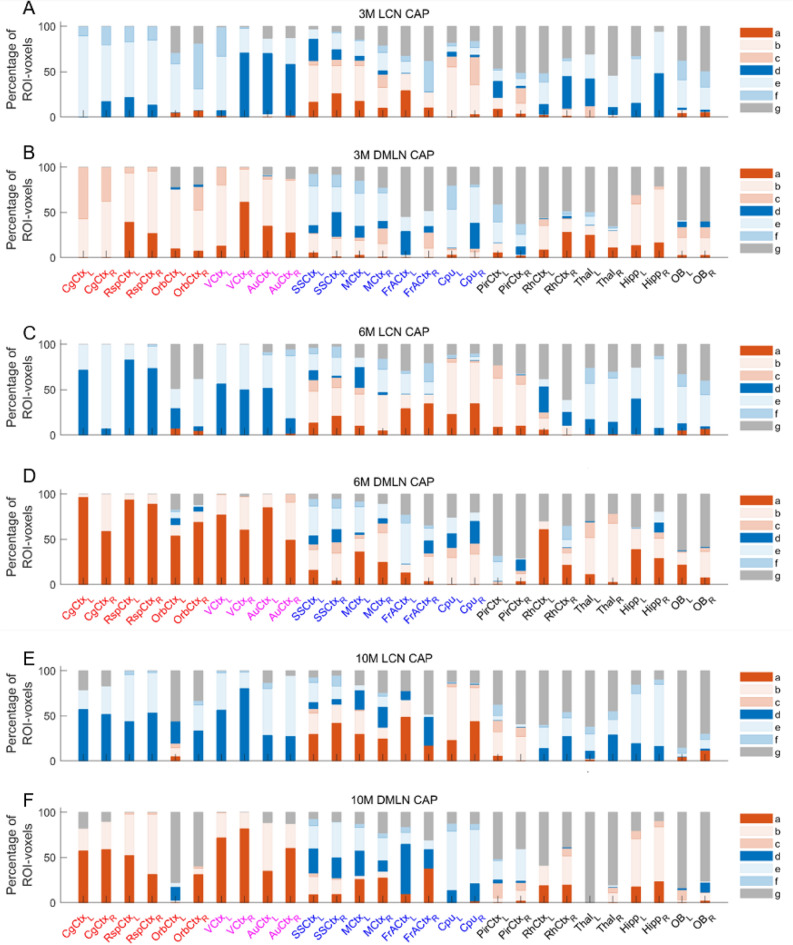
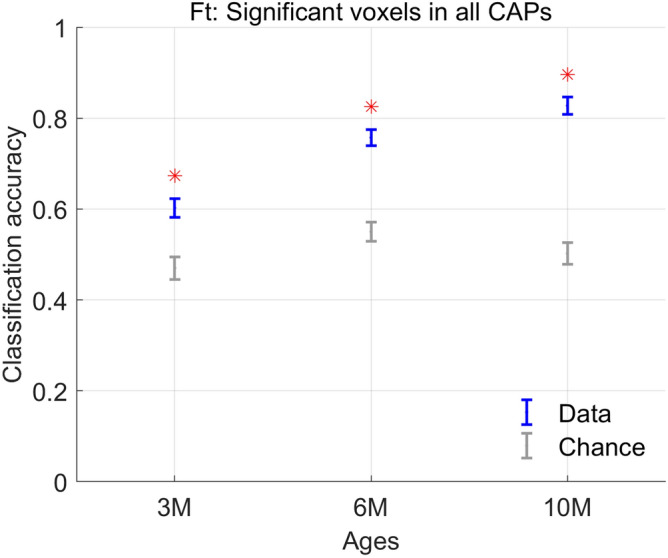
Huntington's disease (HD) is a neurodegenerative disorder caused by expanded (≥ 40) glutamine-encoding CAG repeats in the huntingtin gene, which leads to dysfunction and death of predominantly striatal and cortical neurons. While the genetic profile and clinical signs and symptoms of the disease are better known, changes in the functional architecture of the brain, especially before the clinical expression becomes apparent, are not fully and consistently characterized. In this study, we sought to uncover functional changes in the brain in the heterozygous (HET) zQ175 delta-neo (DN) mouse model at 3, 6, and 10 months of age, using resting-state functional magnetic resonance imaging (RS-fMRI). This mouse model shows molecular, cellular and circuitry alterations that worsen through age. Motor function disturbances are manifested in this model at 6 and 10 months of age. Specifically, we investigated, longitudinally, changes in co-activation patterns (CAPs) that are the transient states of brain activity constituting the resting-state networks (RSNs). Most robust changes in the temporal properties of CAPs occurred at the 10-months time point; the durations of two anti-correlated CAPs, characterized by simultaneous co-activation of default-mode like network (DMLN) and co-deactivation of lateral-cortical network (LCN) and vice-versa, were reduced in the zQ175 DN HET animals compared to the wild-type mice. Changes in the spatial properties, measured in terms of activation levels of different brain regions, during CAPs were found at all three ages and became progressively more pronounced at 6-, and 10 months of age. We then assessed the cross-validated predictive power of CAP metrics to distinguish HET animals from controls. Spatial properties of CAPs performed significantly better than the chance level at all three ages with 80% classification accuracy at 6 and 10 months of age.


Conflict of interest statement

The authors declare no competing interests.

Figures

Figure 1
Figure 1
(A)–(C) Across-subject variance explained as a function of number of clusters in the partition of the combined image-series at the 3 months (A), 6-months (B) and the 10-months (C) time points. Magenta dashed line indicates the elbow point beyond which the explained variance is found to saturate in each case. We found 8, 3 and 6 clusters were sufficient to explain ~ 53–55% of variance at the 3, 6 and 10-months time points respectively. (D)–(F) Fractional gain in the explained variance as the number of clusters in the partition increase from k to k + 1, as a function of partitions, for 3 months (D), 6-months (E) and the 10-months (F) time points. We find that the fractional gain for every k after the elbow point is lower that 0.5%.
Figure 2
Figure 2
Comparison of spatial and temporal properties of 4 out of 8 CAPs at the 3 months time point. (A), (D), (G), (J) top panels show the one-sample T-statistic maps of significantly (Bonferroni corrected, p < 0.01) activated and deactivated voxels for each CAP obtained from its occurrences in the WT and HET portions of the combined image-series. Bottom panels show the 2-sample T-test statistic map of voxels with significant (FDR corrected, p < 0.05) difference in the (de)activation between the WT and HET CAPs. We make these comparisons for all voxels that are significantly activated or deactivated in either the WT or the HET group. Red-yellow and blue-green colour bars refer to voxels that are co-activated and co-deactivated respectively in the WT group. Thus, positive (yellow, green) and negative (red, blue) T-statistic values respectively indicate significantly lower and higher magnitude of activation in the HET group compared to the WT group. (B), (E), (H), and (K) Boxplots of comparisons of median, across subjects, duration of each CAP between WT and HET groups. (C), (F), (I), (L) Boxplots of comparison of median occurrence percentage, across subjects, of each CAP between WT and HET groups. (M) Fourteen prominent ROIs considered in this study: Retrosplenial cortex (RSp), Visual cortex (V), Motor cortex (M), Cingulate cortex (CG), Olfactory bulb (OB), Somatosensory cortex (SS), Auditory cortex (V), Hippocampus (H), Frontal Association cortex (FrA), Orbital cortex (Orb), Caudate Putamen (CPu), Thalamus (Th), Rhinal cortex (Rh), and Piriform cortex (Pir).
Figure 3
Figure 3
Comparison of spatial and temporal properties of 3 CAPs at the 6-months time point. (A), (D), (G) top panels show the one-sample T-statistic maps of significantly (Bonferroni corrected, p < 0.01) activated and deactivated voxels for each CAP obtained from its occurrences in the WT and HET portions of the combined image-series. Bottom panels show the 2-sample T-test statistic map of voxels with significant (FDR corrected, p < 0.05) difference in the (de)activation between the WT and HET CAPs. We make these comparisons for all voxels that are significantly activated or deactivated in either the WT or the HET group. Red-yellow and blue-green colour bars refer to voxels that are co-activated and co-deactivated respectively in the WT group. Thus, positive (yellow, green) and negative (red, blue) T-statistic values respectively indicate significantly lower and higher magnitude of activation in the HET group compared to the WT group. (B), (E), (H) Boxplots of comparisons of median duration, across subjects, of each CAP between WT and HET groups. (C), (F), (I) Boxplots of comparison of median occurrence percentage, across subjects, of each CAP between WT and HET groups. (J) Fourteen prominent ROIs considered in this study: Retrosplenial cortex (RSp), Visual cortex (V), Motor cortex (M), Cingulate cortex (CG), Olfactory bulb (OB), Somatosensory cortex (SS), Auditory cortex (V), Hippocampus (H), Frontal Association cortex (FrA), Orbital cortex (Orb), Caudate Putamen (CPu), Thalamus (Th), Rhinal cortex (Rh), and Piriform cortex (Pir).
Figure 4
Figure 4
Comparison of spatial and temporal properties of 6 CAPs at the 10-months time point. (A), (D), (G), (J), (M), (P) top panels show the one-sample T-statistic maps of significantly (Bonferroni corrected, p < 0.01) activated and deactivated voxels for each CAP obtained from its occurrences in the WT and HET portions of the combined image-series. Bottom panel shows the 2-sample T-test statistic map of voxels with significant (FDR corrected, p < 0.05) difference in the (de)activation between the WT and HET CAPs. We make these comparisons for all voxels that are significantly activated or deactivated in either the WT or the HET group. Red-yellow and blue-green colour bars refer to voxels that are co-activated and co-deactivated respectively in the WT group. Thus, positive (yellow, green) and negative (red, blue) T-statistic values respectively indicate significantly lower and higher magnitude of activation in the HET group compared to the WT group. (B), (E), (H), (K), (N), (Q) Boxplots of comparisons of median duration, across subjects, of each CAP between WT and HET groups. (C), (F), (I), (L), (O), (R) Boxplots of comparison of median occurrence percentage, across subjects, of each CAP between WT and HET groups. Green asterix indicates significant inter-group difference (p < 0.05, Wilcoxon rank-sum test, FDR corrected for 6 comparisons). (S) Fourteen prominent ROIs considered in this study: Retrosplenial cortex (RSp), Visual cortex (V), Motor cortex (M), Cingulate cortex (CG), Olfactory bulb (OB), Somatosensory cortex (SS), Auditory cortex (V), Hippocampus (H), Frontal Association cortex (FrA), Orbital cortex (Orb), Caudate Putamen (CPu), Thalamus (Th), Rhinal cortex (Rh), and Piriform cortex (Pir).
Figure 5
Figure 5
Percentages of voxels per ROI belonging to one of 7 categories for the LCN CAP (A (3 M), C(6 M), E(10 M)) and the DMLN CAP (B (3 M), D(6 M), F(10 M)) respectively. The red & blue colour bars indicate significant co-activation and co-deactivation, respectively, in either the WT or the HET group. Different colour/shade bars indicate percentage of voxels from seven different categories: (a) significant co-activation and higher activation magnitude in WT, (b) significant co-activation and no significant inter-genotype difference in the activation magnitude, (c) significant co-activation and higher activation magnitude in HET, (d) significant co-deactivation and higher activation magnitude in WT, (e) significant co-deactivation and no significant inter-genotype difference in the activation magnitude, (f) significant co-deactivation and higher activation magnitude in HET, and (g) non-significant co-activation or co-deactivation during a CAP. Voxel-wise one-sample T-test (p < 0.01, Bonferroni corrected) and two-sample T-test (p < 0.05, FDR corrected) are performed across occurrences of a CAP within the concatenated genotypic image-series from all subjects to identify the voxels belonging to one of the 7 categories mentioned above in the entire brain. We then calculate the percentages of each category in each of the 28 ROIs shown in Figs. 2M, 3J, 4S. ROIs belonging to the DMLN have red labels, ROIs belonging to the associated cortical network have magenta labels while the blue labels represent LCN ROIs. The black labels represent the rest of the cortical and sub-cortical ROIs.
Figure 6
Figure 6
Classification accuracy (blue, mean +/− SEM) using z-scored BOLD signals of voxels with significant activations in 8 CAPs at the 3 months, 3 CAPs at the 6-months, and 6 CAPs at the 10-months time points. The grey error bars show the corresponding chance-level accuracy (mean + / − SEM) and red asterisk indicates significantly higher mean accuracy than the chance level, after correcting for all 3 comparisons (p < 0.05; FDR corrected).

Similar articles

Cited by

References

    1. Bates GP, Dorsey R, Gusella JF, Hayden MR, Kay C, Leavitt BR, Nance M, Ross CA, Scahill RI, Wetzel R, et al. Huntington disease. Nat. Rev. Dis. Primer. 2015;1:1–21. doi: 10.1038/nrdp.2015.5. - DOI - PubMed
    1. Paoli RA, Botturi A, Ciammola A, Silani V, Prunas C, Lucchiari C, Zugno E, Caletti E. Neuropsychiatric burden in Huntington’s disease. Brain Sci. 2017;7:67. doi: 10.3390/brainsci7060067. - DOI - PMC - PubMed
    1. Ross CA, Tabrizi SJ. Huntington’s disease: from molecular pathogenesis to clinical treatment. Lancet Neurol. 2011;10:83–98. doi: 10.1016/S1474-4422(10)70245-3. - DOI - PubMed
    1. Nanetti L, Contarino VE, Castaldo A, Sarro L, Bachoud-Levi A-C, Giavazzi M, Frittoli S, Ciammola A, Rizzo E, Gellera C, et al. Cortical thickness, stance control, and arithmetic skill: An exploratory study in premanifest Huntington disease. Parkinsonism Relat. Disord. 2018;51:17–23. doi: 10.1016/j.parkreldis.2018.02.033. - DOI - PubMed
    1. Rosas HD, Salat DH, Lee SY, Zaleta AK, Pappu V, Fischl B, Greve D, Hevelone N, Hersch SM. Cerebral cortex and the clinical expression of Huntington’s disease: Complexity and heterogeneity. Brain. 2008;131:1057–1068. doi: 10.1093/brain/awn025. - DOI - PMC - PubMed

Publication types