. 2023 Jun 23;14(1):3746.
doi: 10.1038/s41467-023-39106-z.

Mitochondrial matrix protein LETMD1 maintains thermogenic capacity of brown adipose tissue in male mice

Affiliations

Mitochondrial matrix protein LETMD1 maintains thermogenic capacity of brown adipose tissue in male mice

Anna Park et al. Nat Commun. .

Abstract

Brown adipose tissue (BAT) has abundant mitochondria with the unique capability of generating heat via uncoupled respiration. Mitochondrial uncoupling protein 1 (UCP1) is activated in BAT during cold stress and dissipates mitochondrial proton motive force generated by the electron transport chain to generate heat. However, other mitochondrial factors required for brown adipocyte respiration and thermogenesis under cold stress are largely unknown. Here, we show LETM1 domain-containing protein 1 (LETMD1) is a BAT-enriched and cold-induced protein required for cold-stimulated respiration and thermogenesis of BAT. Proximity labeling studies reveal that LETMD1 is a mitochondrial matrix protein. Letmd1 knockout male mice display aberrant BAT mitochondria and fail to carry out adaptive thermogenesis under cold stress. Letmd1 knockout BAT is deficient in oxidative phosphorylation (OXPHOS) complex proteins and has impaired mitochondrial respiration. In addition, BAT-specific Letmd1 deficient mice exhibit phenotypes identical to those observed in Letmd1 knockout mice. Collectively, we demonstrate that the BAT-enriched mitochondrial matrix protein LETMD1 plays a tissue-autonomous role that is essential for BAT mitochondrial function and thermogenesis.


Conflict of interest statement

The authors declare no competing interests.

Figures
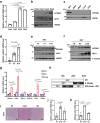
Fig. 1
Fig. 1. The Letmd1 gene encodes a brown adipocyte-enriched and cold-inducible protein.
a mRNA expression of Letmd1 during brown adipocyte (iBPA) differentiation. Expression is normalized to Rpl32. n = 3 per group. b Western blots of LETMD1 and UCP1 proteins during brown adipocyte (iBPA) differentiation. HSP90 is a loading control. c Western blot of LETMD1 protein in brown adipose tissue (BAT), inguinal white adipose tissue (iWAT), epididymal white adipose tissue (eWAT), liver, and gastrocnemius muscle (GAS) from adult male mice. HSP90 is a loading control. Representative images from three independent repeats. d mRNA expression of Letmd1 from perinatal BAT from postnatal day 1 (P1), day 7 (P7), and day 14 (P14) male mice. nP1 = 4, nP7 = 5, nP14 = 5. Expression is normalized to Rpl32. e Western blots of LETMD1 and UCP1 proteins in BAT in the same sets as in (d). HSP90 is a loading control. Representative images from three independent repeats. f Representative western blots of LETMD1 and UCP1 proteins in BAT from adult male mice after 5 days of exposure to TN (thermoneutral, 30 °C), RT (room temperature, 23 °C), and cold (6 °C). α -Tubulin is a loading control. Representative images from three independent repeats. g mRNA expression of Letmd1 and thermogenic genes in the same sets as in (f). Expression is normalized to Rpl32. n = 3 per group. h Experimental scheme for a cold challenge in adult male mice. i H&E staining of BAT sections from mice exposed to cold (6 °C) and mice adapted to room temperature (23 °C) after cold stimulation. Scale bar, 200 μm. Representative images from three independent repeats. mRNA expression of Letmd1 (j) and Ucp1 (k) in the same sets as in (h). Expression is normalized to Rpl32. n = 3 mice per group. Data presented as mean ± SEM. *p < 0.05, **p < 0.005, ***p < 0.0005. The significance of the results was assessed using one-way ANOVA. Source data are provided as a Source Data file.
Fig. 2
Fig. 2. LETMD1 protein is localized to the mitochondrial matrix.
a Prediction of a putative mitochondrial targeting sequence (MTS) and cleavage site for mouse LETMD1 with MitoFates analysis. b Immunofluorescence image of Letmd1-Flag (Green), mitochondria (Red), and DAPI (Blue) in iBPA cells. Representative images from three independent repeats. Scale bar, 10 μm. c Experimental scheme of proximity labeling using APEX2 localized to the mitochondrial matrix (left) or intermembrane space (right). APEX2 enzyme (red) labels compartment-specific proteomes using desthiobiotin-phenol (D, DBP) as a substrate. Outer mitochondrial membrane, OMM; Intermembrane space, IMS; Inner mitochondrial membrane, IMM. d Electron micrographs of APEX2 staining patterns in untransfected HEK 293 cells and HEK 293 cells transfected with MTS-Letmd1-APEX2 (C-terminus fusion), MTS-APEX2-Letmd1 (N-terminus fusion), MTS-APEX2, and ∆MTS-Letmd1-APEX2 expression constructs. Representative images from two independent repeats. Scale bar, 1 μm. e TMHMM analysis of human LETMD1 protein sequence predicting two transmembrane domains (TM). f Position of amino acids fusing APEX2 with LETMD1 protein (black arrow). g Electron micrographs of APEX2 staining patterns in HEK 293 cells transfected with Letmd1(aa1 ~ 79)-APEX2-Letmd1(aa80 ~ ), Letmd1(aa1 ~ 115)-APEX2-Letmd1(aa116 ~ ) and Letmd1(aa1 ~ 148)-APEX2-Letmd1(aa149 ~ ) expression constructs. Representative images from two independent repeats. Scale bar, 1 μm. h Western blots of Flag-tagged LETMD1 protein and OMM-APEX2, IMS-APEX2, and matrix-APEX2 biotinylated proteins in mature brown adipocytes. Representative images from three independent repeats. Input is 3% of the total lysate prior to affinity purification of biotinylated protein species by streptavidin-beads. HSP90 is a loading control. Source data are provided as a Source Data file.
Fig. 3
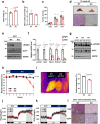
Fig. 3. LETMD1 is necessary for adaptive thermogenesis.
Body weight (a), food intake (b), and locomotor activity, (c) of 13-week-old wild-type (WT) and Letmd1 KO (KO) male mice. nbody weight = 4, nfood intake = 3, nactivity = 4. d Gross image of brown adipose tissue (BAT) and H&E stained BAT tissue sections from 13-week-old WT and Letmd1 KO male mice. Representative images from five independent repeats. Scale bar, 200 μm. e Western blots of LETMD1 and UCP1 proteins in BAT of 13-week-old male mice. HSP90 is a loading control. f mRNA expression of Letmd1 and brown adipocyte marker genes in the same sets as in (e). Expression is normalized to Rpl32. n = 5 per group. g Western blots of LETMD1 and UCP1 proteins in BAT from male mice on postnatal day 1 (P1), day 2 (P2), and day 3 (P3). HSP90 is loading control. Representative images from three independent repeats. h Core body temperature of adult male mice during cold (8 °C) challenge. n = 6 per group. i Images of surface temperature using infrared thermography after 5 h cold challenge. Images were quantified for the region of interest corresponding to interscapular BAT. n = 4 per group. Oxygen consumption rates (j) and carbon dioxide production (k) rates of WT and Letmd1 KO male mice exposed to cold (4°C). n = 5 per group. l Representative H&E staining and UCP1 protein immunostaining of BAT from WT and Letmd1 KO male mice exposed to cold (4 °C) for 5 h. Representative images from five independent repeats. Scale bar, 200 μm. Data presented as mean ± SEM. *p < 0.05, **p < 0.005, ***p < 0.0005. The significance of the results was assessed using a two-tailed Student’ t test. Source data are provided as a Source Data file.
Fig. 4
Fig. 4. LETMD1 supports mitochondrial respiration of stimulated brown adipocytes.
a Gene ontology analysis of BAT transcriptomes from wild-type (WT) and Letmd1 KO (KO) male mice. n = 3 per group. b Electron micrographs of BAT showing mitochondrial structure. Scale bar, 1 μm. Representative images from three independent repeats.c Western blots of OXPHOS complex and LETMD1 proteins from E16.5 embryonic BAT. Representative images from two independent repeats. HSP90 is a loading control. d Western blots of OXPHOS complex proteins from perinatal BAT from WT and Letmd1 KO male mice. Representative images from three independent repeats. HSP90 is a loading control. e Western blots of OXPHOS complex proteins from BAT from adult WT and Letmd1 KO male mice. Representative images from five independent repeats. HSP90 is a loading control. f Oxygen consumption rates of control (SCR) and Letmd1 knockdown (shLetmd1) brown adipocytes in response to 4 h pre-treatment of 10 µM forskolin (FSK). nSCR = 3, nSCR-FSK = 5, nshLetmd1 = 4, nshLetmd1-FSK = 3. g Basal respiration, maximal respiration, proton leak, and ATP production in the same sets as (f). The OCR values were normalized to the protein levels of each well. Data presented as mean ± SEM. h Western blots of LETMD1, OXPHOS complex, and UCP1 proteins in the same sets as (f). Representative images from three independent repeats. *p < 0.05, **p < 0.005, ***p < 0.0005. The significance of the results was assessed using one-way ANOVA. Source data are provided as a Source Data file.
Fig. 5
Fig. 5. LETMD1 deficiency does not affect mitochondrial ultrastructure or OXPHOS complex expression in tissues other than BAT.
Electron micrographs of mitochondria from heart (a) and soleus muscle (b) of adult wild-type (WT) and Letmd1 KO (KO) male mice. Representative images from three independent repeats. Scale bar, 5 μm and 1 μm respectively. Western blots were performed to evaluate mitochondrial OXPHOS complex expression in inguinal white adipose tissue (iWAT) (c), epididymal white adipose tissue (eWAT) (d), liver (e), and gastrocnemius muscle (f) from 13-week-old male WT and Letmd1 KO mice. n = 3 per group. HSP90 is a loading control. Representative images from three independent repeats. Source data are provided as a Source Data file.
Fig. 6
Fig. 6. Mice with BAT-specific deletion of Letmd1 have abnormal brown fat and reduced OXPHOS complex expression similar to Letmd1 KO mice.
a Strategy for generating Letmd1 conditional alleles. See “Materials and Methods” for details. LETMD1 protein (b) and mRNA (c) expression levels were measured in tissues (BAT brown adipose tissue, iWAT inguinal white adipose tissue, eWAT epididymal white adipose tissue, liver, heart, GAS gastrocnemius muscle, SOL soleus muscle) from 12-week-old male Letmd1flox/flox mice (Con) and Ucp1-Cre; Letmd1flox/flox mice (BKO). n = 3 per group. Representative results from three independent repeats. d Gross images of brown adipose tissue from 12-week-old male Letmd1flox/flox mice (Con) and Ucp1-Cre; Letmd1flox/flox mice (BKO). Scale bar, 1 cm. Representative images from three independent repeats. e Representative hematoxylin and eosin (H&E) staining of BAT, iWAT, eWAT, and liver from 12-week-old male Letmd1flox/flox mice (Con) and Ucp1-Cre; Letmd1flox/flox mice (BKO). Scale bar, 60 µm. Representative images from three independent repeats. Body weight (f), tissue weight (g), fat mass/lean mass (h), and blood glucose levels (i) of 12-week-old male Letmd1flox/flox mice (Con) and Ucp1-Cre; Letmdflox/flox mice (BKO). n = 3 per group. j mRNA expression of thermogenic genes. mRNA expression is normalized to Rpl32. n = 3 per group. Data presented as mean ± SEM. *p < 0.05, **p < 0.005, ***p < 0.0005 k Western blots of LETMD1 protein, mitochondrial complex components, and UCP1 protein in the BAT from 12-week-old male Letmdflox/flox mice (Con) and Ucp1-Cre; Letmd1flox/flox mice (BKO). HSP90 is loading control. Representative images from three independent repeats. The significance of the results was assessed using a two-tailed Student’ t test. Source data are provided as a Source Data file.

References

    1. Klingenberg M. Mechanism and evolution of the uncoupling protein of brown adipose tissue. Trends Biochem. Sci. 1990;15:108–112. doi: 10.1016/0968-0004(90)90194-G. - DOI - PubMed
    1. Labbé SM, et al. In vivo measurement of energy substrate contribution to cold‐induced brown adipose tissue thermogenesis. FASEB J. 2015;29:2046–2058. doi: 10.1096/fj.14-266247. - DOI - PubMed
    1. Blondin DP, et al. Increased brown adipose tissue oxidative capacity in cold-acclimated humans. J. Clin. Endocrinol. Metab. 2014;99:E438–E446. doi: 10.1210/jc.2013-3901. - DOI - PMC - PubMed
    1. Stanford KI, et al. Brown adipose tissue regulates glucose homeostasis and insulin sensitivity. J. Clin. Invest. 2013;123:215–223. doi: 10.1172/JCI62308. - DOI - PMC - PubMed
    1. Liu X, et al. Brown adipose tissue transplantation reverses obesity in Ob/Ob mice. Endocrinology. 2015;156:2461–2469. doi: 10.1210/en.2014-1598. - DOI - PubMed

Publication types

Substances