. 2023 Jun 23;14(1):3755.
doi: 10.1038/s41467-023-39280-0.

Mechanistic insights into the aggregation pathway of the patient-derived immunoglobulin light chain variable domain protein FOR005

Affiliations

Mechanistic insights into the aggregation pathway of the patient-derived immunoglobulin light chain variable domain protein FOR005

Tejaswini Pradhan et al. Nat Commun. .

Abstract

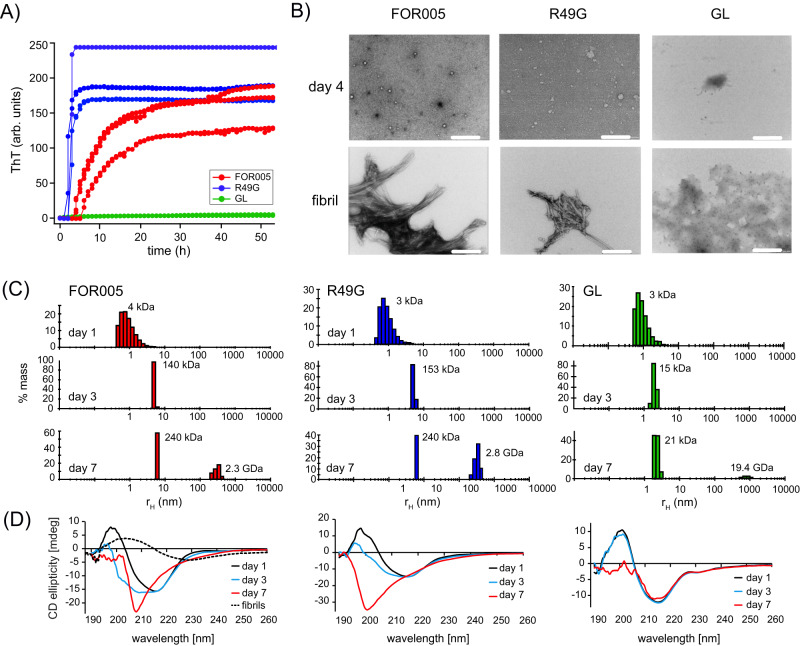
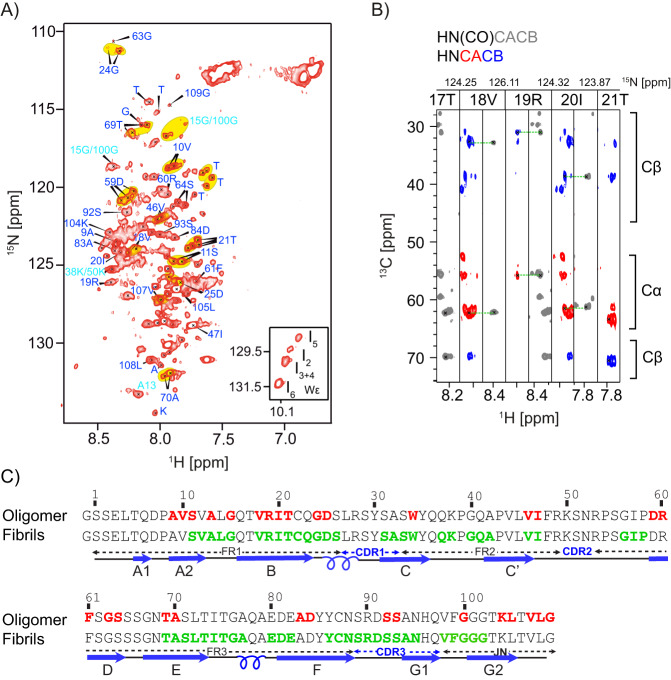
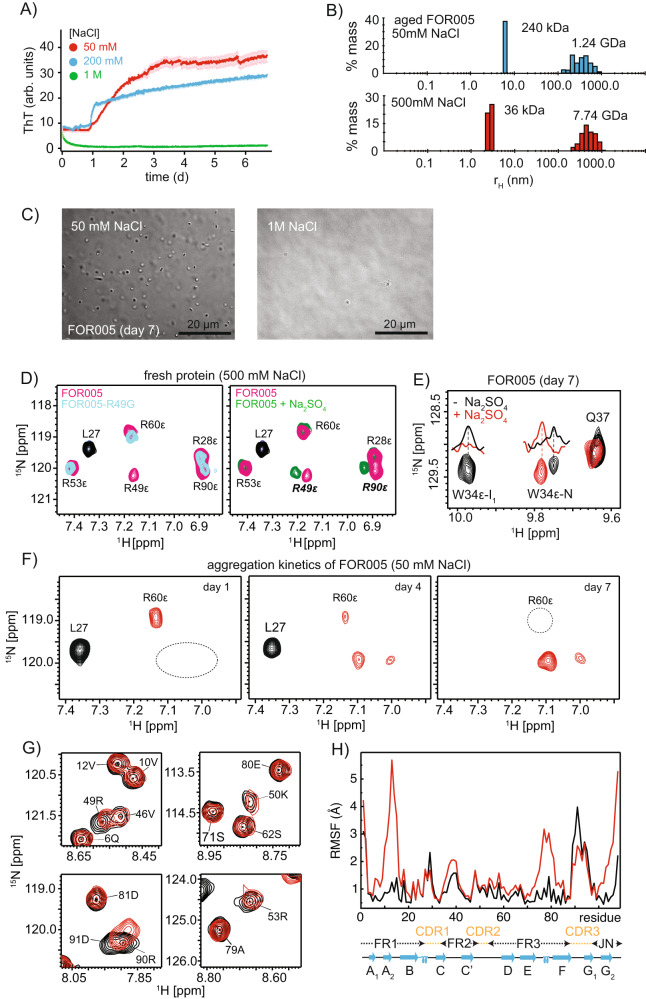
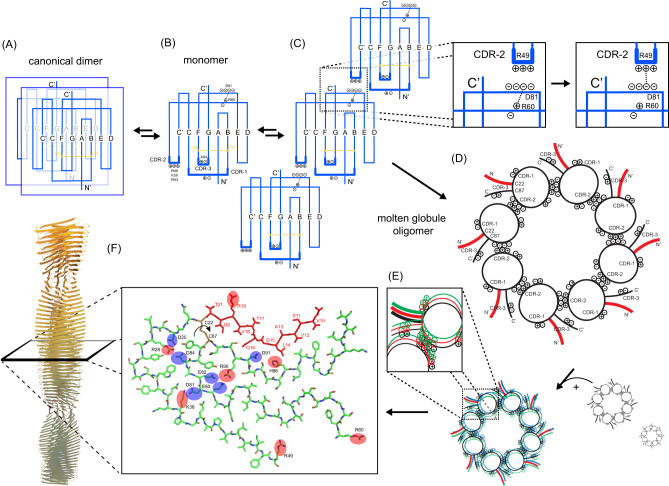
Systemic antibody light chain (AL) amyloidosis is characterized by deposition of amyloid fibrils. Prior to fibril formation, soluble oligomeric AL protein has a direct cytotoxic effect on cardiomyocytes. We focus on the patient derived λ-III AL variable domain FOR005 which is mutated at five positions with respect to the closest germline protein. Using solution-state NMR spectroscopy, we follow the individual steps involved in protein misfolding from the native to the amyloid fibril state. Unfavorable mutations in the complementary determining regions introduce a strain in the native protein structure which yields partial unfolding. Driven by electrostatic interactions, the protein converts into a high molecular weight, oligomeric, molten globule. The high local concentration of aggregation prone regions in the oligomer finally catalyzes the conversion into fibrils. The topology is determined by balanced electrostatic interactions in the fibril core implying a 180° rotational switch of the beta-sheets around the conserved disulfide bond.


Conflict of interest statement

The authors declare no competing interests.

Figures

Fig. 1
Fig. 1. Biophysical characterization of FOR005 oligomers.
A The patient protein FOR005 (red), the single point mutant R49G (blue) and the germline protein GL (green) were incubated at a concentration of 25 μM and 37 °C. FOR005 and R49G aggregate on a similar time scale, while GL does not aggregate in the time course of the experiment. For each protein, three replicates were recorded. To facilitate aggregation, 500 μM SDS was added to all protein solutions. In the absence of SDS, aggregation is very slow and requires several weeks to yield amyloid fibrils. B Representative EM images for FOR005, R49G and GL taken at different days after incubation. The aliquot for the fibril sample was taken after 30 days of incubation. The scale bar represents 200 nm. C DLS size distribution of FOR005 (red), R49G (blue) and GL (green) initially (top) and after and incubation time of 3 (middle) and 7 days (bottom). The scattering data is shown in a mass weighted representation. All experiments are carried out using a protein concentration of 50 μM. D Far UV CD data for FOR005, R49G and GL recorded as a function of time. The fibril sample (dashed, black line in the left spectrum) was taken after 30 days of incubation and is shown as a reference. A protein concentration of 50 μM protein was employed for all measurements. In each case, the buffer spectrum was subtracted from the protein data. Source data are provided as a Source Data file.
Fig. 2
Fig. 2. Monomer-dimer equilibrium in FOR005 and GL.
A Concentration-dependent 1H,15N HSQC spectra for the patient protein FOR005. Protein concentrations of 14/18 μM (black), 170 μM (red), 650 μM (orange) and 1.1 mM (green) have been employed. Residues that show large concentration dependent chemical changes are highlighted with a dashed blue circle. In the inset, the spectral region containing G101 is shown enlarged for FOR005 and GL. B 1H,15N chemical shift difference Δδ for spectra recorded at the highest and lowest concentration for FOR005 (red) and GL (green) as a function of residue. C Protein concentration dependent chemical shift difference Δδ for FOR005 (left) and GL (right). To fit the dissociation constant Kd, the chemical shifts of the residues K38, A42, F99 and G101 were employed. The non-linear fit of the dilution data yields (1.74 ± 0.61) mM and (3.60 ± 0.32) mM for FOR005 and GL, respectively. Structural models of the canonical (D) and alternate (E) dimer interfaces. The crystal structure of FOR005 VL (PDB 5L6Q) was employed to represent the canonical dimer interface. To obtain the alternate dimer structure a homology model has been generated using the X-ray structure of AL09 H87Y (PDB: 2KQN). Source data are provided as a Source Data file.
Fig. 3
Fig. 3. Aggregation kinetics for different FOR005 variants using solution-state NMR.
All experiments were performed at a temperature of 25 °C. A Bulk NMR signal intensities for the patient protein FOR005 (closed squares), the germline protein (closed triangles) and the single point mutant FOR005-R49G (open squares). In the analysis, the average cross peak intensities of the backbone amides of G15, I57 and E82 were taken into account. B Aggregation kinetics of FOR005 at a protein concentration of 50 μM (closed squares) and 150 μM (open squares). For quantification, the cross peak intensity of the side chain cross peak of W34ε has been employed. C Tryptophan spectral region of the 1H,15N HSQC for GL, FOR005 (D) and R49G (E) as a function of time. In all samples, a protein concentration of 50 μM was employed. N and I refer to the natively folded and intermediate states, respectively. For FOR005 and R49G, N disappears over time, while the cross peak remains invariant in GL. New appearing peaks in FOR005 are labeled as I1-I5. For R49G, only one predominant intermediate is observed. Source data are provided as a Source Data file.
Fig. 4
Fig. 4. Detection of a partially folded intermediate state for R49G.
A Selected region of the 1H,15N HSQC spectrum obtained for a several week old R49G sample. At low contours, additional peaks are observed that can be sequentially assigned to residues located in CDR-3. B Sequential walk involving residues S93-H96 of the minor populated state of FOR005-R49G. The assignment is obtained from 3D HNCACB and HN(CO)CACB experiments. C Distribution of backbone dihedral angles φ and ψ during the MD simulation of FOR005. The sampled backbone dihedral angles are represented in a Ramachandran diagram for residues 48 to 52, and 93 to 97 (black open squares). The calculations show that backbone conformations in CDR2 and CDR3 are energetically unfavorable. Favorable regions are indicated in blue, the extended allowed region in green. D Heteronuclear NOE experimental data for the backbone amides of FOR005 (red) and GL (green). The experiments were carried out at a magnetic field strength of 11.75 T, corresponding to a 1H Larmor frequency of 500 MHz. The temperature was set to 25 °C. In both samples, a protein concentration of 50 μM was employed. Error bars were extracted from the signal-to-noise ratio of the experiment recorded with and without proton decoupling prior to acquisition of 15N.
Fig. 5
Fig. 5. Non-structured residues in oligomeric FOR005.
A Assigned 1H, 15N HSQC spectrum of an aged FOR005 sample. Peaks highlighted in yellow belong to the same spin system. Tryptophan resonances are shown in the inset. B HNCACB/HN(CO)CACB strip plot involving residues P8-S11 and T17-T21 with sequential assignments. Above pairs of strips, the 15N chemical shift of the connecting amide is indicated. C Assigned residues in the FOR005 fibrils and the oligomeric intermediate state are indicated in green and red, respectively. The assigned amyloid core residues in the fibril state are taken from Pradhan et al.. Secondary chemical shifts for all assigned residues in the oligomeric-state are random-coil like (data not shown). The secondary structure elements of the native state are shown on the bottom of the figure to guide the eye.
Fig. 6
Fig. 6. Salt shields electrostatic interactions and prevents formation of oligomeric FOR005.
A ThT aggregation assay for a 50 µM FOR005 solution as a function of the NaCl concentration. Curves represented in red, blue and green are obtained from preparations containing 50 mM, 200 mM and 1 M NaCl. To facilitate aggregation, 500 μM SDS was added to all protein solutions. n = 3 independent ThT experiments for three different salt concentrations have been recorded. For 50 mM, 200 mM and 1 M NaCl, a lag time of (0.70 ± 0.38)d, (1.73 ± 0.32)d and ∞ has been observed. B DLS data for a 7 days old sample in presence of 50 mM (blue) and 500 mM NaCl (orange). Addition of salt dissolves low molecular weight oligomers (particles with hydrodynamic radius of 8 nm) and recovers the characteristic scattering for the monomeric protein. The sample was not pre-sedimented prior to the start of the kinetics. C Representative Differential Interference Contrast (DIC) microscopy images of the patient protein FOR005 in the presence of 50 mM NaCl (left) and 1 M NaCl (right). The FOR005 sample was pre-sedimented before the start of the kinetics and then incubated for 7 days. Addition of salt induces the disappearance of high molecular weight aggregates. The scale bar corresponds to a length of 20 μm. D Solution-state 1H,15N HSQC spectra with focus on the arginine-ε spectral region. (Left) comparison of spectra obtained for fresh samples of FOR005 (red) and FOR005-R49G (blue). The side chain resonance of R49 is readily assigned. The experiments were recorded in the presence of 500 mM NaCl to reduce the hydrogen exchange dynamics. (Right) spectra recorded in the absence (red) and presence (green) of 100 mM sodium sulfate. R49ε and R90ε show significant chemical shift perturbation suggesting that these arginines are susceptible to a negatively charged environment. The arginine side chain resonances are folded into the amide spectral region and yield negative cross peak intensity (red/blue/green) with respect to the amide backbone resonances (L27, black). E Superposition of 1H,15N HSQC spectra obtained for an aged 50 μM sample of the patient protein FOR005 in the presence (red) and absence of 100 mM sodium sulfate (black). Addition of sulfate recovers the native state. F NMR kinetics of the FOR005 patient protein. The spectra show the folded arginine side chain resonances in red. The side chain resonance of R60 is protected against exchange in the native state due to its involvement in a salt bridge with E80/D81. During aggregation, the resonances of R60-ε as well as the resonances of the native state (L27, in black) disappear. At the same time, two side chain resonances appear which originate from exchange protected arginines in the unfolded state. G Titration of the FOR005 derived peptide 79-AEDEADYY-86. The figure shows a superposition of a selected region of the 1H,15N HSQC spectra of FOR005 recorded in absence (black) and presence of a 10x molar excess of the 8-residue peptide 79-AEDEADYY-86 (red). Amide resonances of positively charged side chains such as R49, K50, R53 and R90 show significant chemical shift perturbations upon titration. H MD simulations of FOR005 and FOR005-R60A. The root-mean-square fluctuations (RMSF) is represented as a function of residue for the MD trajectory (1.6 μs, at 310 K) for the patient sequence FOR005 (black line) and the single point mutant FOR005-R60A (red line). Source data are provided as a Source Data file.
Fig. 7
Fig. 7. Postulated aggregation pathway of the antibody light chain VL domain FOR005.
A Dissociation of the homodimer is necessary to initiate aggregation. Even though patient and germline protein have comparable affinities, dimerization in the patient protein is perturbed by increased dynamics in CDR-3 induced by the single point mutation G94A (B). C Electrostatic interactions between the positively charged CDR-2 and the negatively charged conserved patch E80-D81-E82 drives intermolecular interactions. Destabilization of the salt bridge R60-E80/D81 by competition with CDR-2 yields unfolding of the VL domain and induces an oligomeric molten globule state (D). The loop induced by the disulfide bridge between C22 and C87 adopts a random-coil like conformation. The aggregation prone N-terminal region is color coded in red. E Subsequent addition of multiple molten globule oligomers results in a high molecular weight assembly in which the aggregation prone N-terminal region is aligned in parallel and in-register. F Conversion into the fibrillar state by transition from side chain-side chain to backbone-backbone hydrogen bonding. The topology is adopted from the cryo-EM structure of ex vivo FOR-005 fibrils (Radamaker et al.) (PDB ID: 6Z1O), and is found as well in vitro in seeded preparations. Positively and negatively charged side chains are highlighted in red and blue, respectively. MD simulations suggest that only one orientation of the large loop induced by the disulfide bridge between C22 and C87 is energetically favorable.

Similar articles

Cited by

References

    1. Blancas-Mejia LM, Ramirez-Alvarado M. Systemic amyloidoses. Ann. Rev. Biochem. 2013;82:745–774. doi: 10.1146/annurev-biochem-072611-130030. - DOI - PMC - PubMed
    1. Obici L, Perfetti V, Palladini G, Moratti R, Merlini G. Clinical aspects of systemic amyloid diseases. Biochim. Biophys. Acta. 2005;1753:11–22. doi: 10.1016/j.bbapap.2005.08.014. - DOI - PubMed
    1. Merlini G, Palladini G. Amyloidosis: is a cure possible? Ann. Oncol. 2008;19:63–66. doi: 10.1093/annonc/mdn200. - DOI - PubMed
    1. Wechalekar AD, et al. A European collaborative study of treatment outcomes in 346 patients with cardiac stage III AL amyloidosis. Blood. 2013;121:3420–3427. doi: 10.1182/blood-2012-12-473066. - DOI - PubMed
    1. Liao RL, et al. Infusion of light chains from patients with cardiac amyloidosis causes diastolic dysfunction in isolated mouse hearts. Circulation. 2001;104:1594–1597. doi: 10.1161/circ.104.14.1594. - DOI - PubMed

Publication types

MeSH terms