. 2023 Jun 23;14(1):3744.
doi: 10.1038/s41467-023-39442-0.

Ordering of room-temperature magnetic skyrmions in a polar van der Waals magnet

Affiliations

Ordering of room-temperature magnetic skyrmions in a polar van der Waals magnet

Peter Meisenheimer et al. Nat Commun. .

Abstract

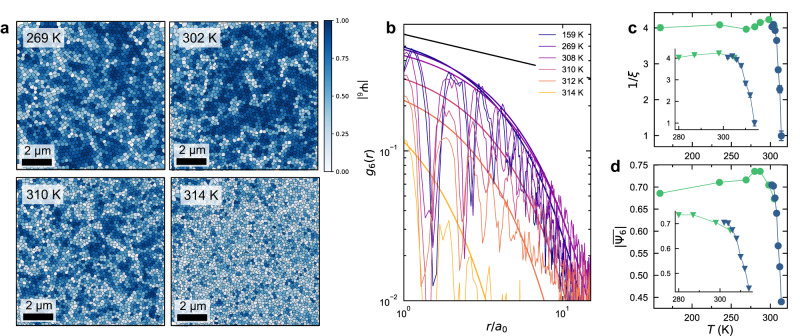
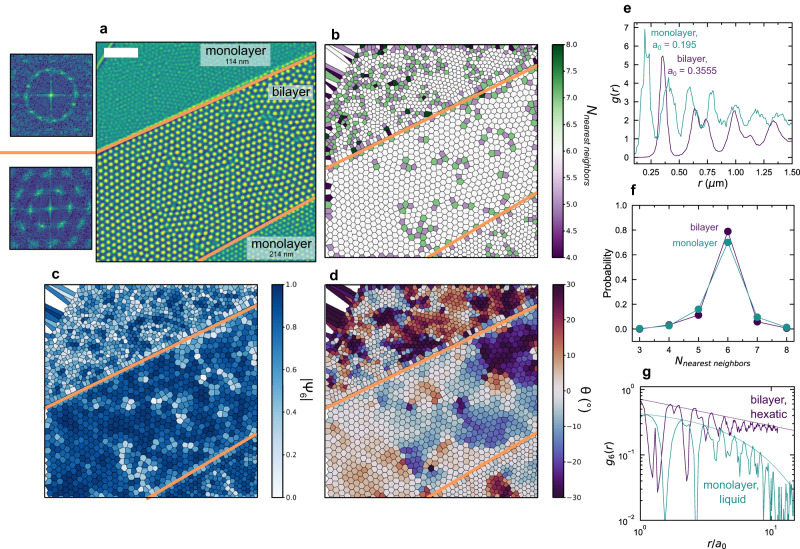
Control and understanding of ensembles of skyrmions is important for realization of future technologies. In particular, the order-disorder transition associated with the 2D lattice of magnetic skyrmions can have significant implications for transport and other dynamic functionalities. To date, skyrmion ensembles have been primarily studied in bulk crystals, or as isolated skyrmions in thin film devices. Here, we investigate the condensation of the skyrmion phase at room temperature and zero field in a polar, van der Waals magnet. We demonstrate that we can engineer an ordered skyrmion crystal through structural confinement on the μm scale, showing control over this order-disorder transition on scales relevant for device applications.


Conflict of interest statement

The authors declare no competing interests.

Figures

Fig. 1
Fig. 1. Layered polar magnet.
a Illustration of the crystallography of FCGT, showing the AA’ stacking which breaks inversion symmetry and allows for a nonzero DMI. b Sample with Néel skyrmions showing multiple regimes of, (c), ordered (close packed, bottom) and disordered (top) skyrmion configurations.
Fig. 2
Fig. 2. Temperature dependence of topological defects.
a MFM images of the FCGT skyrmion lattice at different temperatures. Scale bars are 2 μm. b Voronoi polyhedra showing the number of nearest neighbors for each skyrmion in the image. Green(purple) sites have more(less) than 6 nearest neighbors. When the green and the purple sites neighbor one another, a dislocation is formed from bound topological defects, which is indicative of the disordering in the hexatic phase. c Magnified image of bound defects, illustrating the 5–7 pairs caused by displacement of a single line of skyrmions. The image is scaled up from the box in (a and b). d Histogram of the number of nearest neighbors per site per temperature. We see that that the variance of the Gaussian distribution increases as the temperature is increased. e Peak value of the probabilities of an ideal 6-fold site in (d), showing exponential decay above ~306 K. f Radial distribution function and, (g), correlation length as a function of temperature, showing similar decay as temperature is increased. Correlation length is defined as the last peak in (f) before the intensity decays to 5% of the initial peak.
Fig. 3
Fig. 3. Orientational order parameter.
a Bond orientational maps of skyrmions as a function of temperature, where the magnitude of the bond orientational parameter, Ψ6r, is shown in blue. Qualitatively, the orientational order of the lattice decreases with increasing temperature. Scale bars are 2 μm. b Orientational correlation function, g6r, as a function of temperature, which follows an exponential decay at all temperatures. Fits to erξ are shown as dotted lines. The predicted ideal KTNHY algebraic decay behavior with exponent 1/4 is shown as a solid black line. c The exponent ξ from panel (b) plotted as a function of temperature, showing a clear exponential decrease as temperature is increased. Inset is the temperature range above saturation. d Average Ψ6r as a function of temperature, that shows exponential decay of the orientational order with respect to temperature falling off quickly above ~306 K. Inset shows the temperature range of clear exponential behavior. Light green points in parts (c and d) are superimposed from low-temperature MFM measurements.
Fig. 4
Fig. 4. (S)TEM imaging of defects.
a DF-TEM shows the nominally single phase flake hosts dislocations with periodicities on the order of ~100 nm. b In two beam conditions along the 303¯0 and 03¯30 axes, these dislocations decrease in contrast, indicating that the Burgers‘ vectors lie along 112¯0. c Virtual dark-field images can also be generated from a 4D-STEM dataset by integrating the Bragg peak intensities from reflections. From this data, we are able to calculate the projected in-plane strain fields ε11 (d), ε22 (e), and ε12 (f), along with the in-plane rotation ϕ (g). We note the mis-tilt artifact is inevitable in the present method for strain determination, as shown in red diagonal stripes in (d and e).
Fig. 5
Fig. 5. Simulations of ordering in confined structures.
a Simulated real space images of the skyrmion lattices with periodic (left) and semi-periodic (right) boundary conditions. The fixed edges are shown in orange. Insets show the associated diffraction patterns. Scale bars are 2 μm. b Nearest neighbor map of the same images, where greater(less)-than-6 nearest neighbor sites are shown in green(purple), and (c) bond orientational maps where the magnitude of Ψ6r is shown in blue. d Euler angle of the skyrmion lattice sites from −30° to +30°, with respect to the x axis. Areas of similar color are mosaic domains which are rotationally uniform. e Radial distribution function, (f), histogram of the number of nearest neighbors, and (g), orientational correlation function g6r, where the simulation with periodic boundary conditions shows liquid-like decay and the simulation with semi-periodic boundary conditions shows hexatic-like decay. Shaded regions correspond to standard deviation over 10 simulations. h Average orientational order as a function of aspect ratio and the space between the two aperiodic boundary conditions.
Fig. 6
Fig. 6. Experimental observation of ordering.
a MFM micrograph of a sample with two, monolayer FCGT flakes and a rectangular, bilayer region of overlap. The edges of this region are shown in orange. The calculated structure factors are shown at left. Scale bar is 2 μm. b Nearest neighbor and (c) bond orientational maps of the same image. The monolayer regions can be characterized by long chains of topological defects, whereas the bilayer region forms an approximately single hexatic domain, commensurate with the direction of the confined edges. d Euler angle, Θ, showing the rotational order of the skyrmion lattice sites. The monolayer region shows clear mosaic domains, while the confined, bilayer region is much more uniform. e Radial distribution function showing the increased lattice parameter of the bilayer region, indicating that it behaves semi-classically as a thicker flake of FCGT. f Histogram of the number of nearest neighbors. g g6r, where the monolayer regions show a 2D liquid and the bilayer region shows hexatic behavior. Fits to exponential and algebraic decay are shown as dotted lines.

References

    1. Büttner F, Lemesh I, Beach GSD. Theory of isolated magnetic skyrmions: from fundamentals to room temperature applications. Sci. Rep. 2018;8:4464. doi: 10.1038/s41598-018-22242-8. - DOI - PMC - PubMed
    1. Kanazawa N, Seki S, Tokura Y. Noncentrosymmetric magnets hosting magnetic skyrmions. Adv. Mater. 2017;29:1603227. doi: 10.1002/adma.201603227. - DOI - PubMed
    1. Kläui M. Freezing and melting skyrmions in 2D. Nat. Nanotechnol. 2020;15:726–727. doi: 10.1038/s41565-020-0726-1. - DOI - PubMed
    1. Das S, et al. Observation of room-temperature polar skyrmions. Nature. 2019;568:368–372. doi: 10.1038/s41586-019-1092-8. - DOI - PubMed
    1. Das S, et al. Local negative permittivity and topological phase transition in polar skyrmions. Nat. Mater. 2021;20:194–201. doi: 10.1038/s41563-020-00818-y. - DOI - PubMed