. 2023 Jun 23;3(1):91.
doi: 10.1038/s43856-023-00312-x.

Rapidly adaptable automated interpretation of point-of-care COVID-19 diagnostics

Affiliations

Rapidly adaptable automated interpretation of point-of-care COVID-19 diagnostics

Siddarth Arumugam et al. Commun Med (Lond). .

Abstract

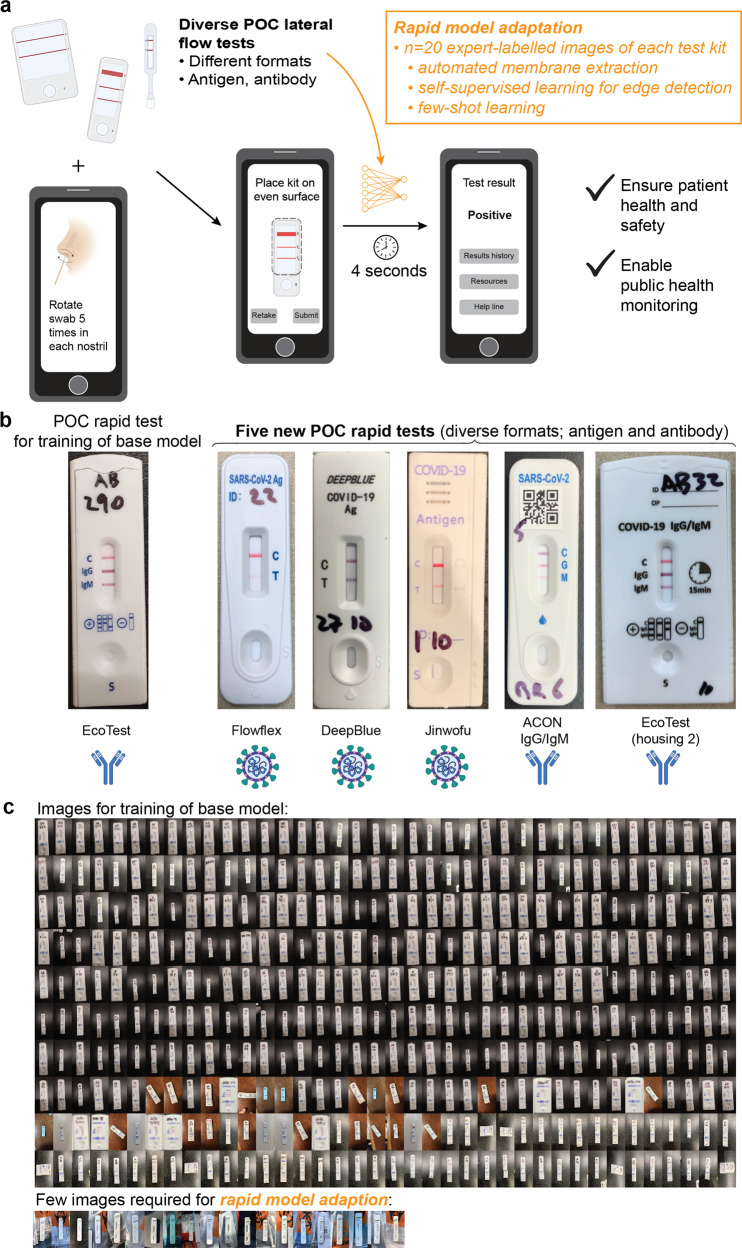
Background: Point-of-care diagnostic devices, such as lateral-flow assays, are becoming widely used by the public. However, efforts to ensure correct assay operation and result interpretation rely on hardware that cannot be easily scaled or image processing approaches requiring large training datasets, necessitating large numbers of tests and expert labeling with validated specimens for every new test kit format.

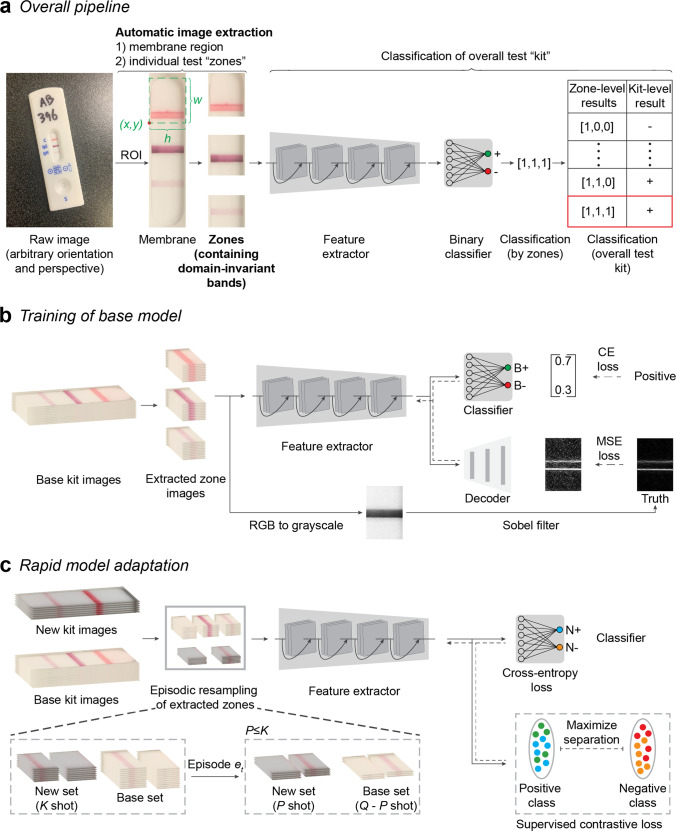
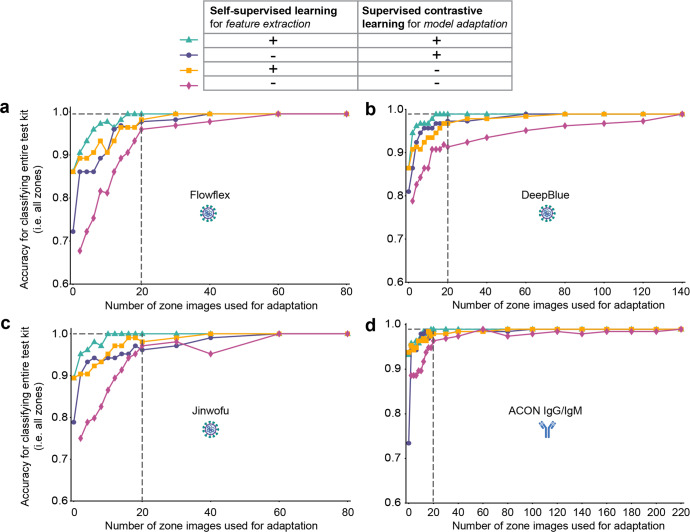
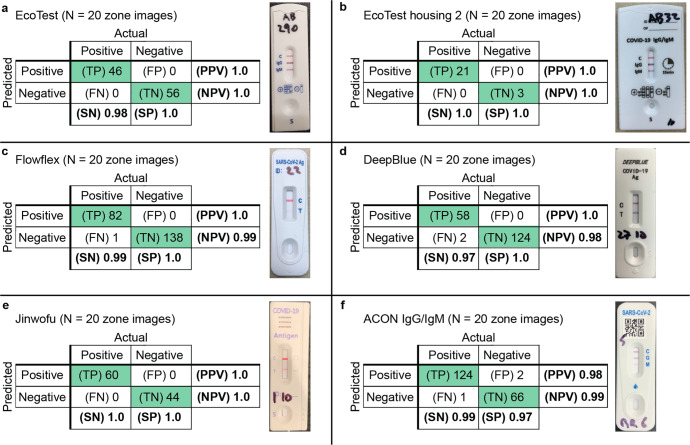
Methods: We developed a software architecture called AutoAdapt POC that integrates automated membrane extraction, self-supervised learning, and few-shot learning to automate the interpretation of POC diagnostic tests using smartphone cameras in a scalable manner. A base model pre-trained on a single LFA kit is adapted to five different COVID-19 tests (three antigen, two antibody) using just 20 labeled images.

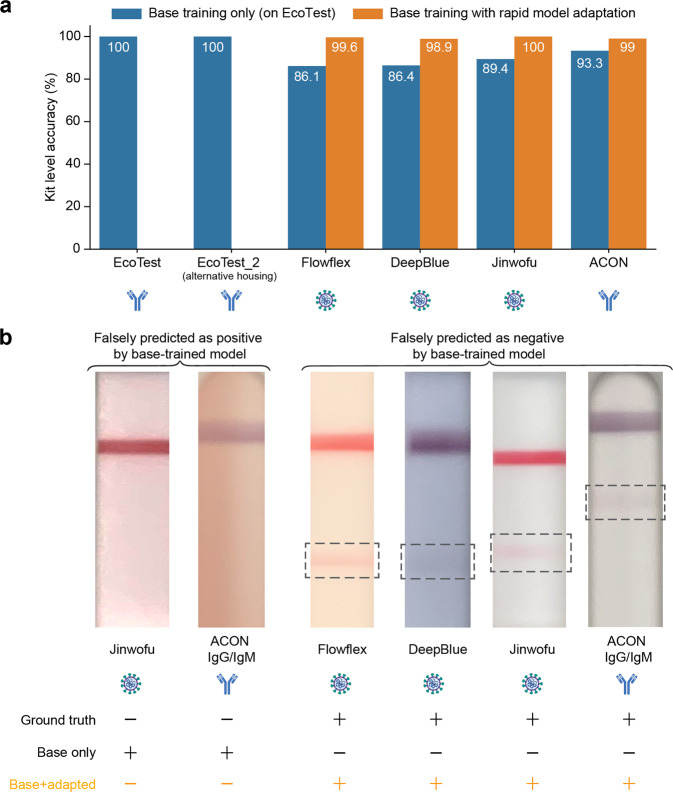
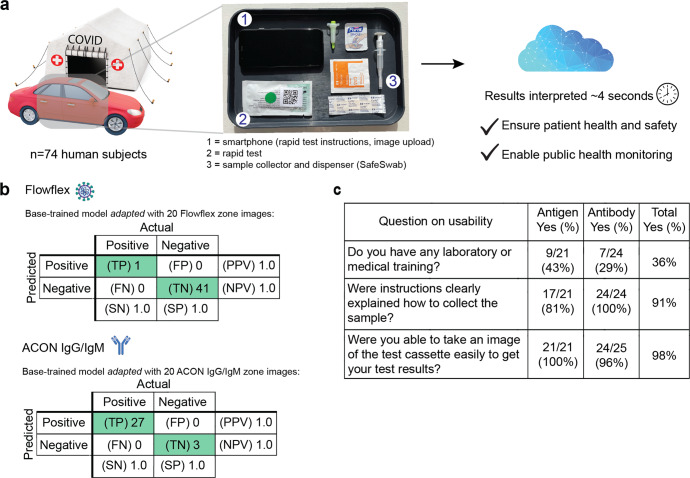
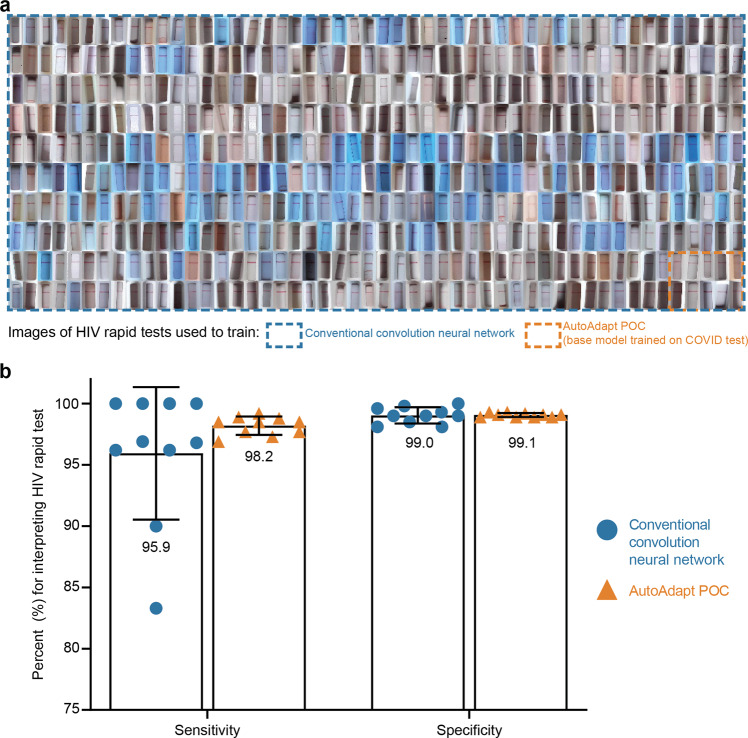
Results: Here we show AutoAdapt POC to yield 99% to 100% accuracy over 726 tests (350 positive, 376 negative). In a COVID-19 drive-through study with 74 untrained users self-testing, 98% found image collection easy, and the rapidly adapted models achieved classification accuracies of 100% on both COVID-19 antigen and antibody test kits. Compared with traditional visual interpretation on 105 test kit results, the algorithm correctly identified 100% of images; without a false negative as interpreted by experts. Finally, compared to a traditional convolutional neural network trained on an HIV test kit, the algorithm showed high accuracy while requiring only 1/50th of the training images.

Conclusions: The study demonstrates how rapid domain adaptation in machine learning can provide quality assurance, linkage to care, and public health tracking for untrained users across diverse POC diagnostic tests.

Plain language summary

It can be difficult to correctly interpret the results of rapid diagnostic tests that give a visual readout, such as COVID rapid tests. We developed a computational algorithm to interpret rapid test results using an image taken by a smartphone camera. This algorithm can easily be adapted for use on results from different test kits. The algorithm was accurate at interpreting results obtained by members of the public using various COVID rapid tests and diagnostic tests with similar outputs used for other infections. The use of this algorithm should enable accurate interpretation of rapid diagnostic tests by members of the public and hence enable improved medical care.


Conflict of interest statement

S.K.S., S.C., S.A., U.M., J.M., G.H., and D.C. declare the following competing interests: A version of this algorithm had been licensed by Columbia University to Safe Health Systems, Inc. Authors with affiliation to Safe Health Systems, Inc. have or had financial interest in Safe Health Systems. All other authors declare no other competing interests.

Figures

Fig. 1
Fig. 1. Overall approach of a rapidly adaptable model for interpreting images of rapid tests that require few training images.
a Overall process of automatically interpreting images from a diverse set of LFAs that span analytical targets, number of test and control bands, and housing and form factor. From a raw image of a LFA, a smartphone can automatically and accurately interpret the result within seconds, using a pre-trained machine-learning model that has been adapted to a specific test kit requiring only 20 images of each new rapid test kit. The considerable reduction in training images can bypass the procurement of large numbers of different types of rapid test kits and expert labeling with thousands of validated specimens per test kit, which is challenging during a pandemic, while ensuring patient health and safety and enabling public health monitoring of results. b Images of a base LFA kit (EcoTest) for pre-training the model, and five new COVID-19 LFA kits (including both antigen and antibody tests) that are interpreted using a rapidly adapted model. c Actual images used for training of a base model, and for rapid model adaptation for a specific new LFA test kit.
Fig. 2
Fig. 2. Overview of AutoAdapt POC machine-learning pipeline.
a From a raw input image of an assay kit, a correction of orientation and perspective is applied to segment an image of an assay kit. From the assay kit image, a segmentation model based on Mask R-CNN is used to extract the membrane region of interest (RoI). Based on measured kit-specific parameters (details in Supplementary Table 3), individual zones are cropped, and passed through a software pipeline consisting of a feature extractor followed by a binary classifier. Classification of each zone allows, via a kit-specific lookup table, for a final classification of assay result (kit-level classification or result) as positive, negative, or invalid. b The feature extractor is pre-trained on the base kit using self-supervised learning task over edge-filtered patterns and fully-supervised binary classification task. For each zone, fully-supervised binary classification is carried out with cross-entropy loss with the annotated binary labels. Sobel filter is used to highlight the edge pixels between the band and the background of the membrane. The edge image after normalization is used as ground truth and the learning process is used to reconstruct an image that resembles the ground truth edge image, with the quality measured in MSE (Mean Square Error). The solid and dashed arrows indicate forward processing and gradient backpropagation, respectively, during the learning process. c Model adaptation is carried out by supervised contrastive learning to regularize the feature extractor and fully-supervised learning to learn an adapted classifier for the new kit. A sampling strategy to build an episode with Q (e.g., 32) images per class is used: for each class (positive or negative), given K (e.g., 10) images available, P (e.g., 4) images are subsampled from the new kit and mixed with Q-P images of the base kit.
Fig. 3
Fig. 3. Comparison of kit-level classification accuracy without adaptation (direct testing) and with adaptation.
a For the direct testing case, the model pre-trained on the base kit was directly applied on each of the new kit’s evaluation dataset. For the adaptation approach, the pre-trained model was adapted to each of the new kits, except for EcoTest housing 2 kit, using 10-shot adaptation (20 zone images) and the performance on their respective evaluation datasets is listed here. (The EcoTest housing 2 kit was identical in all aspects to the base kit expect for the housing, so the direct application of the base model without any adaptation was able to achieve 100% kit-level accuracies.) (n = 1 replicate per condition). b Images illustrating the challenge for few-shot learning. Sample images of challenging cases that were not classified correctly when using the base model without adaptation and were correctly classified using the adapted models. Shown are both false positives and false negatives (likely due to variations in colors and intensities of membrane background and bands).
Fig. 4
Fig. 4. Classification accuracies for four new COVID-19 LFA kits with different numbers of training images used and with ablated models.
Ablation studies were carried out to analyze the relative contributions of self-supervised learning for feature extraction and supervised contrastive learning for adaptation. Each model was evaluated by varying the number of images used in the adaptation. Accuracy scores reported for four new assay kits, Flowflex (a), DeepBlue (b), Jinwofu (c), and ACON IgG/IgM (d). (The EcoTest housing 2 kit was identical in all aspects to the base kit expect for the housing, so the direct application of the base model without any adaptation was able to achieve 100% kit-level accuracies). The maximum accuracy indicates the upper bound attained by training a model from scratch using all training images for each kit.
Fig. 5
Fig. 5. Confusion matrices for the pipeline applied on the evaluation dataset.
The model used both self-supervised pre-training of feature extractor (incorporating edge detection) and supervised contrastive adaptation. Confusion matrices are shown for (a) base kit, and new kits (bf).
Fig. 6
Fig. 6. Application of algorithm for interpreting rapid SARS-CoV-2 antigen and antibody tests from 74 untrained users in a COVID-19 drive-through field study.
a Setup of COVID-19 drive-through field tent, with users performing the tests and collecting the images in their cars. b Confusion matrices showing performance of the rapidly adapted algorithm on both rapid antigen and antibody COVID-19 tests. c Results of surveying 45 untrained users on usability of overall process. Graphics in (a) are from an open-source repository.
Fig. 7
Fig. 7. Comparison of AutoAdapt POC base-trained with a COVID-19 test and rapidly adapted to HIV rapid tests, with a traditional convolutional neural network trained to the HIV rapid tests.
a Training dataset size comparison. The 10 images within the red border demonstrate the number of training images needed by the AutoAdapt POC approach which is a fraction (1/50th) of the images needed by the conventional approach (500 images shown enclosed with the black border). b Bar plot comparing the mean sensitivity and specificity scores across conventional training and AutoAdapt POC (error bars represent standard deviation). Data for conventional convolution neural network is from Fig. 3b in a manuscript published in Nature Medicine (n = 10 replicates per condition).

References

    1. Posthuma-Trumpie GA, Korf J, van Amerongen A. Lateral flow (immuno) assay: its strengths, weaknesses, opportunities and threats. A literature survey. Anal. Bioanal. Chem. 2009;393:569–582. doi: 10.1007/s00216-008-2287-2. - DOI - PubMed
    1. Andryukov BG. Six decades of lateral flow immunoassay: from determining metabolic markers to diagnosing COVID-19. AIMS Microbiol. 2020;6:280–304. doi: 10.3934/microbiol.2020018. - DOI - PMC - PubMed
    1. Ibitoye M, Frasca T, Giguere R, Carballo-Diéguez A. Home testing past, present and future: lessons learned and implications for HIV home tests. AIDS Behav. 2014;18:933–949. doi: 10.1007/s10461-013-0668-9. - DOI - PMC - PubMed
    1. Koczula KM, Gallotta A. Lateral flow assays. Essays Biochem. 2016;60:111–120. doi: 10.1042/EBC20150012. - DOI - PMC - PubMed
    1. Carrio A, Sampedro C, Sanchez-Lopez JL, Pimienta M, Campoy P. Automated low-cost smartphone-based lateral flow saliva test reader for drugs-of-abuse detection. Sensors. 2015;15:29569–29593. doi: 10.3390/s151129569. - DOI - PMC - PubMed