. 2023 Jun 23;24(1):148.
doi: 10.1186/s13059-023-02974-1.

VarID2 quantifies gene expression noise dynamics and unveils functional heterogeneity of ageing hematopoietic stem cells

Affiliations

VarID2 quantifies gene expression noise dynamics and unveils functional heterogeneity of ageing hematopoietic stem cells

Reyna Edith Rosales-Alvarez et al. Genome Biol. .

Abstract

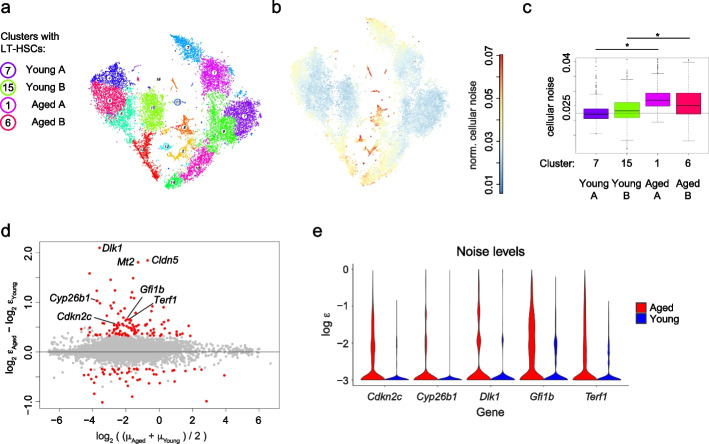
Variability of gene expression due to stochasticity of transcription or variation of extrinsic signals, termed biological noise, is a potential driving force of cellular differentiation. Utilizing single-cell RNA-sequencing, we develop VarID2 for the quantification of biological noise at single-cell resolution. VarID2 reveals enhanced nuclear versus cytoplasmic noise, and distinct regulatory modes stratified by correlation between noise, expression, and chromatin accessibility. Noise levels are minimal in murine hematopoietic stem cells (HSCs) and increase during differentiation and ageing. Differential noise identifies myeloid-biased Dlk1+ long-term HSCs in aged mice with enhanced quiescence and self-renewal capacity. VarID2 reveals noise dynamics invisible to conventional single-cell transcriptome analysis.

Keywords: Ageing; Cell sate variability; Gene expression noise; Hematopoietic stem cells; Machine learning; Mathematical modeling; Single-cell RNA sequencing; Stem cell differentiation.


Conflict of interest statement

DG serves on the scientific advisory board of Gordian Biotechnology.

Figures

Fig. 1
Fig. 1
Local decomposition of gene expression noise in cell state space. a Coefficient of variation as a function of the mean expression on logarithmic scale. The explained variability and its components, Poissonian noise and total UMI count variability, are highlighted. Dot plots correspond to two individual neighborhoods of 101 cells each from a Kit+ hematopoietic progenitor dataset [22]. Violin plots to the right show the distribution of UMI counts and the number of detected features per cell barcode for each of the individual neighborhoods. b Negative binomial model for the UMI counts Xi,j. The variance is split into three components: Poissonian noise, total UMI count variability, and residual biological noise. c Estimation of the dispersion parameter rjt for the two individual neighborhoods shown in a. Mean-normalized total UMI counts βj are fitted by a Gamma distribution, with shape parameter αjt equal to the dispersion parameter rjt in b. d UMAP plot highlighting rjt estimates across the hematopoietic progenitor dataset. MPP, multipotent progenitors; Ly, lymphocytic; Mo, monocytic; GN, granulocytic neutrophil; Ba, basophylic; Mk, megakaryocytic; Ery, erythroid. e Comparison of ε estimates obtained by maximum likelihood (ML) estimation (black) and maximum a posteriori (MAP) estimation (red). A simulated dataset with three levels of gene expression noise was used (see “Methods” and Additional file 1: Figure S1b). Here, only ε estimates corresponding to the highest noise level are shown. f ε estimates for the simulated dataset with three different biological noise levels (“Methods”). Colors highlight groups of genes with different simulated biological noise levels (low, medium, or high). Simulated ground truths of noise values (dashed lines), and median values of the ε estimates (solid lines) are indicated for each group. Hyperparameter γ = 1
Fig. 2
Fig. 2
Elevated noise levels of nuclear versus whole-cell transcriptomes in human PBMCs. a Clustering and UMAP representation of single-nucleus RNA-seq data, consisting of human peripheral blood mononuclear cells (PBMCs) profiled with the Single Cell Multiome kit from 10x Genomics (See Additional file 1: Table S1). b As a, but showing single-cell RNA-seq data. c Quantification of cellular noise (average ε across all genes per cell) across clusters shown in a. The horizontal line indicates the median of CD4 naïve T cell estimates (cluster 3), exhibiting reduced noise levels. d As c, but for cellular noise estimates for the single-cell dataset (see b). The horizontal line indicates the median of CD4 naïve T cell estimates (cluster 3). e Comparison of cellular noise levels between both datasets. The scatter plot shows the average cellular noise per cluster and their corresponding standard deviation (error bars). The x-axis corresponds to the estimates of the nucleus data and the y-axis to the cell data estimates. Similar cell populations between both datasets were identified by dataset integration, see Additional file 1: Figure S2d. f Gene-wise average noise in CD8 naïve T cells, comparing nucleus and cell datasets. Only genes without change in gene expression were selected and grouped into ten equally populated bins based on mean expression as shown in Additional file 1: Figure S2f. g Quantification of PDCD4 (elevated nuclear noise) and PPP1R2 (no changes in noise) expression by smFISH in human CD8 naïve T cells (see also Additional file 1: Figure S2h). Representative images of maximum intensity projections are shown. DAPI in blue, scale bar is 5 μm. h Noise ratio between nuclear and cellular compartments, estimated with VarID2 and smFISH. Error bars indicate standard error (“Methods”). DC, dendritic cells; NK, natural killer cells; TEM, effector memory T cells; Mono, monocytes. Boxplots in c, d, and f: boxes indicate inter-quartile range (IQR), and whiskers correspond to ±1.5*IQR of the box limits. Outliers beyond the whisker limits are depicted
Fig. 3
Fig. 3
Joint analysis of chromatin accessibility, gene expression, and gene expression noise reveals gene modules with distinct modes of regulation. a Two sets of genes were analyzed based on the correlations in Additional file 1: Figure S3a. Class A genes (left side) have positive expression – gene activity and noise – gene activity correlations. Class B genes have positive expression – gene activity correlation but negative noise – gene activity correlation. b Patterns of expression (top), gene activity (middle) and noise (down) of genes belonging to class A. For convenience, a subset of ~ 300 genes is shown. c As b, but showing genes of class B. All genes in this category were included. d Diagram summarizing the observed patterns in chromatin accessibility, expression and noise for the set of genes in class A and class B. See main text for further details. e Genomic region of CD28 (class A gene). Upper panel: normalized accessibility signal, aggregated across cells from selected clusters. Violin plots (top right) show expression and noise levels across each cluster. Differential accessibility test of T cells against the remaining dataset was performed. Peaks (middle panel) were annotated based on increased accessibility (“Open”), no change (“NA”), or decreased accessibility (“Closed”). Threshold values: log2 fold change (log2FC) > 1.25, adjusted P value (padj) < 0.001. Gene linkages [26] between expression and accessibility within individual peaks (links Ex-Pk) or noise and peak accessibility (links N-Pk) are shown in the lower panel, with scores corresponding to Pearson correlation coefficients. These links bind the TSS of the corresponding gene and peaks where a significant correlation was detected, and they do not represent spatial chromatin organization. f As e, but showing data of AKAP13 (class B gene). Differential accessibility test was performed by comparing monocytes against the remaining dataset
Fig. 4
Fig. 4
Gene expression noise increases during hematopoietic differentiation. a UMAP representation of hematopoietic stem and progenitor cells from the bone marrow of wildtype (WT) mice [34]. Major cell populations and VarID2 transition probabilities (“Methods”) between clusters are highlighted. b Quantification of cellular noise (average ε across all genes per cell) across clusters from the WT dataset in a. Horizontal line corresponds to the median noise level of the LT-HSC population. Boxes indicate inter-quartile range (IQR), and whiskers correspond to ±1.5*IQR of the box limits. Outliers beyond the whisker limits are depicted. Vertical axis limits are manually adjusted for better visualization. c UMAP representation of a hematopoietic stem and progenitor cells from Kit W41/W41 mutant mice [34]. d As b, but showing cellular noise estimates of the W41/W41 dataset in c. e Differentially noisy genes identified between the LT-HSC populations of W41/W41 versus WT mice. MA plot shows log2FC of noise on the y-axis, and average expression on the x-axis. Threshold values: log2FC > 1, padj < 0.001. f Pathway enrichment analysis of the genes with increased noise in W41/W41 mice from e. g Noise ε estimates of genes involved in DNA replication. Quantities from each dataset were separated into LT-HSCs and the remaining cells, denoted as MPP. LT-HSC, long-term hematopoietic stem cells; MPP, multipotent progenitors; Ly, lymphocytic; My, myelocytic; Mo, monocytic; GN, granulocytic neutrophil; Ba, basophylic; MC, mast cells; Mk, megakaryocytic; Ery, erythroid; Div; dividing cells
Fig. 5
Fig. 5
Gene expression noise increases in LT-HSCs upon ageing. a t-SNE representation of young and aged hematopoietic stem cells [38], sequenced in two batches A and B (see also Additional file 1: Figure S5a). LT-HSC populations identified based on marker gene expression for each condition and batch identity are highlighted (see also Additional file 1: Figure S5b). b t-SNE plot highlighting cellular noise estimates. c Comparison of cellular noise across the four LT-HSC populations identified in a. Boxes indicate inter-quartile range (IQR), and whiskers correspond to ±1.5*IQR of the box limits. Outliers beyond the whisker limits are depicted. Vertical axis limits are manually adjusted for better visualization. A comparison of old versus young cells for each batch was performed, *P  value < 2.2e − 16 (two-sided Wilcoxon test). d Differentially noisy genes identified across LT-HCS populations, comparing aged versus young samples. MA plot shows log2FC of noise on the y-axis, and average expression on the x-axis. Threshold values: log2FC > 1.25, padj < 0.001. e Noise ε estimates of some example genes detected as highly noisy in aged versus young LT-HSCs in d
Fig. 6
Fig. 6
Dlk1 is a marker of quiescence and enhanced self-renewal in aged HSCs. a Expression of Dlk1 in the dataset from Hérault et al., 2021 [38] (see Fig. 5). b Differentially expressed genes between Dlk1+ and Dlk1− cells across aged LT-HSCs (batch A, cluster 1 in Fig. 5a). Threshold values: log2FC > log21.25, padj < 0.05. c UMAP representation of mCEL-Seq2 data of Dlk1+ and Dlk1− LT-HSC populations purified by flow cytometry. d As c, but highlighting Dlk1+ and Dlk1− LT-HSC sorted cells. e Differential expression analysis of the Dlk1+ versus Dlk1− sorted cells. Threshold values: log2FC > log21.25, padj < 0.05. f Quantification of Dlk1+ and Dlk1− frequency among LT-HSC by flow cytometry from groups of mice with different ages (see experimental set up in Additional file 1: Figure S6c). Error bars indicate standard deviation. g Comparison between the percentage of Dlk1+ cells in LT-HSCs and the percentage of myeloid cells in bone marrow, corresponding to the experiment in Additional file 1: Figure S6c (see also Additional file 1: Figure S6e). Spearman’s ρ=0.80. h Single-cell proliferation assay showing the number of cell divisions in LT-HSCs from young (left, 3 months old) and aged (right, 17–18 months old) mice (n = 3). Error bars indicate standard deviation. i Serial colony-forming unit assays (CFUs) with cells isolated from aged mice (17–18 months old, n = 2). Error bars indicate standard deviation. j Percentage of CD45.2 chimerism in bone marrow 16 weeks post transplantation, showing primary (left) and secondary (right) transplantations (see experimental set up in Additional file 1: Figure S6f). Error bars indicate standard deviation. P value: ns > 0.05, * ≤ 0.05 (one sided t-test). k CD42.5 lineage contribution in the bone marrow 16 weeks post transplantation, showing primary (left) and secondary (right) transplantations. Error bars indicate standard deviation. ND: non-differentiated. Statistical tests in f, h, i, and k: two-way ANOVA test; P value: ns > 0.05, * ≤ 0.05, ** ≤ 0.01, *** ≤ 0.001, **** ≤ 0.0001

References

    1. Stegle O, Teichmann SA, Marioni JC. Computational and analytical challenges in single-cell transcriptomics. Nat Rev Genet. 2015;16:133–145. doi: 10.1038/nrg3833. - DOI - PubMed
    1. Kharchenko PV. The triumphs and limitations of computational methods for scRNA-seq. Nat Methods. 2021;18:723–732. doi: 10.1038/s41592-021-01171-x. - DOI - PubMed
    1. Grün D, van Oudenaarden A. Design and Analysis of Single-Cell Sequencing Experiments. Cell. 2015;163:799–810. doi: 10.1016/j.cell.2015.10.039. - DOI - PubMed
    1. Sagar GD. Deciphering cell fate decision by integrated single-cell sequencing analysis. Ann Rev Biomed Data Sci. 2020;3:1–22. doi: 10.1146/annurev-biodatasci-111419-091750. - DOI - PMC - PubMed
    1. Weinreb C, Rodriguez-Fraticelli A, Camargo FD, Klein AM. Lineage tracing on transcriptional landscapes links state to fate during differentiation. Science. 2020;367:eaaw3381. doi: 10.1126/science.aaw3381. - DOI - PMC - PubMed

Publication types