

Global, regional, and national burden of asthma and its attributable risk factors from 1990 to 2019: a systematic analysis for the Global Burden of Disease Study 2019
- PMID: 37353829
- PMCID: PMC10288698
- DOI: 10.1186/s12931-023-02475-6
Global, regional, and national burden of asthma and its attributable risk factors from 1990 to 2019: a systematic analysis for the Global Burden of Disease Study 2019
Abstract
Background: The burden of asthma in terms of premature death or reduced quality of life remains a huge issue. It is of great importance to evaluate asthma burden geographically and time trends from 1990 to 2019 and to assess the contributions of age, period, and cohort effects at global level.
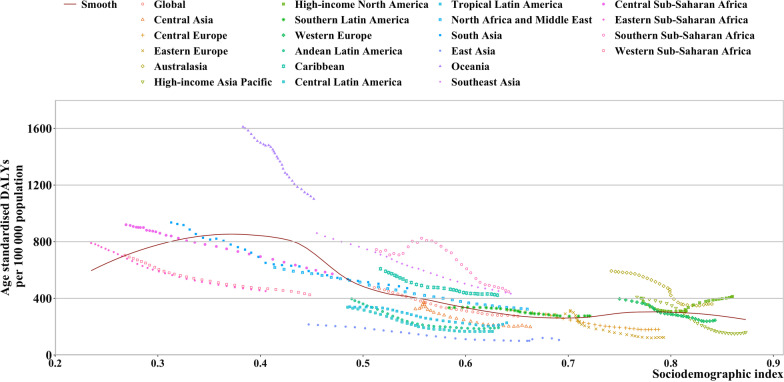
Methods: Asthma prevalence, deaths, and disability adjusted life years (DALYs) as well as risk-attributable burden were collected from the Global Burden of Diseases, Injuries, and Risk Factors Study (GBD) 2019 database and were compared by age and sex. The Smoothing Splines models were used to estimate the relationship between asthma DALYs and the sociodemographic index (SDI). The Age-Period-Cohort model was used to determine effects of ages, periods, and birth cohorts on disease rates.
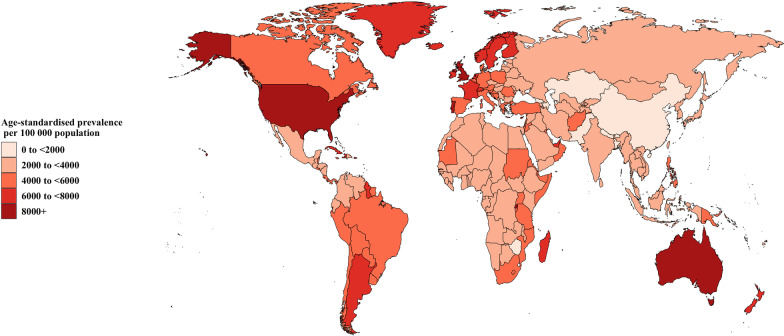
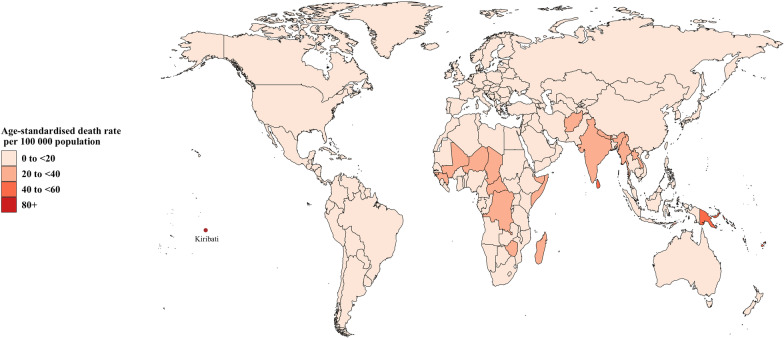
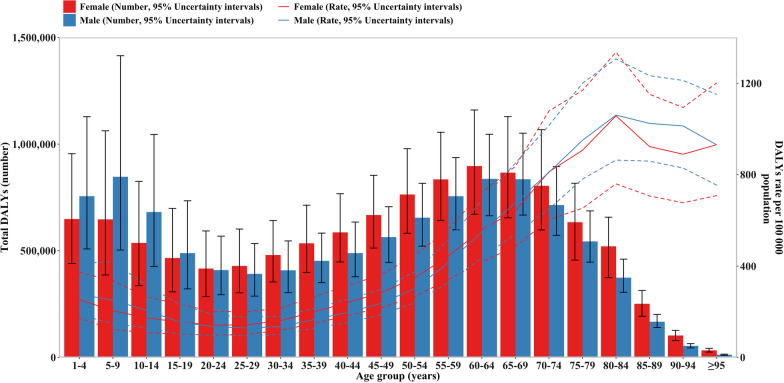
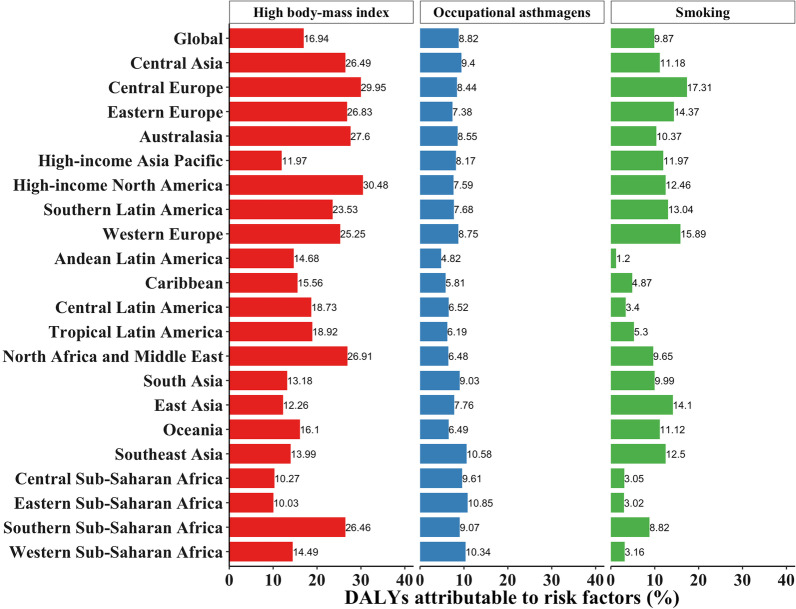
Results: Between 1990 and 2019, the declines were 24.05% (95% uncertainty interval [UI] - 27.24 to - 20.82) in age-standardized asthma prevalence, 51.3% (- 59.08 to - 43.71) in mortality, and 42.55% (- 48.48 to - 36.61) in DALYs rate. However, the burden of asthma continued to rise, with an estimated 262.41 million prevalent cases globally (95% UI 224.05 to 309.45). Asthma caused greater DALYs in females than in males among people aged 20 years and older. The lowest age-standardized DALYs rate was observed at a SDI of approximately 0.70. The Longitudinal age curves showed an approximate W-shaped pattern for asthma prevalence and a likely J-shaped pattern for asthma mortality. The period effect on prevalence and mortality of asthma decreased from 1990 to 2019. Compared with the 1955-1959 birth cohort, the prevalence relative risk (RR) of asthma was highest in the 1905-1909 birth cohort, whereas the mortality RR continued to decline. At the global level, the percentages of high body-mass index, occupational asthmagens, and smoking contributing to DALYs due to asthma were 16.94%, 8.82%, and 9.87%, respectively.
Conclusions: Although the age-standardized rates of asthma burden declined in the past 30 years, the overall burden of asthma remains severe. High body mass index becomes the most important risk factor for DALYs due to asthma at the global level.
Keywords: Age-period-cohort analysis; Asthma; Burden; Risk factors.
© 2023. The Author(s).
Conflict of interest statement
All authors have completed the ICMJE uniform disclosure form. The authors have no conflicts of interest to declare.
Figures
References
-
- Global Initiative for Asthma. Global Strategy for Asthma Management and Prevention, 2023. Available from: www.ginasthma.org.
-
- Global, regional, and national deaths, prevalence, disability-adjusted life years, and years lived with disability for chronic obstructive pulmonary disease and asthma, 1990–2015: a systematic analysis for the Global Burden of Disease Study 2015. Lancet Respir Med. 2017;5(9):691–706. 10.1016/s2213-2600(17)30293-x. - PMC - PubMed
MeSH terms
LinkOut - more resources
Full Text Sources
Medical
Miscellaneous
