. 2023 Aug;32(8):e4710.
doi: 10.1002/pro.4710.

Characterization of the pH-dependent protein stability of 3α-hydroxysteroid dehydrogenase/carbonyl reductase by differential scanning fluorimetry

Affiliations

Characterization of the pH-dependent protein stability of 3α-hydroxysteroid dehydrogenase/carbonyl reductase by differential scanning fluorimetry

Yun-Hao Chou et al. Protein Sci. 2023 Aug.

Abstract

The characterization of protein stability is essential for understanding the functions of proteins. Hydroxysteroid dehydrogenase is involved in the biosynthesis of steroid hormones and the detoxification of xenobiotic carbonyl compounds. However, the stability of hydroxysteroid dehydrogenases has not yet been characterized in detail. Here, we determined the changes in Gibbs free energy, enthalpy, entropy, and heat capacity of unfolding for 3α-hydroxysteroid dehydrogenase/carbonyl reductase (3α-HSD/CR) by varying the pH and urea concentration through differential scanning fluorimetry and presented pH-dependent protein stability as a function of temperature. 3α-HSD/CR shows the maximum stability of 30.79 kJ mol-1 at 26.4°C, pH 7.6 and decreases to 7.74 kJ mol-1 at 25.7°C, pH 4.5. The change of heat capacity of 30.25 ± 1.38 kJ mol-1 K-1 is obtained from the enthalpy of denaturation as a function of melting temperature at varied pH. Two proton uptakes are linked to protein unfolding from residues with differential pKa of 4.0 and 6.5 in the native and denatured states, respectively. The large positive heat capacity change indicated that hydrophobic interactions played an important role in the folding of 3α-HSD/CR. These studies reveal the mechanism of protein unfolding in HSD and provide a convenient method to extract thermodynamic parameters for characterizing protein stability using differential scanning fluorimetry.

Keywords: Gibbs free energy; denaturant; differential scanning fluorimetry; enthalpy; entropy; heat capacity; protein stability curve; thermal unfolding.


Conflict of interest statement

The authors declare no conflicts of interest.

Figures
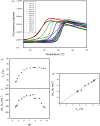
FIGURE 1
FIGURE 1
pH dependence of thermal unfolding of 3α‐HSD/CR by DSF. (a) The thermal unfolding curve of 3α‐HSD/CR was sigmoidal at pH 4.5–9.7. The region of transition shifted to a higher temperature and appeared to be steeper at neutral pH than at acidic or alkaline pH values. The solid lines represent the fit of the data to Equation (1) to obtain T m and ΔH m , as listed in Table 1 and S1. All experiments were performed at least in triplicate at each pH value, and the representative fluorescence melting curves are presented. (b, c) pH‐dependences of T m and ΔH m , respectively. The T m value increased as the pH increased from 4.5, reached a plateau of approximately 52°C at pH 7.6–8.7, then slightly decreased as the pH increased to 9.7. The ΔH m value had a maximum value of 787 ± 17 kJ mol−1 at pH 7.6 and decreased to 385 ± 46 and 372 ± 33 kJ mol−1 at pH 4.5 and 9.7, respectively. Error bars represent the standard deviation of at least three independent measurements. (d) The linear relationship between ΔH m and T m at pH 4.5–7.6. The T m and ΔH m values at each pH are fitted to a linear equation, giving a slope of ΔC p of 30.25 ± 1.38 kJ mol−1 K−1 and an intercept of −772.4 ± 63 kJ mol−1 at 0°C. ΔH U vanished at T h of 25.5°C.
FIGURE 2
FIGURE 2
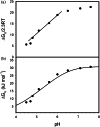
pH dependent ΔG U of 3α‐HSD/CR. (a) ΔG U /2.3RT as a function of pH at 25°C. The ΔG U at pH 4.5–7.6 is listed in Table 1. The line shows that the maximum slope lies between a pH of 4.8 and 6.0, which is 2.0 ± 0.1, the corresponding number of proton uptakes (ΔQ) when the protein unfolds. (b) The ΔG U values at pH 4.5–7.6 were analyzed by fitting the data to Equation (5), giving the pKa of 4.0 ± 0.8 and 6.5 ± 0.2 of the residues of 3α‐HSD/CR in the folded and unfolded states, respectively.
FIGURE 3
FIGURE 3
Thermal unfolding curves of 3α‐HSD/CR in the presence of urea at pH 7.6 by DSF. (a) The fluorescence intensity of the thermal unfolding of 3α‐HSD/CR as a function of temperature in the presence of urea 0–2 M was monitored by DSF and showed a sigmoid curve. The thermal unfolding curves shifted toward lower temperatures as the urea concentration increased. The lines represent the fit of the data to Equation (1) to obtain T m and ΔH m at various urea concentrations. (b) Thermal unfolding curves of (a) were converted to a fraction of the unfolded protein at each temperature. At least three experiments were performed for each concentration of urea. The representative melting curves are shown. (c, d) T m and ΔH m values of 3α‐HSD/CR in the presence of 0–2 M urea at pH 7.6. Both T m and ΔH m decreased as the urea concentration increased. (e) The relationship between ΔH m and T m is linear in 0–1.1 M urea. The data were fitted to a straight line, giving a slope of apparent ΔC p of 27.2 ± 1.7 kJ mol−1 K−1.
FIGURE 4
FIGURE 4
Free energy of the thermal unfolding of 3α‐HSD/CR induced by urea at various temperatures using DSF. (a) Thermal unfolding of 3α‐HSD/CR in 0–2 M urea using DSF. The fraction of unfolding of 3α‐HSD/CR between 0.05 and 0.95 in 0–2 M urea was converted to ΔG U at various temperatures. ΔG U in the presence of urea at temperatures between 41°C and 50°C are shown. The lines fit the ΔG U at different concentrations of urea to Equation (7) at 41–50°C to obtain the ΔG U (H2O) and m values. The dashed line indicates that the ΔG U is equal to 0, where 50% of the enzyme is in the denatured state. (b–d) Temperature dependence of ΔG U (H2O), m, and [urea]0.5, respectively, for urea‐induced unfolding of 3α‐HSD/CR by DSF. Both ΔG U (H2O) and [Urea]0.5 decreased as the temperature decreased, while the m value seemed to be independent of temperature in the range of 41–50°C within the error, giving an average of 2.7 ± 0.2 M.
FIGURE 5
FIGURE 5
Denaturant‐induced denaturation of 3α‐HSD/CR at various temperatures. (a) Relative intrinsic fluorescence intensity of 3α‐HSD/CR in the presence of urea at 15°C, 22°C, 25°C, and 30°C and GdmCl at 22°C, pH 7.6. The fluorescence intensity at 317 nm, measured at each concentration of denaturant, was normalized to that at zero concentration of denaturant. The lines represent the fit of the data to Equation (8). (b) The fraction of unfolding between 0.05 and 0.95 at various concentrations of urea or GdmCl was converted to ΔG U . The lines represent the fitting of ΔG U to the concentrations of urea or GdmCl at the indicated temperatures in Equation (7) to obtain the ΔG U (H2O) and m values. The intercepts of ΔG U of urea‐ and GdmCl‐induced unfolding at 22°C were similar, indicating that the ΔG U (H2O) values obtained using different denaturants were similar.
FIGURE 6
FIGURE 6
(a) Two‐state model of protein denaturation induced by temperature or denaturants. The conformations of protein between the native state (N) and the denatured state (D) are in reversible equilibrium with the equilibrium constant K U and ΔG U which are affected by temperature or denaturants, such as acid, urea, and GdmCl. (b) Protein stability curves of 3α‐HSD/CR at pH 4.5–7.6. The stability of 3α‐HSD/CR decreased as the pH decreased from 7.6 to 4.5. Meanwhile, ΔG U was obtained using different approaches at pH 7.6. The linear extrapolation method was used to evaluate ΔG U through denaturant‐induced denaturation. The circle and diamond symbols represent the ΔG U obtained from the urea‐ and GdmCl‐induced unfolding, respectively, by following the intrinsic fluorescence at the indicated temperatures. The triangles represent the ΔG U near the melting temperature, which was determined by varying 0–2 M urea through DSF. These results are consistent with the ΔG U in the stability curve, which was obtained by fitting the values of ΔH m , T m , and ΔC p determined by DSF to Equation (3) at various temperatures (solid curve). The black dotted line indicates the ΔG U of the maximum stability at T s (Table 1) for the stability curve of 3α‐HSD/CR at the corresponding pH value, where ΔS U is equal to zero and ΔG U is purely enthalpic (ΔH U (T)). (c) The pH‐dependence of protein stability shows a link between the equilibrium constants of proton binding (K a‐N and K a‐D) and conformational unfolding transitions (K D‐N and K D‐NH) in the two‐state model.

Similar articles

Cited by

References

    1. Amaral M, Kokh DB, Bomke J, Wegener A, Buchstaller HP, Eggenweiler HM, et al. Protein conformational flexibility modulates kinetics and thermodynamics of drug binding. Nat Commun. 2017;8:2276. - PMC - PubMed
    1. Baldwin RL. Temperature dependence of the hydrophobic interaction in protein folding. Proc Natl Acad Sci U S A. 1986;83:8069–72. - PMC - PubMed
    1. Becktel WJ, Schellman JA. Protein stability curves. Biopolymers. 1987;26:1859–77. - PubMed
    1. Bergsdorf C, Wright SK. A guide to run affinity screens using differential scanning fluorimetry and surface Plasmon resonance assays. Methods Enzymol. 2018;610:135–65. - PubMed
    1. Bruylants G, Wouters J, Michaux C. Differential scanning calorimetry in life science: thermodynamics, stability, molecular recognition and application in drug design. Curr Med Chem. 2005;12:2011–20. - PubMed

Publication types

Substances

LinkOut - more resources