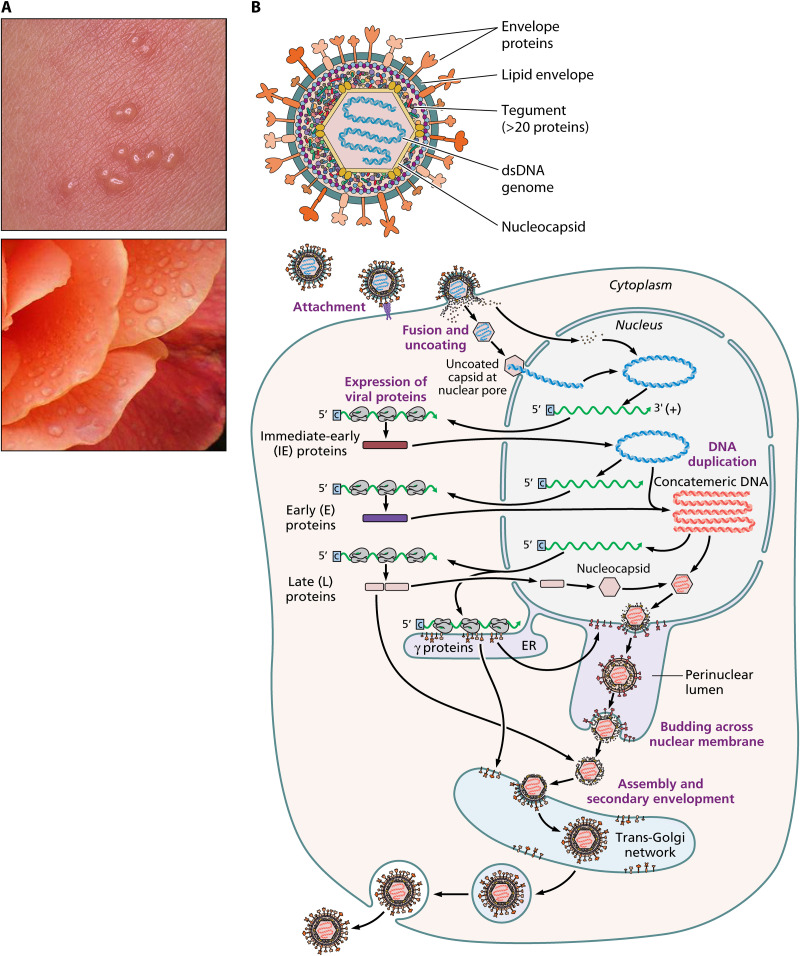
Creating the "Dew Drop on a Rose Petal": the Molecular Pathogenesis of Varicella-Zoster Virus Skin Lesions
- PMID: 37354037
- PMCID: PMC10521358
- DOI: 10.1128/mmbr.00116-22
Creating the "Dew Drop on a Rose Petal": the Molecular Pathogenesis of Varicella-Zoster Virus Skin Lesions
Abstract
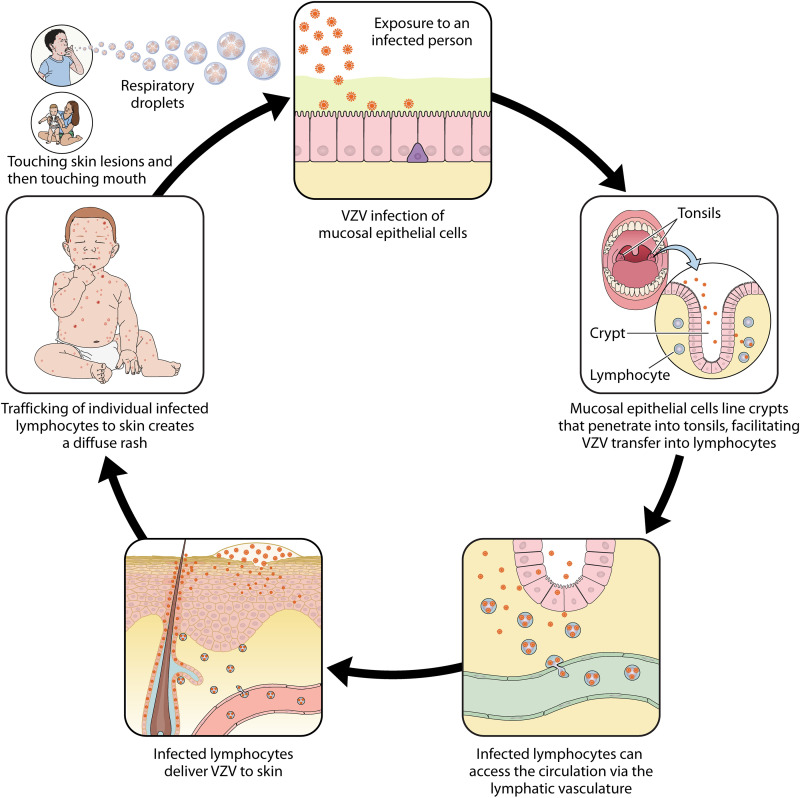
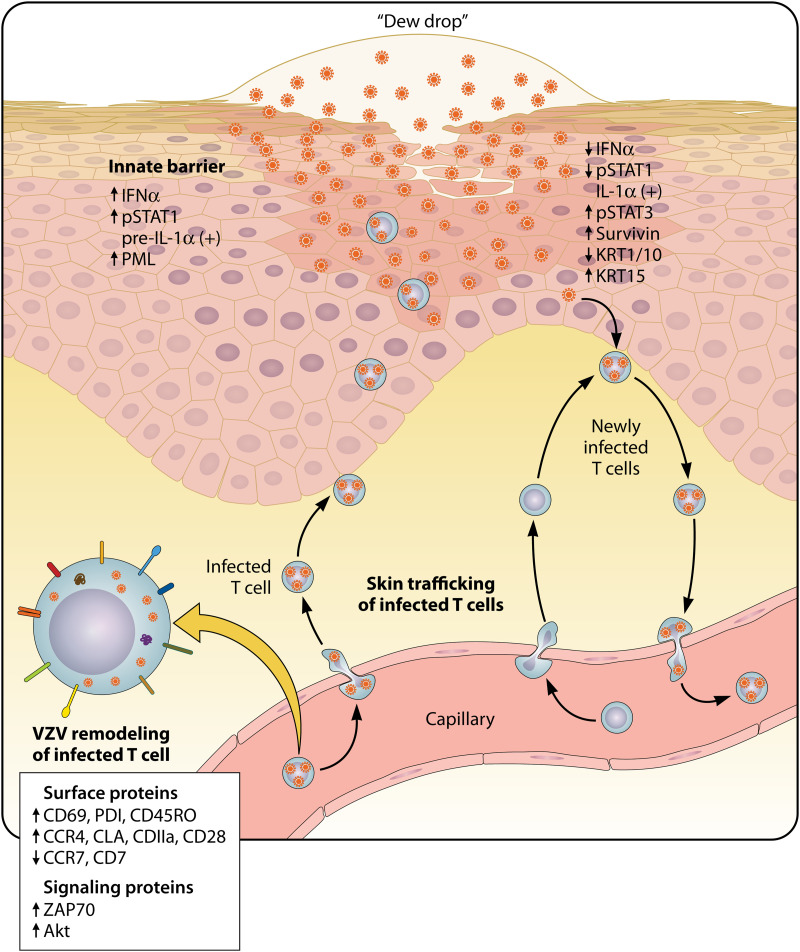
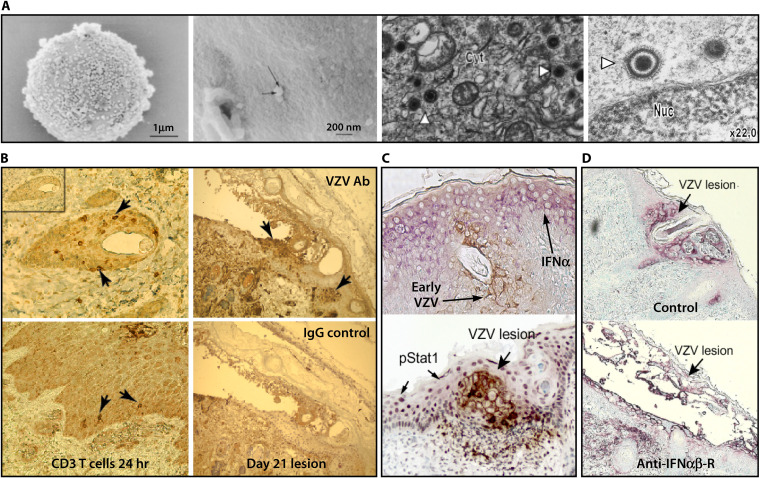
Varicella-zoster virus (VZV) is a human alphaherpesvirus that causes varicella (chicken pox) as the primary infection in a susceptible host. Varicella is very contagious through its transmission by direct contact with vesicular skin lesions that contain high titers of infectious virus and respiratory droplets. While the clinical manifestations of primary VZV infection are well recognized, defining the molecular mechanisms that drive VZV pathogenesis in the naive host before adaptive antiviral immunity is induced has been a challenge due to species specificity. This review focuses on advances made in identifying the differentiated human host cells targeted by VZV to cause varicella, the processes involved in viral takeover of these heterogenous cell types, and the host cell countermeasures that typically culminate in a benign illness. This work has revealed many unexpected and multifaceted mechanisms used by VZV to achieve its high prevalence and persistence in the human population.
Keywords: herpesvirus; varicella-zoster virus; viral pathogenesis.
Conflict of interest statement
The author declares no conflict of interest.
Figures

References
-
- Arvin AM, Abendroth A. 2021. Varicella-zoster virus, chapter 13. In Howley PM, Knipe DM. (ed), Fields virology, volume 2, 7th edition. Lippincott Williams & Wilkins, Philadelphia, PA.
-
- Gershon A, Marin M, Seward JF. 2018. Live attenuated varicella vaccine, p 1145–1180. In Plotkin S, Orenstein WA, Offit PA, Edwards KM (ed), Vaccines. WB Saunders, Philadelphia, PA.
Publication types
MeSH terms
Grants and funding
LinkOut - more resources
Full Text Sources
Medical