Review
. 2023 Sep 1:1272:341425.
doi: 10.1016/j.aca.2023.341425. Epub 2023 May 31.

Magnetophoretic circuits: A review of device designs and implementation for precise single-cell manipulation

Affiliations
Review

Magnetophoretic circuits: A review of device designs and implementation for precise single-cell manipulation

Roozbeh Abedini-Nassab et al. Anal Chim Acta. .

Abstract

Lab-on-a-chip tools have played a pivotal role in advancing modern biology and medicine. A key goal in this field is to precisely transport single particles and cells to specific locations on a chip for quantitative analysis. To address this large and growing need, magnetophoretic circuits have been developed in the last decade to manipulate a large number of single bioparticles in a parallel and highly controlled manner. Inspired by electrical circuits, magnetophoretic circuits are composed of passive and active circuit elements to offer commensurate levels of control and automation for transporting individual bioparticles. These specifications make them unique compared to other technologies in addressing crucial bioanalytical applications and answering fundamental questions buried in highly heterogeneous cell populations. In this comprehensive review, we describe key theoretical considerations for manufacturing and simulating magnetophoretic circuits. We provide a detailed tutorial for operating magnetophoretic devices containing different circuit elements (e.g., conductors, diodes, capacitors, and transistors). Finally, we provide a critical comparison of the utility of these devices to other microchip-based platforms for cellular manipulation, and discuss how they may address unmet needs in single-cell biology and medicine.


Conflict of interest statement

Declaration of competing interest The authors declare that they have no known competing financial interests or personal relationships that could have appeared to influence the work reported in this paper.

Figures

Figure 1:
Figure 1:
Schematic illustration of the forces acting on a magnetic particle and the energy distribution in a magnetophoretic chip. (a) Forces acting on a particle are depicted. (b–e) The effects of two-dimensional and tri-axial magnetic fields are shown. The magnetic energy landscape above a circular magnetic disk, (b) exposed to an in-plane two-dimensional magnetic field, and (c) in a tri-axial magnetic field are represented. The blue and red regions depict the regions with low and high magnetic energies, respectively (energy is min–max normalized). The black arrow and the dot represent the external magnetic field direction and a vertical magnetic field, respectively. Side view schematic illustrations of magnetic particles in a (d) two-dimensional and a (e) tri-axial magnetic field. The black circles and the shaded area represent the magnetic particles and the substrate, respectively. The blue and red arrows depict the attractive and repulsive forces, respectively. N and S represent the north and south poles, respectively.
Figure 2:
Figure 2:
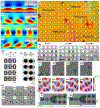
(a–d) Magnetophoretic conduction of magnetic particles in a microfluidic environment. (a) Time sequences of energy distributions and trajectories for a single particle moving along a magnetic track composed of half-disks connected in series. The corresponding experimental results are shown in the insets. The blue and red areas represent the regions with low and high energies, respectively. The arrows at each panel represent the direction of the external magnetic field. Reprinted with permission from [53]. Snapshots of particle transport at various timepoints along the (b: i) bar-shape, (b: ii) drop-shape (reprinted with permission from [66]), (c) elliptical shape (reprinted with permission from [67]), and (f) triangle-shape designs are shown. Reprinted with permission from [61] under a Creative Commons Attribution 4.0 International License. (d) Experimental trajectories of magnetic particles moving on an array of 5 μm circular magnetic disks with 3 μm gaps when exposed to an in-plane rotating magnetic field are illustrated. Singlets and doublets experience diagonal and orthogonal transport. Reprinted from [64], Copyright (2022), with permission from Elsevier. (e) Particle transport along magnetic disks in a magnetic field perpendicular to the substrate. Reprinted with permission from [68] under a Creative Commons Attribution 4.0 International License. (g) A bifurcation design is shown. The motion of cells in clockwise and counterclockwise rotating magnetic fields (depicted by circular arrows). Reprinted with permission from [69].
Figure 3:
Figure 3:
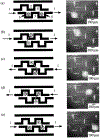
(a–d) Particle conduction based on current-carrying wires is illustrated. (a–e) Particle transport sequences between spots shown by numbers 1–5 are shown. The left and right columns illustrate the schematic illustrations and the corresponding experimental microscopy images, respectively. The arrows depict the direction of the applied electrical current at each step. Reprinted from [74], with the permission of AIP Publishing.
Figure 4:
Figure 4:
Energy landscapes for the drop-shape magnetophoretic conductor for field angles of (a) θ = 0°, (b) θ = 45°, (c) θ = 90°, (d) θ = 135°, (e) θ = 180°, (f) θ = 225°, (g) θ = 270°, and (h) θ = 315° are shown. The black arrows, blue dots, blue regions, and red regions represent the external field direction, experimental particle trajectories, regions of low energies, and regions of high energies, respectively. Reprinted from [58] with permission from John Wiley & Sons Inc.
Figure 5:
Figure 5:
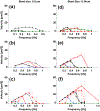
Magnetic particle velocities as a function of driving frequency for the drop-shape magnetophoretic conductors. The left and right columns represent the data for particles with diameters of 5.6 μm and 8.4 μm, respectively. The first, second, and third rows show data for magnetic fields of 25 Oe, 50 Oe, and 100 Oe, respectively. The field cone angles of ψ = 26° (dashed red), ψ = 37° (dashed black), ψ = 45° (solid red), ψ = 53° (solid black), ψ = 63° (blue), and ψ = 90° (green) are tested. Reprinted from [58] with permission from John Wiley & Sons Inc.
Figure 6:
Figure 6:
The zigzag and TI conductor designs are presented. (a, c, e, g, i) Potential energy landscapes, where brighter shades represent lower potential energies. (b, d, f, h, j) Microscopy images of 2.8-μm-diameter magnetic particles transported using the conductor. Scale bars represent 10 microns. Reprinted from [62] with permission from the American Physical Society. (k) Energy distribution along a magnetic bar and the forces on a particle are presented. (l) Schematic illustration of droplet manipulation along a TI conductor. Reprinted with permission from [81].
Figure 7:
Figure 7:
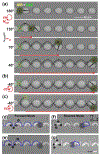
Diode circuit elements are presented. A rat embryonic fibroblast is transported along the magnetic tracks in (a–c). (a) Clockwise and (b) counterclockwise rotating magnetic fields are applied. (c) A cell placed on the upper side of the track in a counterclockwise rotating magnetic field is shown. Reprinted from [82], with the permission of AIP Publishing. (d–g) Diodes operating in a tri-axial magnetic field are presented. (d, e) The diodes are biased in forward mode. (f, g) The diodes are biased in reverse mode. The blue lines depict the experimental particle trajectories. The numbers 1 to 4 indicate the sequence of stable positions of the particles. Position 1 depicts the particle position where the in-plane magnetic field is applied along the +x direction, with the rest of the numbers indicating particle positions at sequential ±90° rotations. Reprinted from [58] with permission from John Wiley & Sons Inc.
Figure 8:
Figure 8:
Magnetophoretic capacitors. (a) The three rows show snapshots at various timepoints in a clockwise-rotating magnetic field; magnetic particles move into the capacitor area on the magnet in the middle. The left column illustrates the energy distributions. The columns in the middle and on the right represent experimental results with a magnetic bead and a magnetized cell, respectively. (b) The stored particle is released in a counterclockwise-rotating magnetic field. Reprinted with permission from [69]. (c) Both bright-field and fluorescent images are presented. (c: i) A single T-lymphocyte and (c: ii) B-lymphocyte are loaded in capacitors. (c: iii) Cell mitosis in a capacitor is demonstrated. (c: iv) A pair of B cells is represented. (c: v) A pair of cells (B- and T-lymphocytes) is stored in the capacitor. Scale bars are 40 μm. The figure is taken from [49] with permission from Nature Publishing Group under a Creative Commons Attribution 3.0 Unported License. (d) A capacitor based on the deposition of magnetic materials in microwells is fabricated to capture the particles. The snapshots before and after loading the capacitors with particles are shown. The figure is reproduced with permission from [37].
Figure 9:
Figure 9:
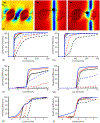
Simulation results for a magnetophoretic transistor. The energy landscapes for (a) a semiconducting gap (i.e., no gate current), (b) a transistor with a straight gait, and (c) a transistor with a curved gate are shown. The width of the wire is 0.12D, where D is one disk period. The switching efficiencies for (d,f) the transistor with a straight gate and (e,g) the transistor with a curved gate are plotted. The magnified versions of (d) and (e) are illustrated in (f) and (g), respectively. In (d–g) plots for β = 1.0 (solid blue), β = 0.9 (solid red), β = 0.8 (solid black), β = 0.7 (dashed blue), β = 0.6 (dashed red), and β = 0.5 (dashed black) are shown. The switching efficiency for (h) a transistor with a straight gate and (i) a transistor with a curved gate are shown, where β = 1, and the ratio of the particle radius to magnet radius is 0.15 (dashed black), 0.25 (dashed red), 0.35 (solid black), 0.45 (solid red), and 0.55 (solid blue). The black arrows depict the direction of the externally applied magnetic field. The blue and red areas depict the regions with low and high magnetic energies, respectively. The black dotted lines represent the particle trajectory. Reprinted from [83] with permission from AIP Publishing.
Figure 10:
Figure 10:
Storing single particles in a magnetomicrofluidic chip in two phases. (a) In the first phase, hydrodynamic forces move the particles into the hydrodynamic traps. The particle trajectory is depicted with a black dotted line. (b) In the second phase, the magnetophoretic circuits move the captured particles into the storage sites. The particle trajectory is depicted with a green dotted line. (c) The particle trapping efficiency for particles with diameters of 5 μm (black bars), 10 μm (patterned bars), and 15 μm (white bars) are plotted. (d) The magnetic transport efficiency for the particles is represented. © 2019 IEEE. Reprinted from [54] with permission from IEEE.
Figure 11:
Figure 11:
A biomolecule detection platform based on the magnetomicrofluidic chips is illustrated. (a) Biotinylated bovine serum albumin is the linker between streptavidin-coated magnetic beads. A permanent magnet brings the beads close to each other to higher the bead-bead binding probability. (b) Double-stranded DNA (dsDNA) is a linker between streptavidin-coated magnetic beads. (c) The dsDNA linked magnetic beads are separated from single particles in a rotating magnetic field. Reproduced from [106] with permission from Nature Publishing Group under a Creative Commons Attribution 4.0 International License.
Figure 12:
Figure 12:. Size-based cell separation.
a) Trajectories of live and drug-treated dead THP-1 cells with blue and red dashed lines are depicted. b) Bright-field and fluorescence images of the cells in capacitors are shown (green: live, red: dead). c) Trajectories of different sizes of live THP-1 cells are illustrated. d) Bright-field and fluorescence images of the live single cells in the individual capacitors are presented (green: live). Rooms 1 and 2 are magnetophoretic capacitors. Reprinted from [44] under the terms of the Creative Commons CC BY license.

Similar articles

Cited by

References

    1. Ryan DP, et al., 3D particle transport in multichannel microfluidic networks with rough surfaces. Sci Rep, 2020. 10(1): p. 13848. - PMC - PubMed
    1. Panhwar MH, et al., High-throughput cell and spheroid mechanics in virtual fluidic channels. Nature Communications, 2020. 11(1): p. 2190. - PMC - PubMed
    1. Bußmann A, et al. Microfluidic Cell Transport with Piezoelectric Micro Diaphragm Pumps. Micromachines, 2021. 12, DOI: 10.3390/mi12121459. - DOI - PMC - PubMed
    1. Shields Iv CW, et al., Translating microfluidics: Cell separation technologies and their barriers to commercialization. Cytometry Part B: Clinical Cytometry, 2017. 92(2): p. 115–125. - PMC - PubMed
    1. Shields CW, Reyes CD, and López GP, Microfluidic cell sorting: a review of the advances in the separation of cells from debulking to rare cell isolation. Lab Chip, 2015. 15(5): p. 1230–49. - PMC - PubMed

LinkOut - more resources