. 2023 Jun 24;23(1):428.
doi: 10.1186/s12879-023-08368-9.

The impact of national and international travel on spatio-temporal transmission of SARS-CoV-2 in Belgium in 2021

Affiliations

The impact of national and international travel on spatio-temporal transmission of SARS-CoV-2 in Belgium in 2021

Minh Hanh Nguyen et al. BMC Infect Dis. .

Abstract

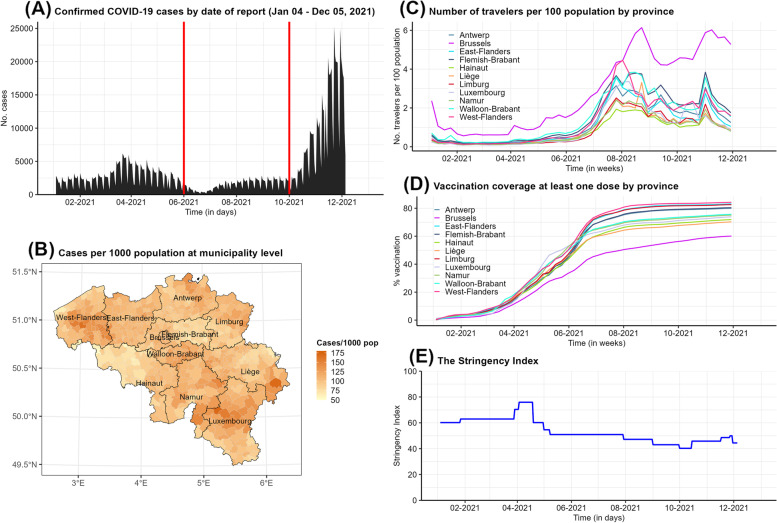
Background: The Severe Acute Respiratory Syndrome Coronavirus 2 (SARS-CoV-2) has rapidly spread over the world and caused tremendous impacts on global health. Understanding the mechanism responsible for the spread of this pathogen and the impact of specific factors, such as human mobility, will help authorities to tailor interventions for future SARS-CoV-2 waves or newly emerging airborne infections. In this study, we aim to analyze the spatio-temporal transmission of SARS-CoV-2 in Belgium at municipality level between January and December 2021 and explore the effect of different levels of human travel on disease incidence through the use of counterfactual scenarios.

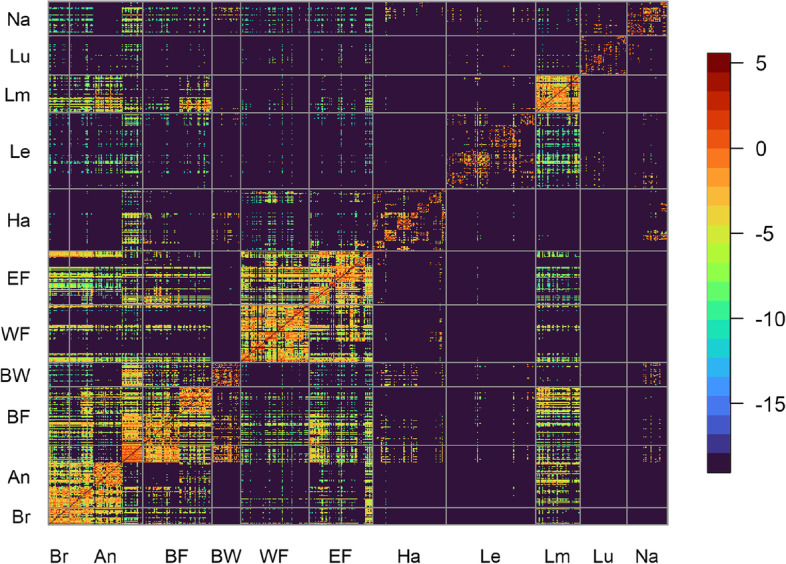
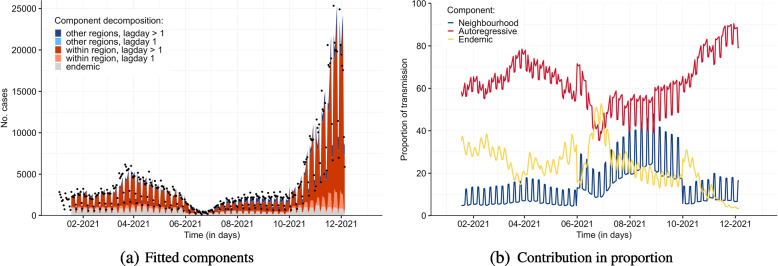
Methods: We applied the endemic-epidemic modelling framework, in which the disease incidence decomposes into endemic, autoregressive and neighbourhood components. The spatial dependencies among areas are adjusted based on actual connectivity through mobile network data. We also took into account other important factors such as international mobility, vaccination coverage, population size and the stringency of restriction measures.

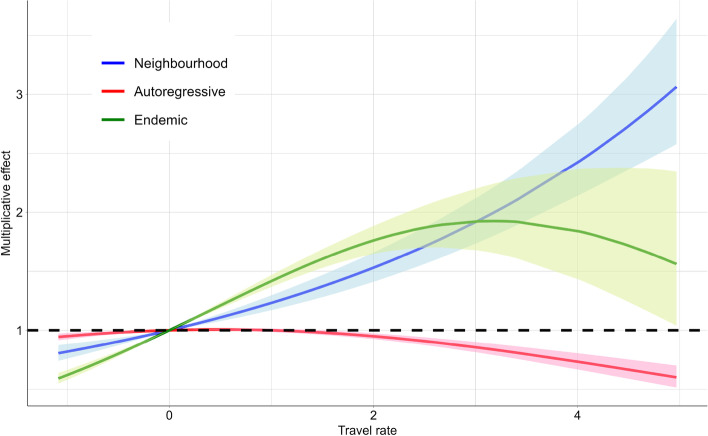
Results: The results demonstrate the aggravating effect of international travel on the incidence, and simulated counterfactual scenarios further stress the alleviating impact of a reduction in national and international travel on epidemic growth. It is also clear that local transmission contributed the most during 2021, and municipalities with a larger population tended to attract a higher number of cases from neighboring areas.

Conclusions: Although transmission between municipalities was observed, local transmission was dominant. We highlight the positive association between the mobility data and the infection spread over time. Our study provides insight to assist health authorities in decision-making, particularly when the disease is airborne and therefore likely influenced by human movement.

Keywords: COVID-19; Human mobility; International travel; Spatio-temporal model.


Conflict of interest statement

The authors declare no competing interests.

Figures

Fig. 1
Fig. 1
Distribution of reported cases by date (A) and municipality (B) and time-dependent data on international travelers per 100 inhabitants (C), vaccination coverage of at least one dose of COVID-19 vaccine (D), and stringency index (E) in Belgium from Week 2021-1 (04/1/2021) to Week 2021-48 (05/12/2021). Two vertical red lines in (A) are to distinguish between the three time periods considered in our analyses: January - May, June - September, and October - December 2021
Fig. 2
Fig. 2
National mobility between September 1, 2020 and June 6, 2021. The y-axis represents the origin while the x-axis is the destination. Different municipalities are grouped according to the 10 Belgian provinces and Brussels-Capital Region (Brussels (Br), Antwerp (An), Flemish Brabant (BF), Walloon Brabant (BW), West Flanders (WF), East Flanders (EF), Hainaut (Ha), Liège (Le), Limburg (Lm), Luxembourg (Lu), and Namur (Na)
Fig. 3
Fig. 3
The left panel (a) shows the fitted components of the selected model on COVID-19 cases in Belgium; the dots indicate the observed number of daily confirmed cases. The right panel (b) depicts the proportions of transmission that can be attributed to each of the three components (i.e., endemic, autoregressive and neighbourhood)
Fig. 4
Fig. 4
Impact of travel rate (proportion of incoming travelers per 100 population, centered) on the number of cases. The lines and envelopes are the mean estimate and 95%CI for the endemic (green), autoregressive (red) and neighbourhood component (blue)
Fig. 5
Fig. 5
Lag distribution estimated from the data, a gamma distribution and two log-normal distributions
Fig. 6
Fig. 6
Comparison of simulation-based predictions for the number of infections in three mobility scenarios: travel rate as observed (blue), travel rate at the minimum level observed (yellow), and no connectivity between municipalities (red) against the observed values (bar chart). In each simulation, the lower and upper lines represent the pointwise 2.5% and 97.5% simulation-based percentiles for each day; the middle line displays the mean values

Similar articles

Cited by

References

    1. Pullano G, Valdano E, Scarpa N, Rubrichi S, Colizza V. Evaluating the effect of demographic factors, socioe conomic factors, and risk aversion on mobility during the COVID-19 epidemic in France under lockdown: A population-based study. Lancet Digit Health. 2020;2(12):e638–49. doi: 10.1016/S2589-7500(20)30243-0. - DOI - PMC - PubMed
    1. Coletti P, Libin P, Petrof O, Willem L, Abrams S, Herzog SA, et al. A data-driven metapopulation model for the Belgian COVID-19 epidemic: Assessing the impact of lockdown and exit strategies. BMC Infect Dis. 2021;21(1):1–12. doi: 10.1186/s12879-021-06092-w. - DOI - PMC - PubMed
    1. Grimée M, DunbarMBN, Hofmann F, Held L, et al. Modelling the effect of a border closure between Switzerland and Italy on the spatiotemporal spread of COVID-19 in Switzerland. Spat Stat. 2022;49:100552. - PMC - PubMed
    1. Vinceti M, Filippini T, Rothman KJ, Ferrari F, Goffi A, Maffeis G, et al. Lockdown timing and efficacy in controlling COVID-19 using mobile phone tracking. EClinicalMedicine. 2020;25:100457. doi: 10.1016/j.eclinm.2020.100457. - DOI - PMC - PubMed
    1. Cot C, Cacciapaglia G, Sannino F. Mining Google and Apple mobility data: Temporal anatomy for COVID-19 social distancing. Sci Rep. 2021;11(1):1–8. doi: 10.1038/s41598-021-83441-4. - DOI - PMC - PubMed