. 2023 Jun 24;18(1):41.
doi: 10.1186/s13024-023-00630-7.

Targeted degradation of ⍺-synuclein aggregates in Parkinson's disease using the AUTOTAC technology

Affiliations

Targeted degradation of ⍺-synuclein aggregates in Parkinson's disease using the AUTOTAC technology

Jihoon Lee et al. Mol Neurodegener. .

Erratum in

Abstract

Background: There are currently no disease-modifying therapeutics for Parkinson's disease (PD). Although extensive efforts were undertaken to develop therapeutic approaches to delay the symptoms of PD, untreated α-synuclein (α-syn) aggregates cause cellular toxicity and stimulate further disease progression. PROTAC (Proteolysis-Targeting Chimera) has drawn attention as a therapeutic modality to target α-syn. However, no PROTACs have yet shown to selectively degrade α-syn aggregates mainly owing to the limited capacity of the proteasome to degrade aggregates, necessitating the development of novel approaches to fundamentally eliminate α-syn aggregates.

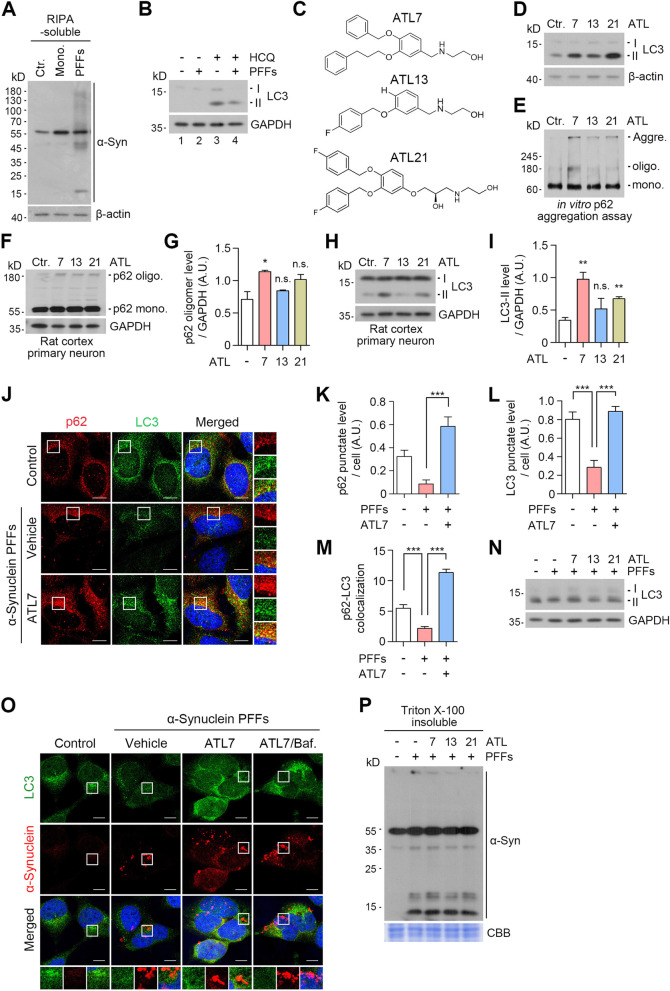
Methods: We employed AUTOTAC (Autophagy-Targeting Chimera), a macroautophagy-based targeted protein degradation (TPD) platform developed in our earlier studies. A series of AUTOTAC chemicals was synthesized as chimeras that bind both α-syn aggregates and p62/SQSTM1/Sequestosome-1, an autophagic receptor. The efficacy of Autotacs was evaluated to target α-syn aggregates to phagophores and subsequently lysosomes for hydrolysis via p62-dependent macroautophagy. The target engagement was monitored by oligomerization and localization of p62 and autophagic markers. The therapeutic efficacy to rescue PD symptoms was characterized in cultured cells and mice. The PK/PD (pharmacokinetics/pharmacodynamics) profiles were investigated to develop an oral drug for PD.

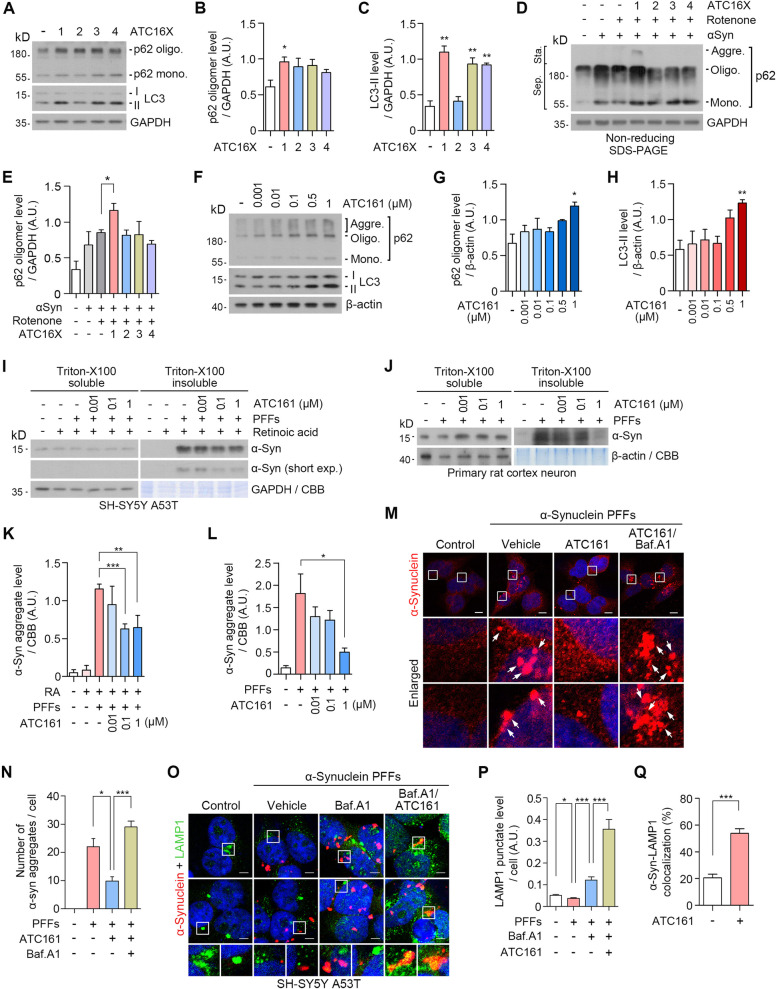
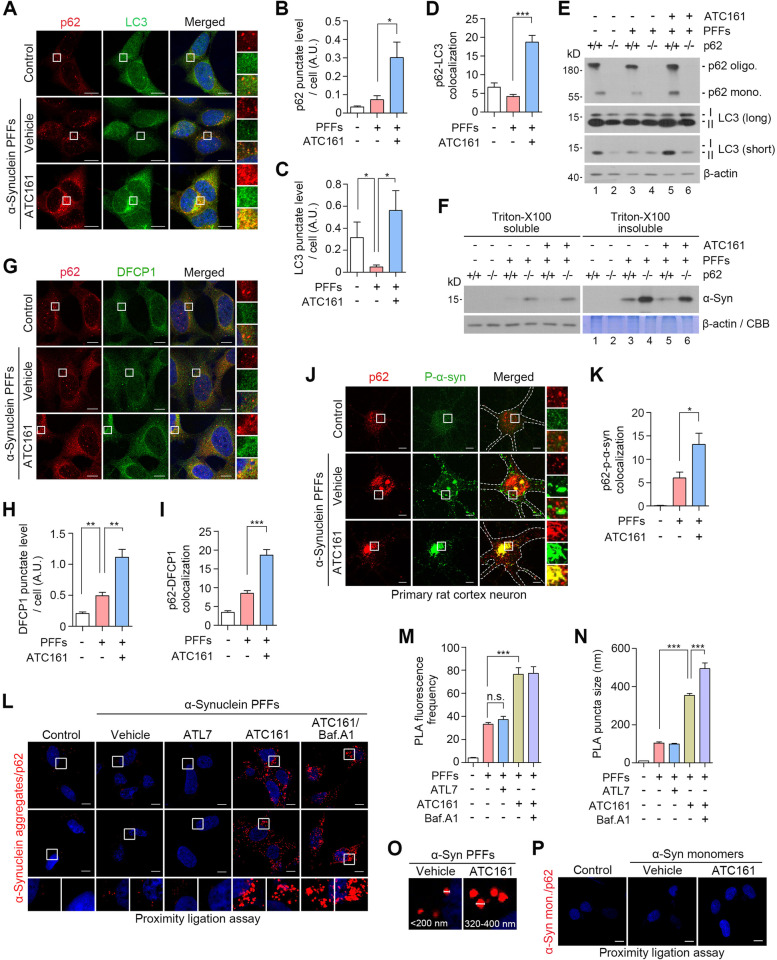
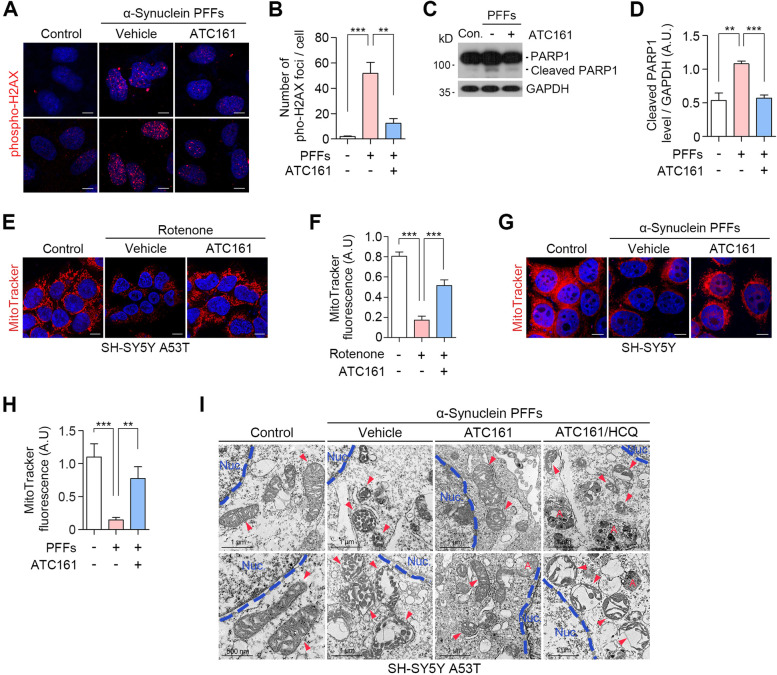
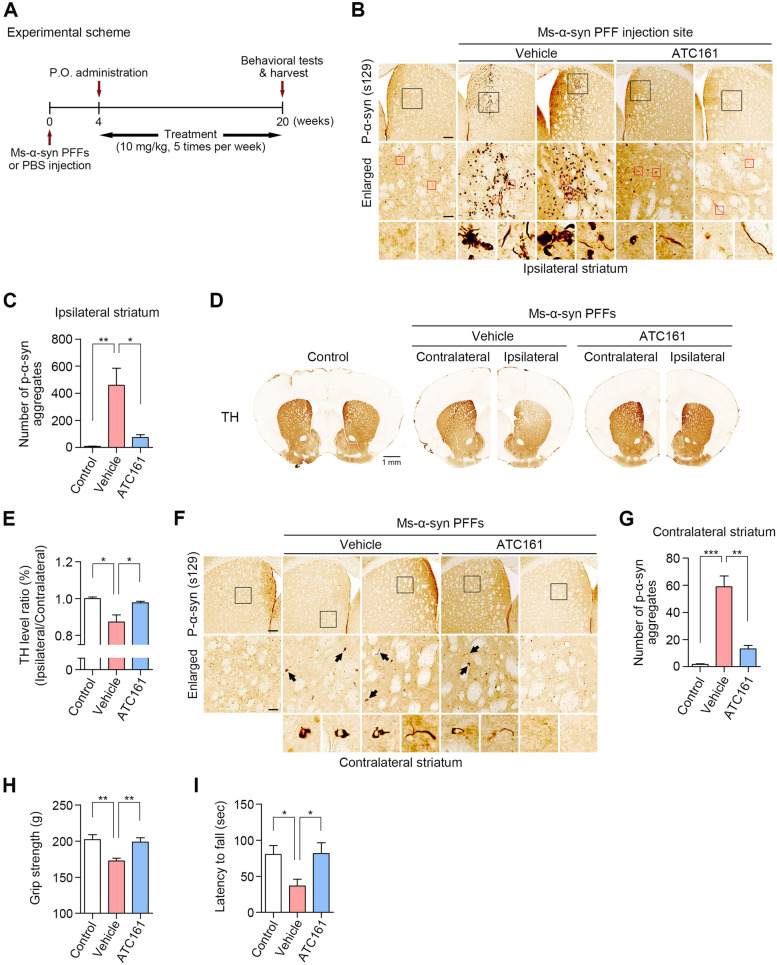
Results: ATC161 induced selective degradation of α-syn aggregates at DC50 of ~ 100 nM. No apparent degradation was observed with monomeric α-syn. ATC161 mediated the targeting of α-syn aggregates to p62 by binding the ZZ domain and accelerating p62 self-polymerization. These p62-cargo complexes were delivered to autophagic membranes for lysosomal degradation. In PD cellular models, ATC161 exhibited therapeutic efficacy to reduce cell-to-cell transmission of α-syn and to rescue cells from the damages in DNA and mitochondria. In PD mice established by injecting α-syn preformed fibrils (PFFs) into brain striata via stereotaxic surgery, oral administration of ATC161 at 10 mg/kg induced the degradation of α-syn aggregates and reduced their propagation. ATC161 also mitigated the associated glial inflammatory response and improved muscle strength and locomotive activity.

Conclusion: AUTOTAC provides a platform to develop drugs for PD. ATC161, an oral drug with excellent PK/PD profiles, induces selective degradation of α-syn aggregates in vitro and in vivo. We suggest that ATC161 is a disease-modifying drug that degrades the pathogenic cause of PD.

Keywords: Lysosome; Macroautophagy; Targeted protein degradation; The N-degron pathway; The autophagy-lysosome system; p62/SQSTM1/Sequestosome-1.


Conflict of interest statement

Seoul National University and AUTOTAC Bio Inc. have filed patent applications based on the results of this study. The remaining authors declare no competing interests.

Figures

Fig. 1
Fig. 1
p62 agonists induce autophagy in PD cellular models. A Western blot in HEK293A cells transduced with either h-α-syn monomers or h-α-syn PFFs (48 h). B Autophagic flux assay in HEK293A cells transduced with h-α-syn PFFs (48 h) upon co-treatment with HCQ (25 μM, 48 h). C Structures of ATL compounds. D Western blot in HeLa cells, subsequent to ATL treatments (1 μM, 24 h). E In vitro p62 aggregation assay in 293 cell lysates. ATLs were treated at final concentration of 1 mM. F and H Western blots in rat cortex primary neurons. ATLs were treated at 1 μM for 24 h. G and I Quantifications of F and H (n = 3, each). Data are presented as the mean (SEM) where relevant. P-values (from two-sided unpaired t tests): n.s. (not significant) P-value > 0.05, * P ≤ 0.05, ** P < 0.01. J Immunocytochemistry in HEK293A cells transduced with h-α-syn PFFs (48 h). The cells were then treated with ATL7 (1 μM, 24 h). K-M Quantifications of G (n = 6–7 for K and L; for M, the numbers of p62+LC3+ puncta were counted per cell in 20 cells per group). Data are presented as the mean (SEM) where relevant. P-values (from two-sided unpaired t tests): *** P < 0.001. N Western blot in HEK293A cells transduced with h-α-syn PFFs (48 h) were treated with ATLs at 1 μM for 24 h. O Immunocytochemistry in HEK293A cells transduced with h-α-syn PFFs (48 h), subsequently treated with ATL7 (1 μM, 24 h) and baf. A1 (200 nM, 6 h). P Western blot of Triton X-100 insoluble fraction in HEK293A cells. The cells were transduced with h-α-syn PFFs (48 h) followed by treatment with ATLs at 1 μM for 24 h. All the scale bars in this figure represent 10 μm
Fig. 2
Fig. 2
The AUTOTAC technology enables the development of target degraders for α-syn aggregates. A Western blot in HeLa cells treated with Autotacs (1 μM, 24 h). B and C quantifications of A (n = 3). Data are presented as the mean (SEM) where relevant. P-values (from two-sided unpaired t tests): * P ≤ 0.05, ** P < 0.01. D Non-reducing SDS-PAGE in the previously modelled COS7 cells. E Quantification of D (n = 3). Data are presented as the mean (SEM) where relevant. P-value (from a two-sided unpaired t test): * P ≤ 0.05. F Western blot in HeLa cells treated with ATC161 in a concentration-dependent manner. G and H Quantifications of F (n = 3). Data are presented as the mean (SEM) where relevant. P-values (from two-sided unpaired t tests): * P ≤ 0.05, ** P < 0.01. I Triton-X100 fractionation assay in SH-SY5Y α-syn A53T cells. J Identical as I but in primary rat cortex neurons. K and L, quantifications of I and J (n = 3, each), respectively. Data are presented as the mean (SEM) where relevant. P-values (from two-sided unpaired t tests): * P ≤ 0.05, ** P < 0.01, *** P < 0.001. M Immunocytochemistry in HEK293A cells transduced with h-α-syn PFFs, followed by treatment with ATC161 (1 μM, 24 h) and co-treatment with Baf. A1 (200 nM, 24 h). Scale bars represent 10 μm. N Quantification of M (n = 3–4). Numbers of α-syn+ inclusions were counted per cell. Data are presented as the mean (SEM) where relevant. P-values (from two-sided unpaired t tests): * P ≤ 0.05, *** P < 0.001. O Immunocytochemistry in SH-SY5Y α-syn A53T cells transduced with h-α-syn PFFs (48 h), followed by treatment with Baf. A1 (200 nM, 6 h) and co-treatment with ATC161 (1 μM, 6 h). Scale bars represent 5 μm. P and Q Quantifications of O (n = 6–7 and n = 7, respectively). For Q, the percentages of α-syn+ inclusions targeted to LAMP1+ puncta were calculated. Data are presented as the mean (SEM) where relevant. P-values (from two-sided unpaired t tests): * P ≤ 0.05, *** P < 0.001
Fig. 3
Fig. 3
ATC161 targets α-syn aggregates to p62-dependent autophagy. A Immunocytochemistry analysis in h-α-syn PFF-transduced HEK293A cells treated with ATC161 (1 μM, 12 h). B-D Quantifications of A (n = 4–5 for B and C; n = 20 cells were counted per group for the number of p62+-LC3+ colocalizing puncta in D). Data are presented as the mean (SEM). P-values (from two-sided unpaired t tests): * P ≤ 0.05, *** P < 0.001. E Western blot in MEF WT and p62 knock-out cell-lines. The cells were transduced with h-α-syn PFFs (48 h) and subsequently administered with ATC161 (1 μM, 12 h). F Western blot in MEF WT and p62 knock-out cell-lines transduced with h-α-syn PFFs (48 h) and treated with ATC161 (1 μM, 24 h). The cell lysates were subjected to Triton x-100 fractionation. G Immunocytochemistry in HEK293A cells transduced with h-α-syn PFF, followed by ATC161 treatment (1 μM, 12 h). H and I Quantifications of G (H, n = 5; I, n = 20 cells counted per group for the number of p62+-DFCP1+ colocalizing puncta). Data are presented as the mean (SEM). P-values (from two-sided unpaired t tests): ** P-value < 0.01, *** P < 0.001. J Immunocytochemistry in rat cortex primary neurons transduced with h-α-syn PFFs, subsequently treated with ATC161 (1 μM, 12 h). K Quantification of J (n = 12 cells counted per group for the number of p62+-p-α-syn+ colocalizing puncta). L Proximity ligation assay (PLA) in HEK293A cells showing interaction between p62 and α-syn aggregates (with an anti-α-syn aggregate antibody). ATL7 (1 μM, 6 h), ATC161 (1 μM, 6 h), and baf. A1 (200 nM, 6 h) were administered subsequent to h-α-syn PFF transduction (48 h). M and N Quantifications from L (n = 5, n = 10, respectively), shown as the mean (SEM). P-values (from two-sided unpaired t tests): n.s. (not significant) P-value > 0.05, *** P-value < 0.001. O PLA image from L showing increase in puncta size by ATC161. P PLA with an anti-α-syn antibody in HEK293A cells upon transduction with recombinant h-α-syn monomers (48 h) and treatment with ATC161 (1 μM, 6 h). All the scale bars in this figure represent 10 μm
Fig. 4
Fig. 4
ATC161 ameliorates genotoxicity and mitotoxicity in α-syn pathology. A Immunocytochemistry in h-α-syn PFF-transduced HEK293A cells. ATC161 was treated at 0.1 μM for 48 h at 24 h transduction of PFFs. B Quantification of A (n = 5), the data are presented as the mean (SEM). P-values (from two-sided unpaired t tests): ** P-value < 0.01, *** P < 0.001. C Western blot in h-α-syn PFF-transduced HEK293A cells (48 h) administered with ATC161 (1 μM, 24 h). D Quantification of C (n = 3). Data are presented as the mean (SEM). P-values (from two-sided unpaired t tests): ** P-value < 0.01, *** P < 0.001. E MitoTracker Red analysis in SH-SY5Y α-syn A53T cells. The cells were subjected to rotenone treatment for 48 h followed by ATC161 treatment (0.1 μM, 24 h). F Quantification of E (n = 7). Data are presented as the mean (SEM) where relevant. P-values (from two-sided unpaired t tests): *** P < 0.001. G, MitoTracker Red analysis in wild-type SH-SY5Y cells. The cells were transduced with h-α-syn PFFs (48 h) and subsequently treated with ATC161 (0.1 μM, 24 h). H, quantification of G (n = 7). Data are presented as the mean (SEM). P-values (from two-sided unpaired t tests): ** P-value < 0.01, *** P < 0.001. I, transmission electron microscopy analysis in SH-SY5Y α-syn A53T cells transduced with h-α-syn PFF for 24 h prior to treatments. ATC161 (0.1 μM, 48 h) and HCQ (25 μM, 48 h) were treated in the presence of h-α-syn PFFs. Red arrows indicating mitochondria. Letter A in red represents autophagosomes. All the scale bars in this figure represent 10 μm otherwise indicated
Fig. 5
Fig. 5
ATC161 is an oral PD drug. A Experimental scheme. 5 μg of ms-α-syn PFFs were unilaterally injected into the striatum via stereotaxic surgery, followed by the oral administration of ATC161 at 10 mg/kg for 16 weeks after 4 weeks of the surgery. B Immunohistochemistry for p-α-syn+ (S129) aggregates in the ms-α-syn PFF-injection site. Scale bars represent 100 μm and 25 μm (for enlarged), respectively. C Quantification of B (n = 3–4 mice per group). Data are presented as the mean (SEM) where relevant. P-values (from two-sided unpaired t tests): * P ≤ 0.05, ** P < 0.01. D TH+ (tyrosine hydroxylase) fiber intensity in the striatum. The scale bar represents 1 mm. E Quantification of D (n = 3–4 mice per group). TH+ signal intensity in the PFF injection site (ipsilateral side) was normalized to that of its contralateral side. Data are presented as the mean (SEM) where relevant. P-values (from two-sided unpaired t tests): * P ≤ 0.05. F Immunohistochemistry for p-α-syn+ (S129) aggregates in the contralateral striatum. Scale bars represent 100 μm and 25 μm (for enlarged), respectively. G Quantification of F (n = 3–4 mice per group). Data are presented as the mean (SEM). P-values (from two-sided unpaired t tests): ** P-value < 0.01, *** P < 0.001. H Grip strength test examining fore- and hindlimb muscle force (n = 4–5). I Rotarod test examining motor coordination and balance (n = 4–5). Data in H and I are presented as the mean (SEM) where relevant. P-values (from two-sided unpaired t tests): * P ≤ 0.05, ** P < 0.01

References

    1. Mhyre TR, Boyd JT, Hamill RW, Maguire-Zeiss KA. Parkinson's disease. Subcell Biochem. 2012;65:389–455. doi: 10.1007/978-94-007-5416-4_16. - DOI - PMC - PubMed
    1. Poewe W, Seppi K, Tanner CM, Halliday GM, Brundin P, Volkmann J, Schrag AE, Lang AE. Parkinson disease. Nat Rev Dis Primers. 2017;3:17013. doi: 10.1038/nrdp.2017.13. - DOI - PubMed
    1. Luk KC, Kehm V, Carroll J, Zhang B, O'Brien P, Trojanowski JQ, Lee VM. Pathological α-synuclein transmission initiates Parkinson-like neurodegeneration in nontransgenic mice. Science. 2012;338(6109):949–953. doi: 10.1126/science.1227157. - DOI - PMC - PubMed
    1. Gómez-Benito M, Granado N, García-Sanz P, Michel A, Dumoulin M, Moratalla R. Modeling Parkinson's Disease With the Alpha-Synuclein Protein. Front Pharmacol. 2020;11:356. doi: 10.3389/fphar.2020.00356. - DOI - PMC - PubMed
    1. Wan OW, Chung KK. The role of alpha-synuclein oligomerization and aggregation in cellular and animal models of Parkinson’s disease. PLoS ONE. 2012;7(6):e38545. doi: 10.1371/journal.pone.0038545. - DOI - PMC - PubMed

Substances