

Published Erratum
doi: 10.1186/s13046-023-02733-x.
Correction: Dehydrodiisoeugenol inhibits colorectal cancer growth by endoplasmic reticulum stress-induced autophagic pathways
Affiliations
- PMID: 37355608
- PMCID: PMC10290395
- DOI: 10.1186/s13046-023-02733-x
Item in Clipboard
Published Erratum
Correction: Dehydrodiisoeugenol inhibits colorectal cancer growth by endoplasmic reticulum stress-induced autophagic pathways
J Exp Clin Cancer Res.
.
No abstract available
Figures
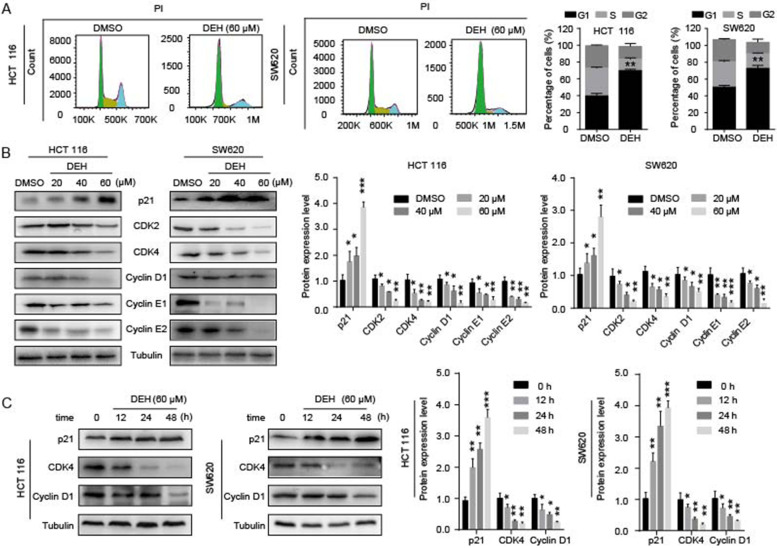
DEH inhibits cell growth by arresting the cell cycle at the G1/S phase. a Cell cycles of HCT 116 and SW620 cells were investigated via flow cytometry after treatment with or without DEH for 48 h. The distribution ratio of G1, S, and G2 of panel A was determined. b Western blotting assays were performed to detect the expression of p21, CDK2, CDK4, Cyclin D1, Cyclin E1, Cyclin E2, and Tubulin in HCT 116 and SW620 cells after treatment with DEH and the densitometry of western blotting bands of panel c. The protein expression levels of p21, CDK4, Cyclin D1, and Tubulin in DEH-treated colorectal cancer cells with time gradient after treatment with 60uM DEH and the densitometry of western blotting bands of panel. All the data were analyzed using the Unpaired Student’s t-test, and p-values less than 0.05 were considered to be statistically significant. *p < 0.05, **p < 0.01, ***p < 0.001
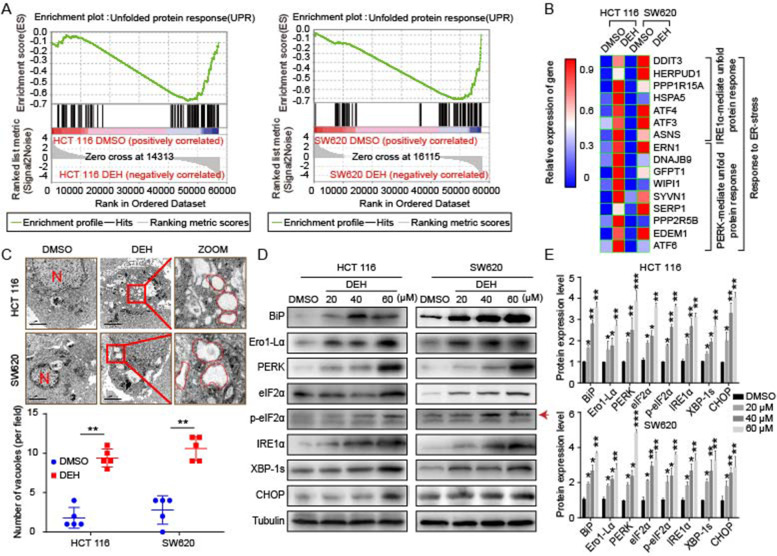
DEH induces ER stress in colorectal cancer cells. a Gene set enrichment analysis of UPR genes between control and DEH-treated cells. b The thermodynamic chart of the mRNA expression level of genes related to ER stress in colorectal cells after incubation with DEH for 48 h. c The subcellular structure of colorectal cancer cells after treatment with or without 60 μM DEH for 48 h were observed by TEM. Scale bar: 2 μm. N: nucleus. The ER is circled in red. d Western blotting assays were performed to detect the expression of BiP, Ero1-Lα, PERK, eIF2α, p-eIF2α, IRE1α, XBP-1 s, CHOP, and Tubulin in HCT 116 and SW620 cells after treatment with or without DEH. The densitometry of western blotting in the right panel. The data were presented as means ± SD. All the data were analyzed by the Unpaired Student’s t-test and p-values less than 0.05 were considered to be statistically significant. *p < 0.05, **p < 0.01, ***p < 0.001
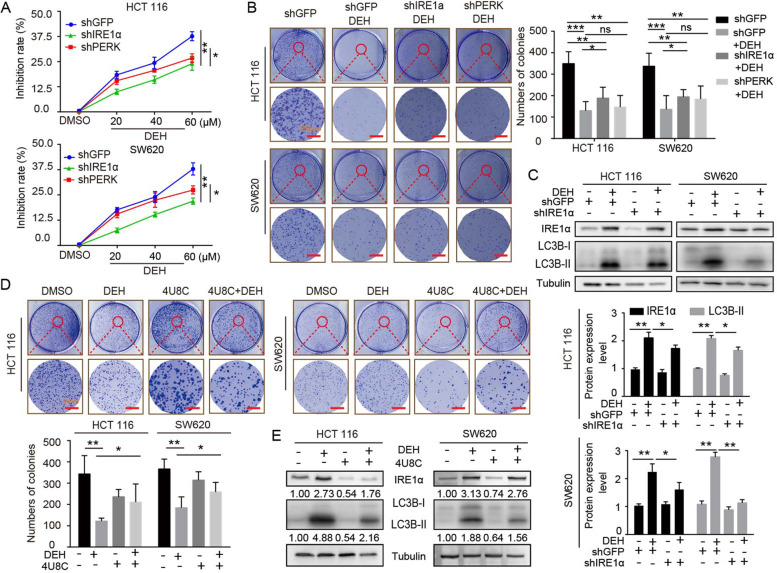
EDH induces autophagy through PERK/eIF2α and IRE1α/XBP-1 s/CHOP pathways in colorectal cancer cells. a The MTT assay was used to evaluate the inhibition rate of colorectal cells, which were transfected with PERK or IRE1α siRNAs, followed by incubation with the indicated concentrations of DEH for another 48 h. b The cell activity was detected by colony formation assay. Cells were transfected with PERK or IRE1α siRNAs, followed by incubation with 60 μM DEH for 10 days. The cells were stained with crystal violet staining solution. Scale bar: 200 nm. The number of clones was quantitated and presented to the right of the panel. c The western blotting assay was used to detect the expression of IRE1α, LC3B, and Tubulin. Tubulin was used as an internal control. d Cellular activity was also detected by colony formation assay. The cells were pretreated with 4U8C, followed by incubation with DEH for 10 days. The cells were stained with crystal violet staining solution. Scale bar: 200 nm. The number of clones were quantified and presented below the panel. e The expression of IRE1α, LC3B- II, and Tubulin was detected after DEH treatment with the inhibitor of IRE1α, 4U8C, or DMSO for 48 h. All the data were analyzed using the Unpaired Student’s t-test, and p-values less than 0.05 were considered to be statistically significant. *p < 0.05, **p < 0.01, ***p < 0.001
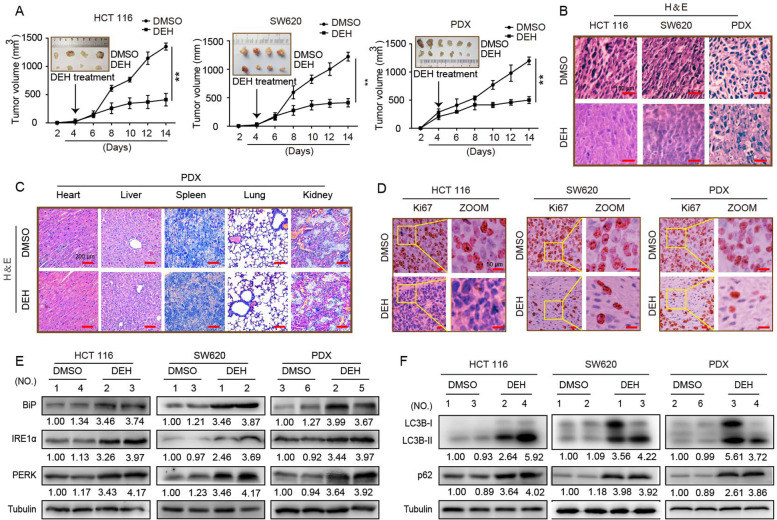
Effects of DEH on the growth of colorectal cancer in vivo. a HCT 116, SW620, and the tumor tissue from colon cancer patient were injected or transplanted into the flanks of NOD/SCID mice. The tumor-bearing mice were treated with DMSO or 40 mg/kg DEH by intraperitoneal injection when tumors were palpable. Tumor volume was measured every 2 days. Two weeks later, the mice were anesthetized and killed, and the tumors were imaged and analyzed. b Hematoxylin and eosin (H&E) staining of the indicated xenograft tumors. Scale bar: 150 μm. c H&E staining of the heart, liver, spleen, lung, and kidney in mice treated with DMSO or 50 mg/kg DEH. Scale bar: 500 μm. d Immunohistochemical (IHC) staining of the indicated xenograft tumors. Scale bar: 50 μm. e The expression of BiP, PERK, and IRE1α of xenograft tumors was detected by western blotting. f The expression of LC3B, p62, and tubulin in xenograft tumors was detected by western blotting. All the data were presented as means ± S.D. and are representative of three independent experiments. P-value < 0.05 was considered to be significant. **P < 0.01; ***P < 0.001
Erratum for
-
Dehydrodiisoeugenol inhibits colorectal cancer growth by endoplasmic reticulum stress-induced autophagic pathways.J Exp Clin Cancer Res. 2021 Apr 10;40(1):125. doi: 10.1186/s13046-021-01915-9. J Exp Clin Cancer Res. 2021. PMID: 33838688 Free PMC article.
Similar articles
-
Dehydrodiisoeugenol inhibits colorectal cancer growth by endoplasmic reticulum stress-induced autophagic pathways.J Exp Clin Cancer Res. 2021 Apr 10;40(1):125. doi: 10.1186/s13046-021-01915-9. J Exp Clin Cancer Res. 2021. PMID: 33838688 Free PMC article.
-
Suppression of DYRK1A/B Drives Endoplasmic Reticulum Stress-mediated Autophagic Cell Death Through Metabolic Reprogramming in Colorectal Cancer Cells.Anticancer Res. 2022 Jan;42(1):589-598. doi: 10.21873/anticanres.15516. Anticancer Res. 2022. PMID: 34969768
-
Sodium Butyrate Induces Endoplasmic Reticulum Stress and Autophagy in Colorectal Cells: Implications for Apoptosis.PLoS One. 2016 Jan 19;11(1):e0147218. doi: 10.1371/journal.pone.0147218. eCollection 2016. PLoS One. 2016. PMID: 26784903 Free PMC article.
-
Endoplasmic reticulum-mediated unfolded protein response and mitochondrial apoptosis in cancer.Biochim Biophys Acta Rev Cancer. 2017 Jan;1867(1):58-66. doi: 10.1016/j.bbcan.2016.12.002. Epub 2016 Dec 15. Biochim Biophys Acta Rev Cancer. 2017. PMID: 27988298 Free PMC article. Review.
-
Endoplasmic Reticulum Stress and Autophagy.Adv Exp Med Biol. 2019;1206:167-177. doi: 10.1007/978-981-15-0602-4_8. Adv Exp Med Biol. 2019. PMID: 31776985 Review.
Cited by
-
The dual effect of endoplasmic reticulum stress in digestive system tumors and intervention of Chinese botanical drug extracts: a review.Front Pharmacol. 2024 Feb 21;15:1339146. doi: 10.3389/fphar.2024.1339146. eCollection 2024. Front Pharmacol. 2024. PMID: 38449811 Free PMC article. Review.
-
Rapid Classification and Quantitative Prediction of Aflatoxin B1 Content and Colony Counts in Nutmeg Based on Electronic Nose.Molecules. 2025 Jun 10;30(12):2538. doi: 10.3390/molecules30122538. Molecules. 2025. PMID: 40572501 Free PMC article.
References
Publication types
LinkOut - more resources
Full Text Sources
