. 2023 Jun 24;14(1):3770.
doi: 10.1038/s41467-023-39420-6.

Schizophrenia-associated NRXN1 deletions induce developmental-timing- and cell-type-specific vulnerabilities in human brain organoids

Affiliations

Schizophrenia-associated NRXN1 deletions induce developmental-timing- and cell-type-specific vulnerabilities in human brain organoids

Rebecca Sebastian et al. Nat Commun. .

Abstract

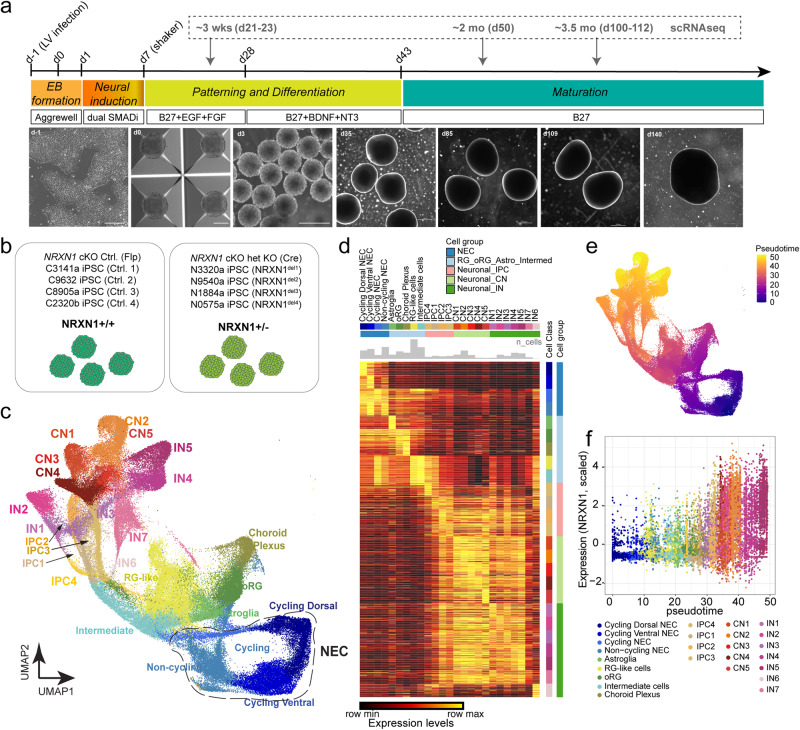
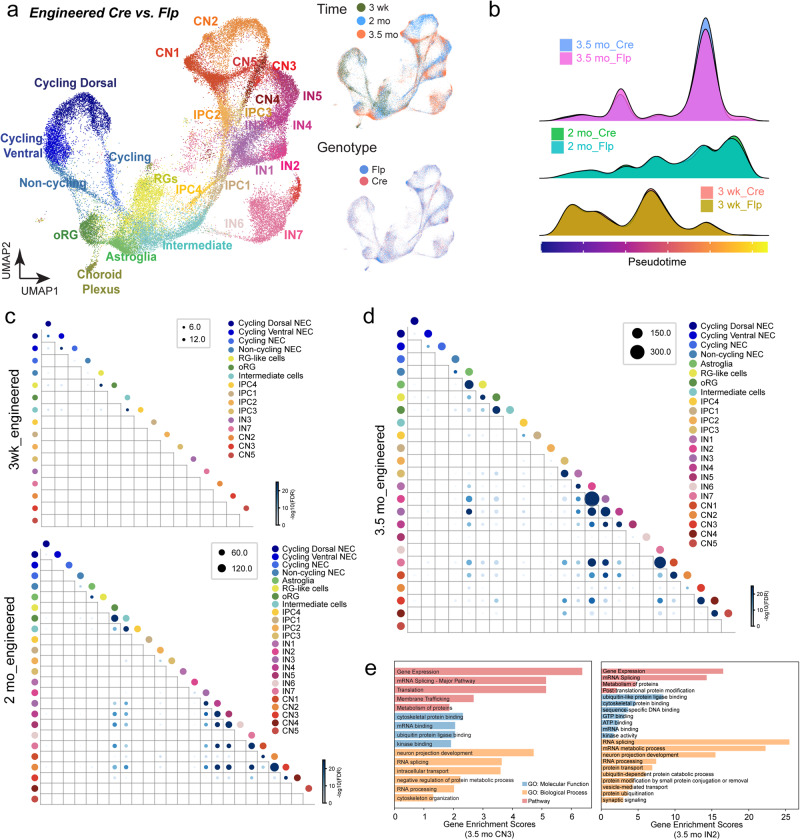
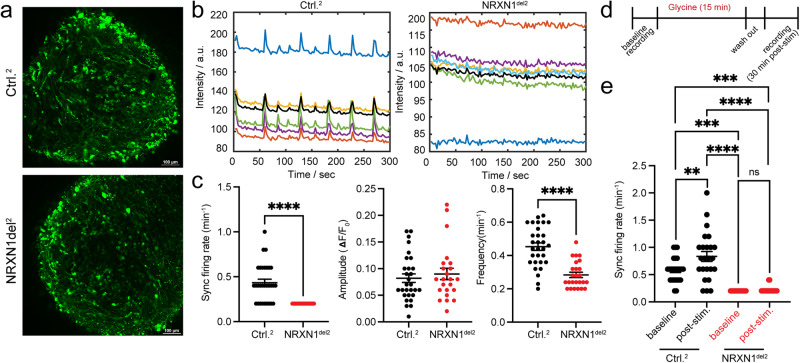
De novo mutations and copy number deletions in NRXN1 (2p16.3) pose a significant risk for schizophrenia (SCZ). It is unclear how NRXN1 deletions impact cortical development in a cell type-specific manner and disease background modulates these phenotypes. Here, we leveraged human pluripotent stem cell-derived forebrain organoid models carrying NRXN1 heterozygous deletions in isogenic and SCZ patient genetic backgrounds and conducted single-cell transcriptomic analysis over the course of brain organoid development from 3 weeks to 3.5 months. Intriguingly, while both deletions similarly impacted molecular pathways associated with ubiquitin-proteasome system, alternative splicing, and synaptic signaling in maturing glutamatergic and GABAergic neurons, SCZ-NRXN1 deletions specifically perturbed developmental trajectories of early neural progenitors and accumulated disease-specific transcriptomic signatures. Using calcium imaging, we found that both deletions led to long-lasting changes in spontaneous and synchronous neuronal networks, implicating synaptic dysfunction. Our study reveals developmental-timing- and cell-type-dependent actions of NRXN1 deletions in unique genetic contexts.


Conflict of interest statement

The authors declare no competing interests.

Figures

Fig. 1
Fig. 1. Generation of forebrain organoids from genetically engineered NRXN1 cKO hESCs and donor derived iPSCs from healthy controls and SCZ patients.
a Schematic of brain organoid generation protocol and the corresponding representative brightfield images over development. Scale bars – 250 μm for d-1, 0, 3; 100 μm for d35+. b Schematic showing genotypes used for scRNAseq and other experiments in the study. c Uniform Manifold Approximation and Projection (UMAP) showing distributions of cell classes of the integrated single-cell data. Abbreviations: NECs neural precursor cells, oRG outer radial glial cells, RG-like radial glial-like cells, IPC intermediate precursor cells, CN cortical excitatory neurons, and IN cortical GABAergic inhibitory neurons. d Heatmap of gene signatures across cell classes and cell groups. Student’s t tests were used to compute differentially expressed genes (DEGs) of each cell class in the integrated scRNA-seq data. Top 50 DEGs for each cell type are shown in a diagonal manner while normalized expression levels are scaled for each row. e UMAP showing distribution of pseudotime values of integrated single-cell data inferred by Monocle3. f NRXN1 mRNA expression (Seurat scaled expression values) across pseudotime in control donor-derived brain organoids. A higher pseudotime value indicates greater maturity as indicated by the number of various neuronal cell classes.
Fig. 2
Fig. 2. Perturbation effects of NRXN1 engineered deletions across development.
a UMAPs showing distributions of cell classes (left), time points (top right), and genotypes (bottom right) of NRXN1 cKO engineered brain organoids. A total of 10 samples were processed for deletion (Cre) control (Flp) – n = 1 for 3 weeks (3 wk) Cre and Flp; n = 2 for 2 months (2 mo Cre and Flp; n = 2 for 3.5 months (3.5 mo) Cre and Flp. b Ridge plots showing the density of cell abundance across the dimension of pseudotime for 3 wk, 2 mo, and 3.5 mo engineered brain organoids. c, d Dot plots showing significant differential gene expression in deletion vs. control across time points and cell types. The size and color of each dot show the number and significance of overlapping DEGs for each comparison of two cell classes. The significance was measured by log10(FDRadjustedpvalues) of hypergeometric tests (see Methods). e Representative enriched gene sets were shown for GSEA results of DEGs of multiple cell classes using ToppGene. Different categories of Gene Ontology are shown in different colors (blue: molecular function, orange: biological process, and red: pathway). Enrichment scores were defined as log10(FDRadjustedpvalues) to represent the associations between DEG sets and Gene Ontology gene sets.
Fig. 3
Fig. 3. Perturbation effects of SCZ associated NRXN1 deletions across development.
a UMAPs showing distributions of cell classes (left), time points (top right), and genotypes (bottom right) of SCZ-NRXN1del donor derived brain organoids. A total of 16 samples were processed – 2 SCZ-NRXN1del donors and 2 Ctrl donors for 3 weeks (3 wk); 2 SCZ-NRXN1del donors and 2 Ctrl donors for 2 months (2 mo); 4 SCZ-NRXN1del donors and 4 Ctrl donors for 3.5 months (3.5 mo). b Ridge plots showing the density of cell abundance across the dimension of pseudotime for 3 wk, 2 mo, and 3.5 mo engineered brain organoids. c, d Dot plots showing significant differential gene expression in deletion vs. control across time points and cell types. The size and color of each dot show the number and significance of overlapping DEGs for each comparison of two cell classes. The significance was measured by log10(FDRadjustedpvalues) of hypergeometric tests (see Methods). e Representative enriched gene sets were shown for GSEA results of DEGs of multiple cell classes using ToppGene. Different categories of Gene Ontology are shown in different colors (blue: molecular function, orange: biological process, and red: pathway). Enrichment scores were defined as log10(FDRadjustedpvalues) to represent the associations between DEG sets and Gene Ontology gene sets.
Fig. 4
Fig. 4. Dysregulated alternative splicing in NRXN1 mutant glutamatergic human neurons.
a Differential gene expression (adjusted p values < 0.05) of neuronal splicing regulators in SCZ-NRXN1del1 compared to Ctrl.1 iN cells (n = 3 replicates). Log2 fold changes are plotted on the y-axis with example DEGs on the x-axis. Blue bars represent downregulation and red bars represent upregulation. b Venn diagram representing differential isoform abundance derived from RSEM analysis across iN cells from engineered NRXN1 deletions (n = 3 replicates from NRXN1 cKO iPSC) and donor-derived SCZ-NRXN1 deletions (3 healthy controls and 3 SCZ-NRXN1 deletion carriers; n = 3 replicates per line, 18 replicates total). Number of differentially expressed isoforms (184 for engineered iNs and 213 donor derived iNs) mapped to 160 and 148 unique gene IDs respectively. Among the unique genes, example SYNGO-mapped genes are highlighted. c, d Percentage of isoform ratio change (differential transcript usage, see methods) for NRXN1 and CHD4 in NRXN1 deletions from engineered (eng.; yellow) and donor (green) backgrounds. Error bars represent +/−S.E.M. e Detection and visualization of local differential splicing using Majiq and ggSashimi. Change in percent spliced in index (dPSI) is calculated for differential exon usage in the NRXN1 gene (exons 19–21) in the SCZ-NRXN1 deletion vs. NRXN1 cKO engineered deletion iNs. Number of detected reads is plotted on the y-axis with location of genomic coordinates on the x-axis.
Fig. 5
Fig. 5. Impaired neuronal network activities in brain organoids carrying NRXN1 deletion.
a Representative fluorescent images of intact donor derived organoids (Ctrl.2 and NRXN1del2) expressing soma-GCaMP6f2 at ~120 days prior to live Ca2+ imaging. b Colored raw intensity traces are shown in the boxed graphs with averaged intensities plotted in bolded black. c Averaged data for synchronous firing rates (number of detected synchronous spikes/minute) representative of network activity, as well as amplitudes (dF/F0) and frequencies (total number of detected peaks/minute) of spontaneous spike activity, are shown in scatter plots. Each data point represents averaged data from a single field of view (FOV) consisting of 4-5 ROIs per FOV. At least 4–6 FOVs were taken from each organoid and 5 organoids per genotype were used for experiments. N = 29–30 for Ctrl; N = 23–25 for NRXN1del2. d Experimental flow of live Ca2+ imaging with glycine stimulation. e Synchronous firing rate is plotted in genotypes with or without stimulation. Each data point represents averaged data from a single field of view (FOV) consisting of 4–5 ROIs per FOV. At least 4–6 FOVs were taken from each organoid and 5 organoids per genotype were used for experiments. N = 24–25 for Ctrl; N = 16–19 for NRXN1del2. Error bars represent +/− S.E.M. Statistical significance is represented by asterisks: *p < 0.05, **p < 0.01, ***p < 0.001, and ****p < 0.0001. Student’s t test (two-sided) was performed for data shown for c and one-way ANOVA with multiple comparisons (Tukey’s test) was used for data shown on e. Source data and statistics are provided as a Source Data file.
Fig. 6
Fig. 6. Differential enrichment of disease-associated transcriptomic signatures.
a Heatmap showing results from a subset of gene enrichment analyses of DEGs performed on cells of both brain organoid types (engineered and donor derived brain organoids) across all time points using neurological disorder dysregulated gene sets in several categories (ASD autism spectrum disorders, BP bipolar disorder, MDD mood disorder, SCZ schizophrenia) (columns). Data shown here are from 3.5 mo time point only. Body Mass Index (BMI) was used as control (−). Gene Set Enrichment Analysis (GSEA) was employed using the package GSEAPY, and significance scores were defined as log10(FDRadjustedpvalues) to represent the associations between DEG sets and neurological disorders. Scores were trimmed to 0~10 (see Methods). Significance levels were represented by numbers of asterisks (*: adjusted p values < 0.05; **: adjusted p values < 0.01; ***: adjusted p values < 0.001). b Significance of differential expression of prioritized genes obtained from PGC wave 3 and SCHMEA consortium,. The size of each dot represents the level of DE significance of each gene in each cell class of 3.5 mo donor brain organoids (left; n = 4 for Ctrls and n = 4 for SCZ-NRXN1dels) and 3.5 mo engineered brain organoids (right; n = 2 for Flp and n = 2 for Cre). Two-sided Wilcoxon rank-sum tests were employed for the DE tests, with FDR-adjusted p-values utilized.

References

    1. Lowther C, et al. Molecular characterization of NRXN1 deletions from 19,263 clinical microarray cases identifies exons important for neurodevelopmental disease expression. Genet Med. 2017;19:53–61. doi: 10.1038/gim.2016.54. - DOI - PMC - PubMed
    1. Castronovo P, et al. Phenotypic spectrum of NRXN1 mono- and bi-allelic deficiency: a systematic review. Clin. Genet. 2020;97:125–137. doi: 10.1111/cge.13537. - DOI - PubMed
    1. Marshall CR, et al. Contribution of copy number variants to schizophrenia from a genome-wide study of 41,321 subjects. Nat. Genet. 2017;49:27–35. doi: 10.1038/ng.3725. - DOI - PMC - PubMed
    1. Fuccillo MV, Pak C. Copy number variants in neurexin genes: phenotypes and mechanisms. Curr. Opin. Genet. Dev. 2021;68:64–70. doi: 10.1016/j.gde.2021.02.010. - DOI - PMC - PubMed
    1. Sudhof TC. Synaptic neurexin complexes: a molecular code for the logic of neural circuits. Cell. 2017;171:745–769. doi: 10.1016/j.cell.2017.10.024. - DOI - PMC - PubMed

Publication types

Substances