. 2023 Jul 25;42(7):112682.
doi: 10.1016/j.celrep.2023.112682. Epub 2023 Jun 24.

Understanding heterogeneity of human bone marrow plasma cell maturation and survival pathways by single-cell analyses

Affiliations

Understanding heterogeneity of human bone marrow plasma cell maturation and survival pathways by single-cell analyses

Meixue Duan et al. Cell Rep. .

Abstract

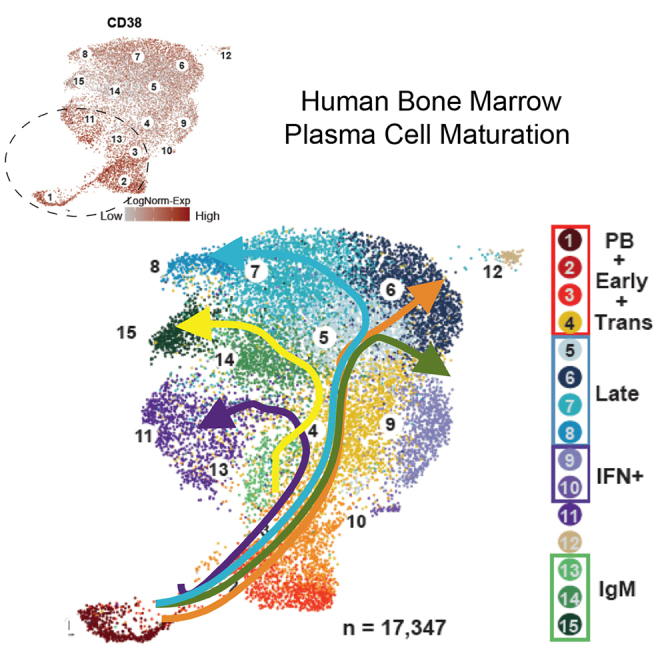
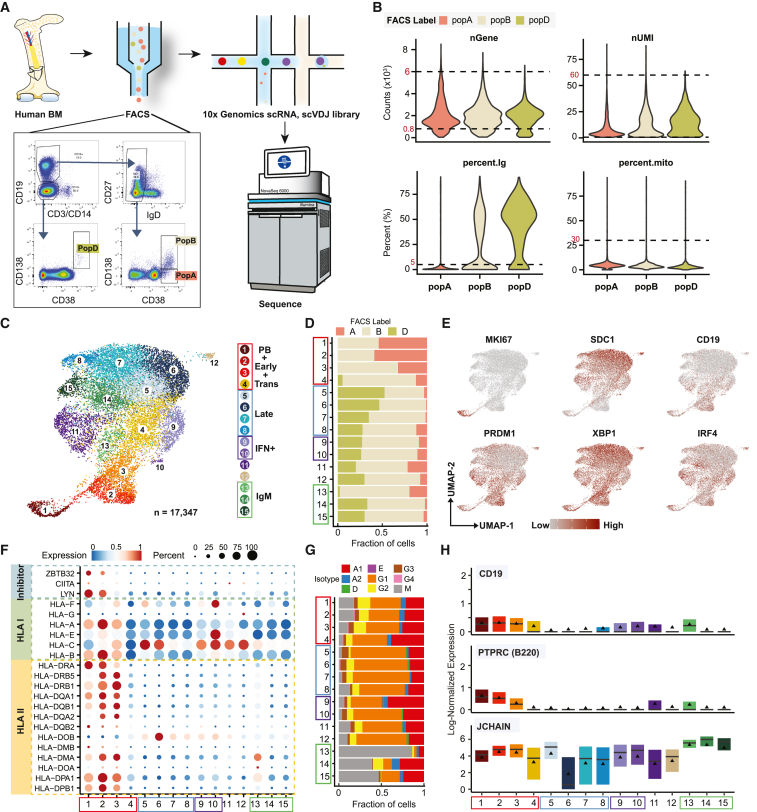
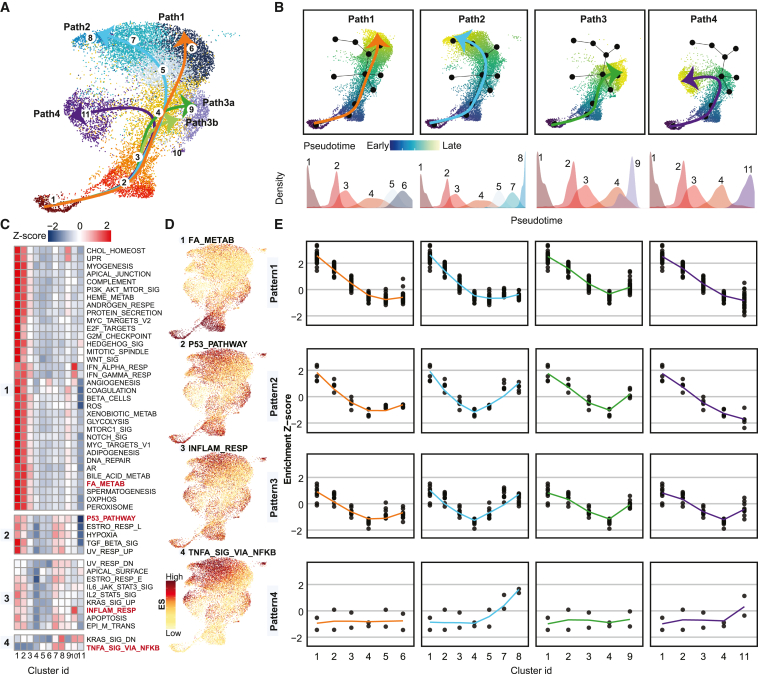
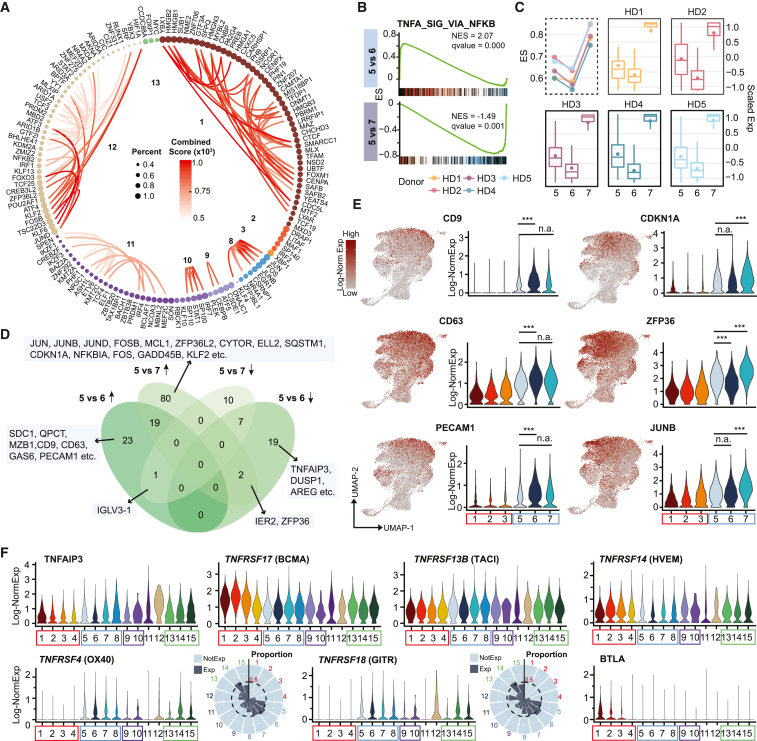
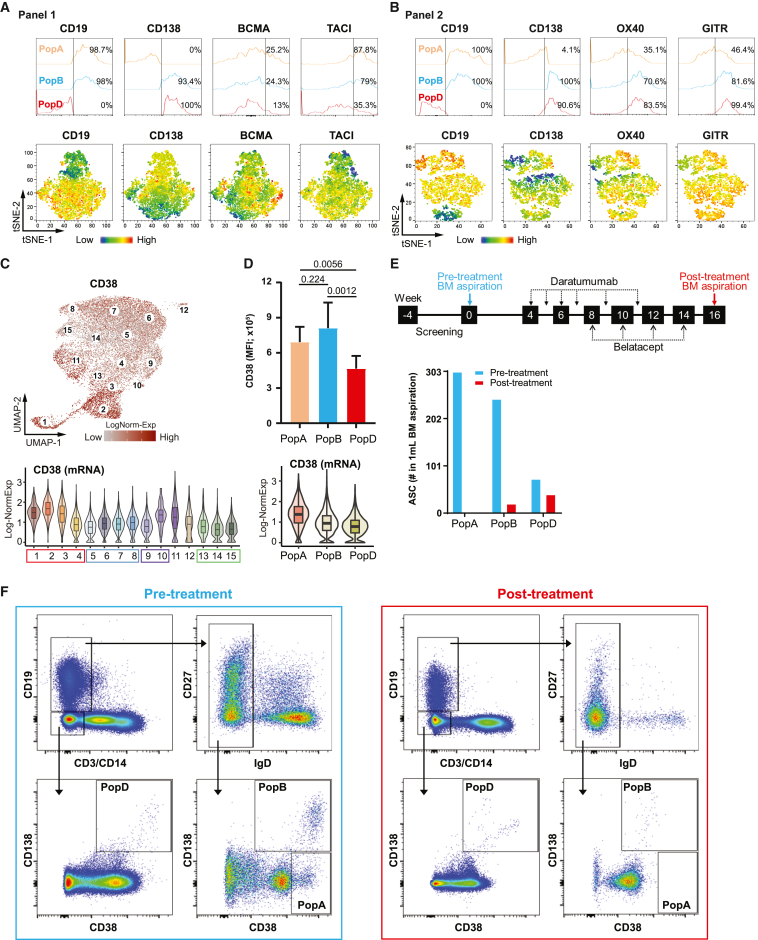
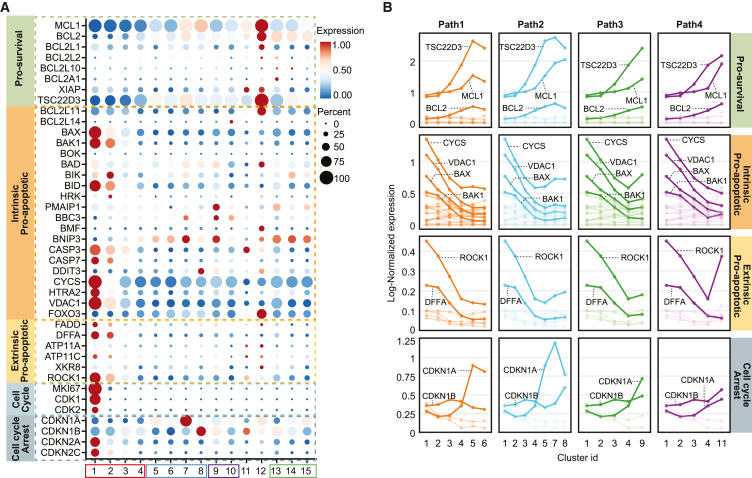
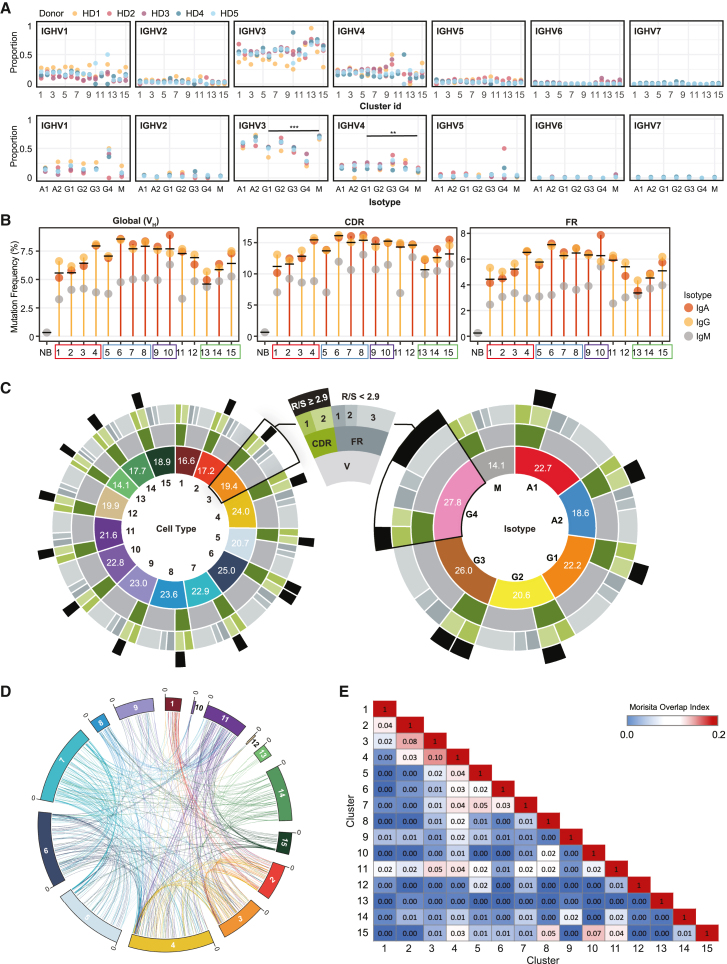
Human bone marrow (BM) plasma cells are heterogeneous, ranging from newly arrived antibody-secreting cells (ASCs) to long-lived plasma cells (LLPCs). We provide single-cell transcriptional resolution of 17,347 BM ASCs from five healthy adults. Fifteen clusters are identified ranging from newly minted ASCs (cluster 1) expressing MKI67 and high major histocompatibility complex (MHC) class II that progress to late clusters 5-8 through intermediate clusters 2-4. Additional ASC clusters include the following: immunoglobulin (Ig) M predominant (likely of extra-follicular origin), interferon responsive, and high mitochondrial activity. Late ASCs are distinguished by G2M checkpoints, mammalian target of rapamycin (mTOR) signaling, distinct metabolic pathways, CD38 expression, utilization of tumor necrosis factor (TNF)-receptor superfamily members, and two distinct maturation pathways involving TNF signaling through nuclear factor κB (NF-κB). This study provides a single-cell atlas and molecular roadmap of LLPC maturation trajectories essential in the BM microniche. Altogether, understanding BM ASC heterogeneity in health and disease enables development of new strategies to enhance protective ASCs and to deplete pathogenic ones.

Keywords: CP: Immunology; TNF signaling through NFKB; heterogeneity and maturation; human bone marrow; long-lived plasma cell; single-cell sequencing.


Conflict of interest statement

Declaration of interests F.E.L. is the founder of Micro-Bplex, Inc., serves on the scientific board of Be Biopharma, and is a recipient of grants from the BMGF and Genentech, Inc. I.S. has consulted for GSK, Pfizer, Kayverna, Johnson & Johnson, Celgene, Bristol Myer Squibb, and Visterra. F.E.L, D.C.N., and I.S. are inventors of the issued patents: 9/21/21 US 11,124766 B2 PCT/US2016/036650 and 9/21/21 US 11, 125757 B2 for the PC survival media.

Figures

None
Graphical abstract
Figure 1
Figure 1
Single-cell transcriptomic profiling of bone marrow PCs (A) Schematic of single-cell RNA profiling for human BMPCs. (B) Criterion for removing bad-quality cells. Dashed lines show the cutoffs that are labeled in red. (C) scRNA-seq cell clusters of combined data from five healthy BMs and visualized in UMAP colored by cell types. Red and blue boxes highlight the early and late stage of BMPC maturation, respectively. The purple box highlights the path toward IFN-response PC subgroups and the green box highlights IgM-dominant cell populations. (D) The fraction of cells from fluorescence-activated cell sorting (FACS)-sorted cell population in each cell subgroup identified in (C). (E) Key PC-associated master gene expression. The redder the dot, the higher the log-normalized gene expression. (F) Dot plot for expression of human MHC class I, II, and inhibitors of class II genes. Colors represent minimum-maximum normalized mean expression of marker genes in each cell group, and sizes indicate the proportion of cells expressing marker genes. (G) The fraction of isotypes identified by scVDJ-seq data in each cell subgroup identified in (C). (H) Boxplots showing the expression levels of the indicated genes. The solid triangle represents the average value.
Figure 2
Figure 2
Trajectory and hallmark pathway enrichment analysis to distinguish predicted BMPC maturation paths (A) UMAP plot shows predicted paths of IgG1-dominant BMPC maturation. Arrows indicate the maturation direction. (B) UMAP plots show cell cluster located in each maturation path and colored by predicted pseudotime. (Top) Each solid black dot represents a cell population used to predict path in (A). The darker the blue and the lighter the green, the earlier and later stages of maturation, respectively. (Bottom) The density plots show the distribution of scRNA-seq-identified cluster on pseudotime space of each path. (C) Heatmap shows the row-scaled enrichment scores (ESs) for hallmark pathway enrichment analysis in the IgG1-dominant cell populations; from left to right is c1–c11. (D) Projected ES of indicated pathway example from each pattern onto UMAP. The darker the red, the higher the enrichment. (E) Dot plot next to the example UMAP visualization in (D) shows the scaled ES from each pattern by cluster from each path. The x axis is ordered cell populations corresponding to the cell order in each path in (B). Loess method fitted lines of ES alteration trends were colored by predicted paths in (B).
Figure 3
Figure 3
Genes and hallmark pathways distinguish late-phase maturation fate (A) Cell-cluster-associated TFs; each node represents a TF, colored by associated cell cluster and scaled by the expressed percentage of cells in the cluster. The lines between nodes are inferred protein-protein interactions from the STRING database. The redder the line, the more confident the inferred interactions. Numbers in the circles show the assigned cell cluster ID. (B) GSEA of the most indicated pathways. TNFα signaling via NF-κB that are differentially enriched between 5 vs. 6 and 5 vs. 7. (C) TNFα signaling via NF-κB hallmark pathway ES separated for each of the five individual subjects (in dashed box and y axis is on the left) and the distribution of scaled corresponding pathway enriched maturation-associated DEG expression in c5, c6, and c7 (in solid boxes and y axis is on the right). (D) Comparison of top DEGs between c5 vs. c6 and c5 vs. c7 (see star methods), based on the sign of average log fold-change (avglogFC), the DEGs were divided into up-/downregulated in c6 or c7 groups. Venn diagram shows the results of the DEG comparison. (E) Gene expression examples from the results of the comparisons in (D). (F) Gene expression of genes from TNF family. The x axis is cell cluster ID and y axis is the log-normalized gene expression. Circular bar plot shows the proportion of cells in each cell subgroup showing expression of corresponding genes. Black dashed line indicates the proportion of 0.5 and numbers indicate the cell cluster IDs. NotExp, not expressed; Exp, expressed. ∗∗∗Bonferroni-adjusted p value <0.001; n.a., not available.
Figure 4
Figure 4
Experimental validation of early- and late-phase representative markers (A and B) Histograms (upper) and tSNE heat-maps (bottom) of expression of ASC surface markers (A) CD19, CD138, BCMA, and TACI (panel 1), or (B) CD19, CD138, OX40, and GITR (panel 2). (C) CD38 log-normalized gene expression visualized by UMAP (top) and violin plot grouped by cluster ID (bottom). (D) CD38 MFI measured from n = 9 healthy BM aspirates (top) and log-normalized gene expression visualized violin plot grouped by FACS-sorted cell labels (bottom). (E) Study regimen and timeline of the donor-specific antibodies (DSAs) (ClinicalTrials.gov identifier: NCT04827979, top). Quantitation of BM ASC subsets (# ASC/mL BM) pre and post treatment with daratumumab and belatacept (bottom). (F) Flow cytometry pre and post treatment.
Figure 5
Figure 5
Exploration of apoptotic gene expressions in BMPC clusters (A) Dot plot showing the expression of genes related to pro-survival, intrinsic pro-apoptotic, extrinsic pro-apoptotic, cell-cycle progression, and cell-cycle arrest functions in BMPC subgroups. (B) Dynamic gene expression alterations in four maturation paths defined in Figure 2B with the same color coding and ordering. The labeled thick solid lines show the genes with high expressions and variations during the BMPC maturation.
Figure 6
Figure 6
Mutation rate, similarity, and connectivity of clones measured by scVDJ-seq (A) Summary of Ig heavy-chain family gene usage. The y axis shows the proportion of cells from each cluster (top) and Ig isotype and IgG subclass (bottom). Black bar shows the comparison objects and asterisks indicate the significance of statistical test (∗∗∗p < 0.001, ∗∗p < 0.01). (B) The average mutation frequency in the whole region V (global), CDR, and FR of IgA, IgG, and IgM isotypes from each cell population. The solid black bar in each cell cluster indicates the overall average mutation frequency. NB, naive B cell as control. (C) Summary of the average mutation numbers by scRNA-seq-identified cell populations (left) and scVDJ-seq-identified isotypes (right). The innermost circle shows the cluster or isotype. Numbers in each section show the average number of mutations in region V. The second circle shows CDR and FR of region V. The third circle further breaks CDR and FR into CDR1, CDR2, FR1, FR2, and FR3. The outer-most circle black bar indicates the replacement-to-silence (R/S) ratio greater than 2.9. (D) Compiled Circos plot connecting individual subjects’ clones from cell c1 to c15. Lineages were colored by the latest cell cluster. (E) Heatmap showing the average Morisita overlap index of five subjects, with 0 indicating no similarity and 1 indicating identical repertoires.

Update of

Similar articles

Cited by

References

    1. Medina F., Segundo C., Campos-Caro A., González-García I., Brieva J.A. The heterogeneity shown by human plasma cells from tonsil, blood, and bone marrow reveals graded stages of increasing maturity, but local profiles of adhesion molecule expression. Blood. 2002;99:2154–2161. - PubMed
    1. González-García I., Ocaña E., Jiménez-Gómez G., Campos-Caro A., Brieva J.A. Immunization-induced perturbation of human blood plasma cell pool: progressive maturation, IL-6 responsiveness, and high PRDI-BF1/BLIMP1 expression are critical distinctions between antigen-specific and nonspecific plasma cells. J. Immunol. 2006;176:4042–4050. - PubMed
    1. Halliley J., Tipton C., Liesveld J., Rosenberg A., Darce J., Gregoretti I., Popova L., Kaminiski D., Fucile C., Albizua I., et al. Long-lived plasma cells are contained within the CD19(-)CD38(hi)CD138(+) subset in human bone marrow. Immunity. 2015;43:132–145. - PMC - PubMed
    1. Garimalla S., Nguyen D.C., Halliley J.L., Tipton C., Rosenberg A.F., Fucile C.F., Saney C.L., Kyu S., Kaminski D., Qian Y., et al. Differential transcriptome and development of human peripheral plasma cell subsets. JCI Insight. 2019;4 - PMC - PubMed
    1. Nguyen D.C., Duan M., Ali M., Ley A., Sanz I., Lee F.E.H. Plasma cell survival: the intrinsic drivers, migratory signals, and extrinsic regulators. Immunol. Rev. 2021;303:138–153. - PMC - PubMed

Publication types

Substances