. 2023 Oct:153:108491.
doi: 10.1016/j.bioelechem.2023.108491. Epub 2023 Jun 20.

Copy number of naked DNA delivered into nucleus of mammalian cells by electrotransfection

Affiliations

Copy number of naked DNA delivered into nucleus of mammalian cells by electrotransfection

Yifei Wang et al. Bioelectrochemistry. 2023 Oct.

Abstract

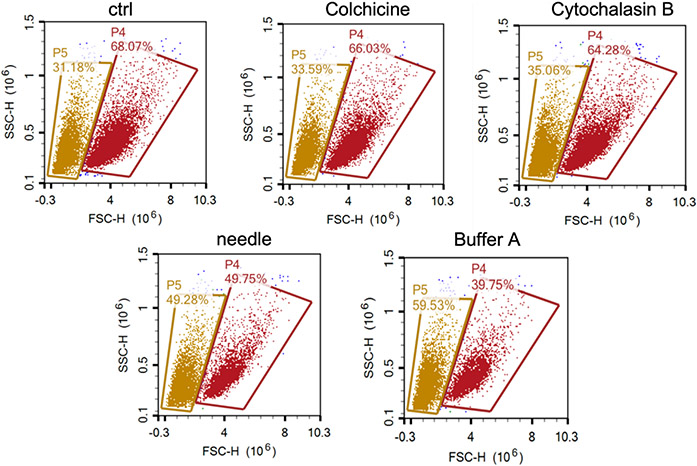
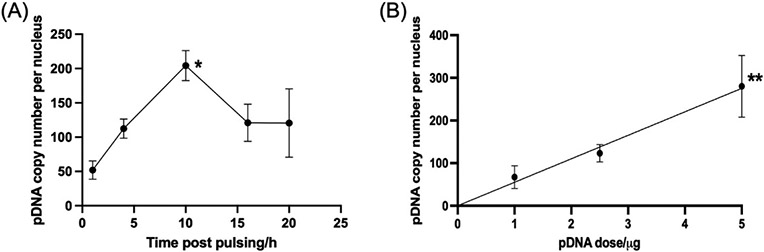
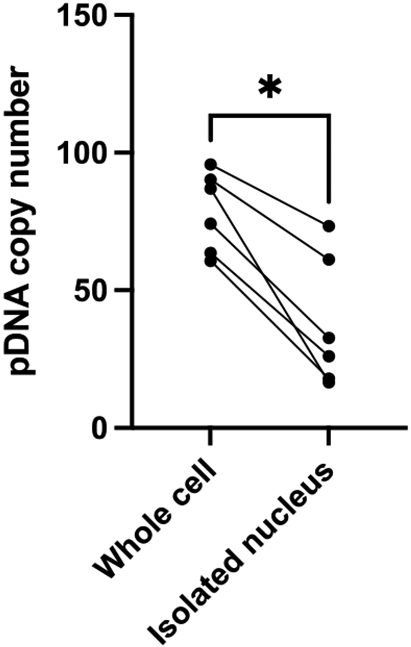
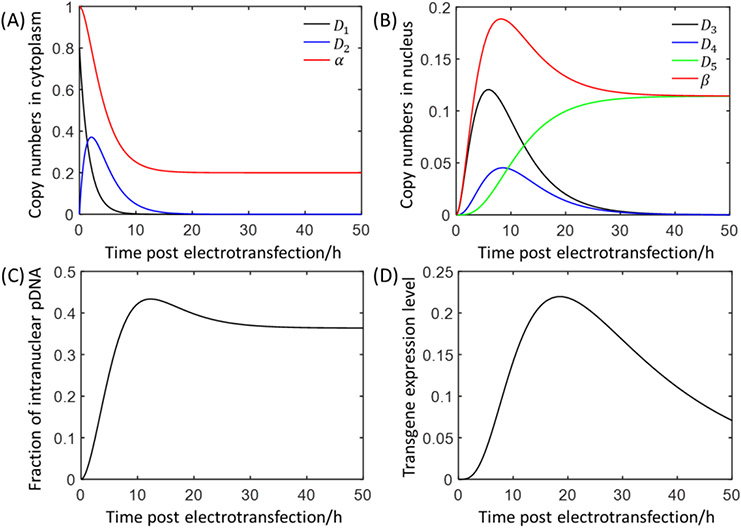
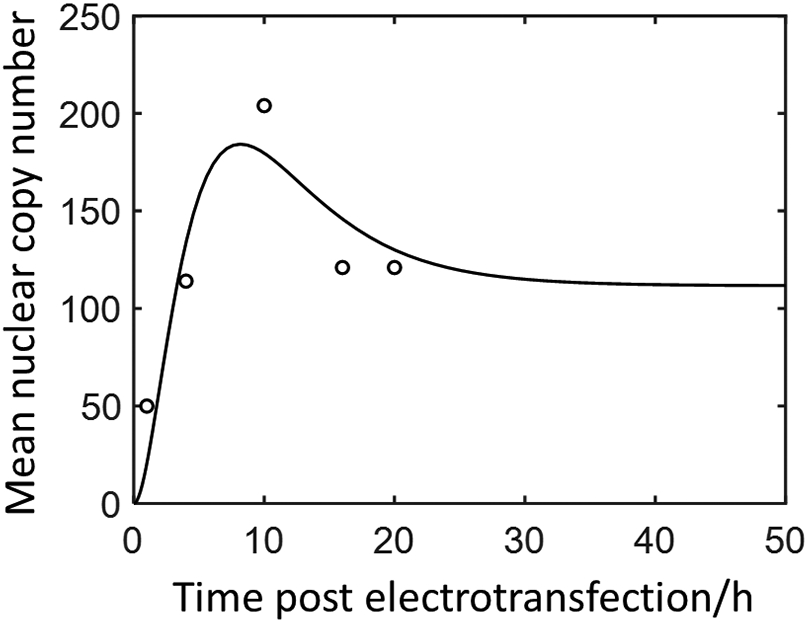
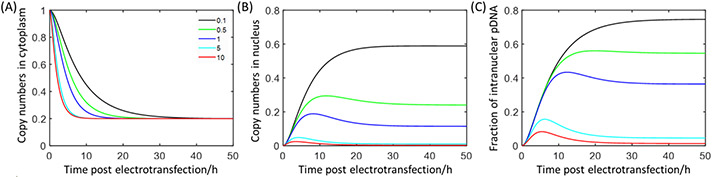
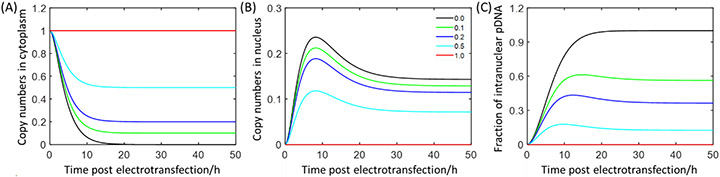
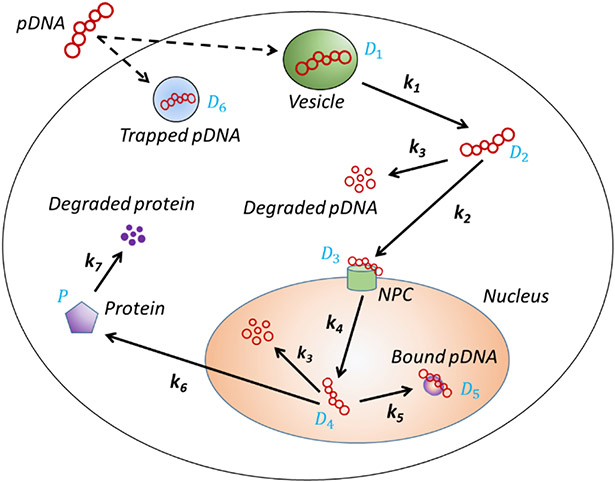
Electrotransfection is a non-viral method for delivery of nucleic acids into cells. In our previous study, we have determined the minimal copy number of plasmid DNA (pDNA) per cell required for transgene expression post electrotransfection, and developed a statistical framework to predict the pDNA copy number in the nucleus. To experimentally verify the prediction, the current study was designed to quantify the average copy number of pDNA per nucleus post electrotransfection. To achieve it, we developed a novel approach to effectively obtain isolated nuclei with minimal contamination by extranuclear pDNA. This sample preparation method enabled us to accurately measure intranuclear pDNA using quantitative real-time PCR. The data showed that the copy number of pDNA per nucleus was dependent on the period of cell culture post pulsing and the pDNA dose for electrotransfection. Additionally, the data were used to improve the statistical framework for understanding kinetics of pDNA transport in cells, and predicting how the kinetics depended on different factors. It is expected that the framework and the methodology developed in the current study will be useful for evaluating factors that may affect kinetics and mechanisms of pDNA transport in cells.

Keywords: Copy number of DNA; Electroporation; Electrotransfection; Mathematical modeling; Non-viral gene delivery; Nucleus isolation.


Conflict of interest statement

Declaration of Competing Interest The authors declare that they have no known competing financial interests or personal relationships that could have appeared to influence the work reported in this paper.

Figures

Figure 1.
Figure 1.
Representative flow cytometry results of nucleus isolation. In the control group (ctrl), no treatment was performed. In other groups, the samples were treated with colchicine (5 μM, 30 min, 37°C), cytochalasin B (10 μM, 30 min, 37°C), passed through a 27G needle 10 times (room temperature), and incubated in the Buffer A (20 min, room temperature), respectively. At the end of each treatment, the samples were analyzed with flow cytometry. The panels show completely and incompletely isolated nuclei as yellow and red dots, respectively, as well as the percentage of each population. FSC-H: forward scatter height, SSC-H: side scatter height. 106 in axes labels means values of FSC and SSC to be in the million range.
Figure 2.
Figure 2.
Time- and dose-dependence of average pDNA copy numbers per nucleus. (A) Time-dependence. The dose of pDNA was fixed at 5 μg per million cells. The symbols are connected with line segments. (B) Dose-dependence. The isolated nuclei were collected at 10 hours post pulsing. Line: linear fitting. In both plots, symbol: mean; error bar: SD; n = 5; *P<0.05, 10 h versus other time points; **P<0.01, 5 μg versus other doses; Mann-Whitney test.
Figure 3.
Figure 3.
Quantitative analysis of average pDNA copy number per cell versus per nucleus. The dose of pDNA was 1 μg per million cells. At 10 hour post electrotransfection, the cell sample in Group 1 was frozen at −20°C, and the nuclei in Group 2 were isolated. Then, pDNA was extracted from both samples at approximately the same time. The individual data are shown in the plot; and their mean ± SD are 38 ± 22 and 79 ± 19 for isolated nucleus and whole cell groups, respectively. The mean ± SD of their ratios is 0.46 ± 0.20. Symbols: experimental data; lines: connection of paired data; n = 6; *P<0.05, Wilcoxon test.
Figure 4.
Figure 4.
Baseline profiles of numerically simulated pDNA copy numbers normalized by Mc in subcellular compartments and transgene expression. (A) Copy numbers of pDNA in the cytoplasmic compartments (D1 and D2), and the total copy number in the cytoplasm (α). (B) Copy numbers of pDNA in the nuclear compartments (D3, D4, and D5), and the total copy number in the nucleus (β). (C) Fraction of intracellular pDNA in the nucleus (γ). (D) Transgene expression profile (P).
Figure 5.
Figure 5.
Comparison of model prediction (E[MN]) with experimental data of mean copy number per nucleus. The solid curve is the model prediction, and the symbols are the experimental data shown in Fig.2A.
Figure 6.
Figure 6.
Sensitivity of pDNA copy numbers to pDNA degradation rate constant (k3). The value of k3 was varied by a factor that ranges from 0.1 to 10. The copy numbers were normalized by Mc. The variation altered (A) the copy number of pDNA in the cytoplasm (α), (B) the copy number of pDNA in the nucleus (β), and (C) Fraction of intracellular pDNA in the nucleus (γ). The curve keys are the same in all subfigures.
Figure 7.
Figure 7.
Sensitivity of normalized pDNA copy numbers to percent of DNA trapped in vesicles. The percent value (fD) varies from 0 to 1.0. The variation alters A) the relative copy number of pDNA in the cytoplasm, (B) the relative copy number of pDNA in the nucleus, and (C) Fraction of intracellular pDNA in the nucleus (γ). The curve keys are the same in all subfigures.
Scheme 1.
Scheme 1.
Illustration of kinetic model for intracellular pDNA transport. After endocytosis, pDNA can be trapped in intracellular vesicles, escape from the vesicles, diffuse and bind to nuclear pore complex (NPC), enter nucleus, and bind to intranuclear structures. The model also considers transgene expression to generate protein, and degradation of pDNA and protein.

Similar articles

Cited by

References

    1. Cervia LD, Chang CC, Wang L, Yuan F, Distinct effects of endosomal escape and inhibition of endosomal trafficking on gene delivery via electrotransfection, PLoS One, 12 (2017) e0171699, 10.1371/journal.pone.0171699. - DOI - PMC - PubMed
    1. Mao M, Chang CC, Pickar-Oliver A, Cervia LD, Wang L, Ji J, Liton PB, Gersbach CA, Yuan F, Redirecting vesicular transport to improve nonviral delivery of molecular cargo, Adv Biosyst, 4 (2020) e2000059, 10.1002/adbi.202000059. - DOI - PMC - PubMed
    1. Sardesai NY, Weiner DB, Electroporation delivery of DNA vaccines: prospects for success, Curr Opin Immunol, 23 (2011) 421–429, 10.1016/j.coi.2011.03.008. - DOI - PMC - PubMed
    1. Wang L, Chang CC, Sylvers J, Yuan F, A statistical framework for determination of minimal plasmid copy number required for transgene expression in mammalian cells, Bioelectrochemistry, 138 (2021) 107731, 10.1016/j.bioelechem.2020.107731. - DOI - PMC - PubMed
    1. Young JL, Dean DA, Electroporation-mediated gene delivery, Adv Genet, 89 (2015) 49–88, 10.1016/bs.adgen.2014.10.003. - DOI - PMC - PubMed

LinkOut - more resources