. 2023 Aug 1:568:216284.
doi: 10.1016/j.canlet.2023.216284. Epub 2023 Jun 24.

Drug combinations identified by high-throughput screening promote cell cycle transition and upregulate Smad pathways in myeloma

Affiliations

Drug combinations identified by high-throughput screening promote cell cycle transition and upregulate Smad pathways in myeloma

Tyler J Peat et al. Cancer Lett. .

Abstract

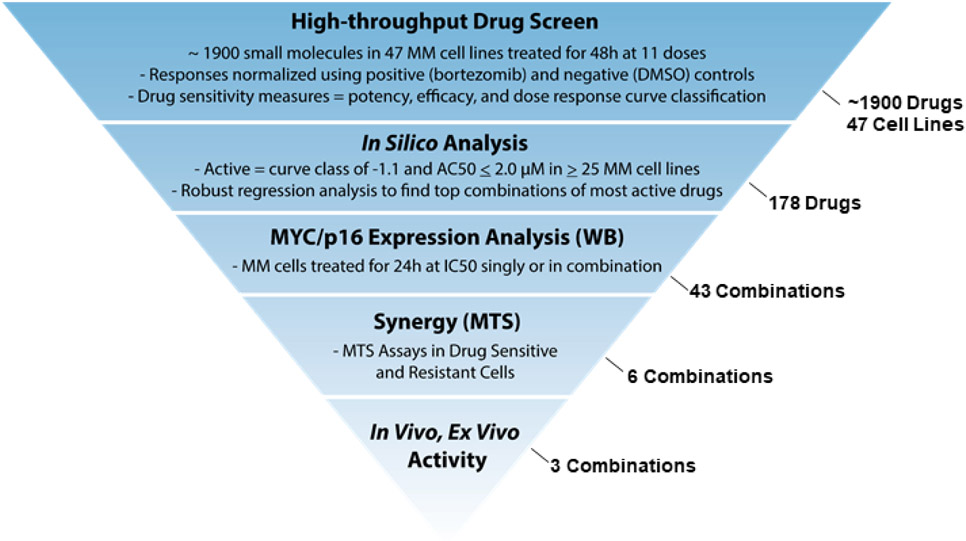
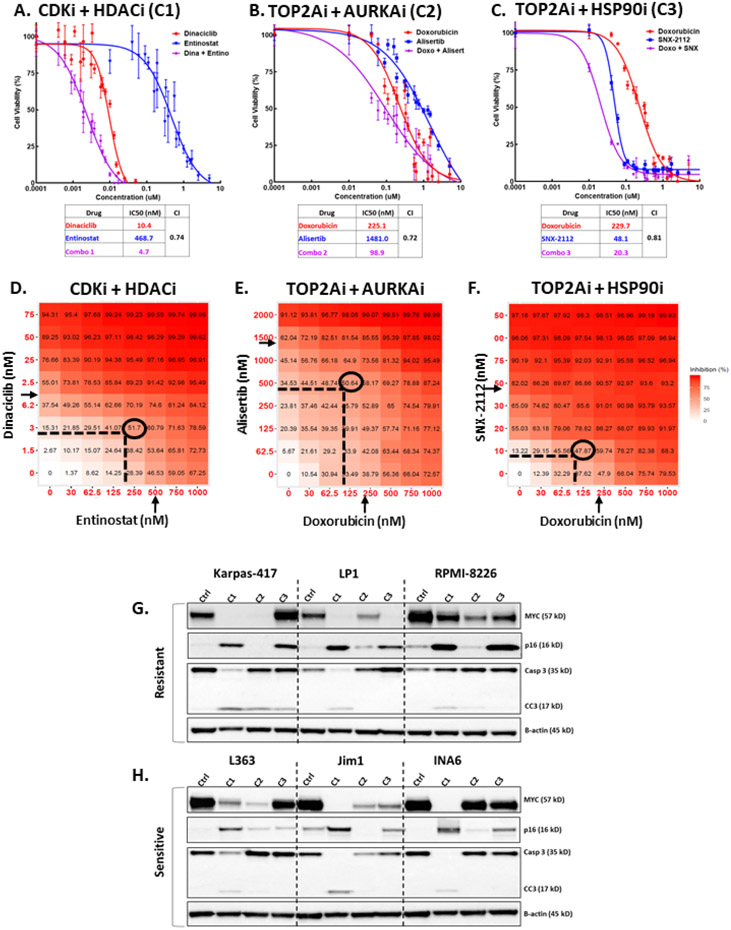
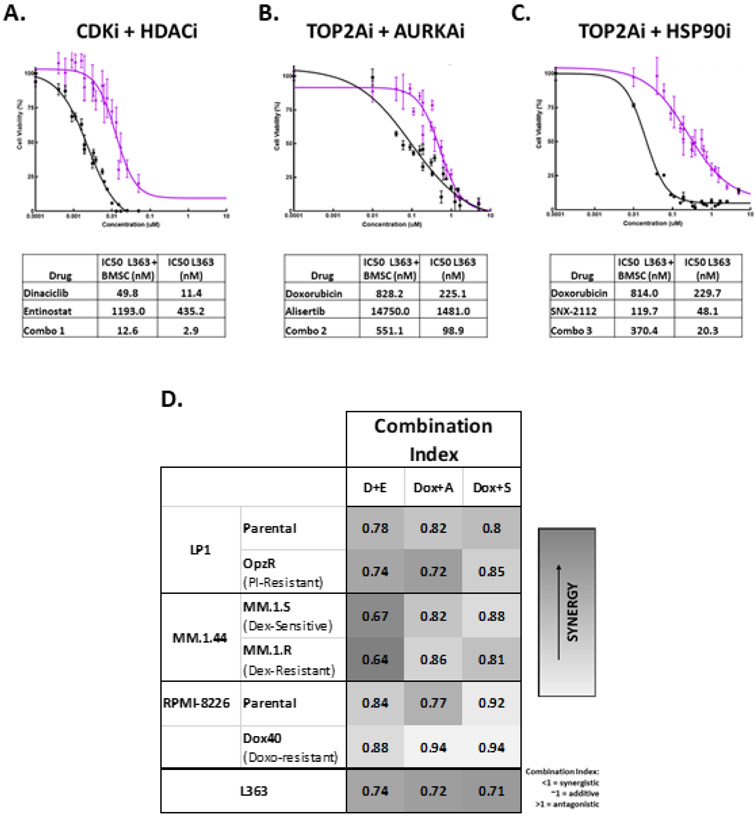
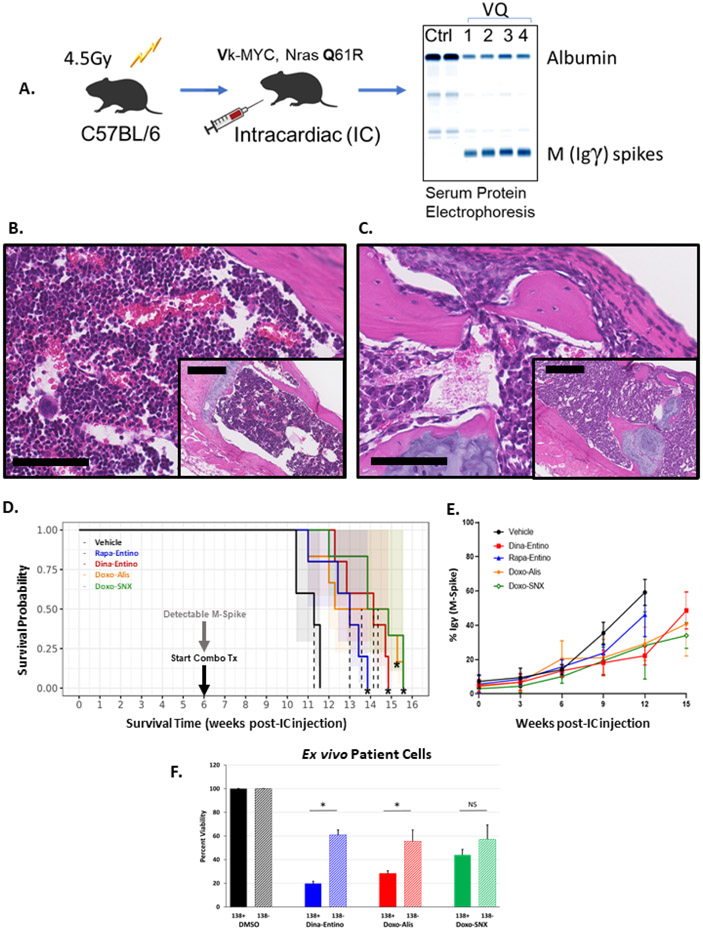
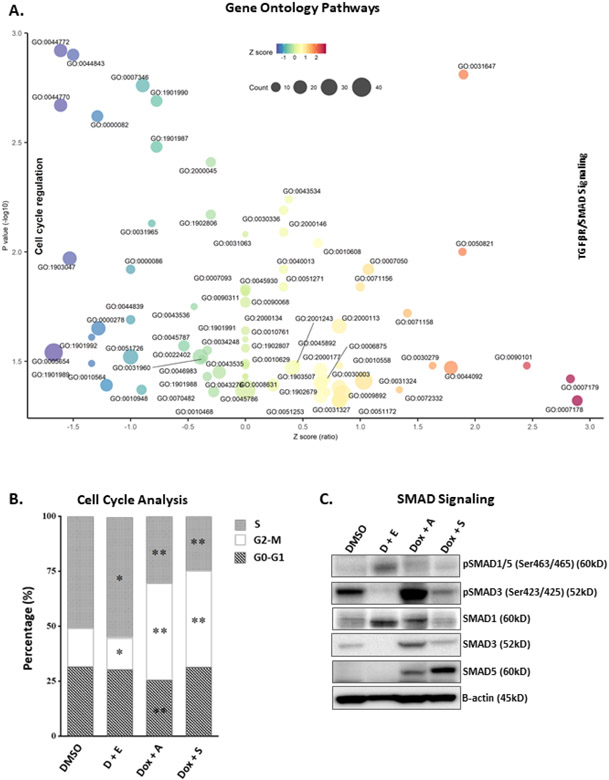
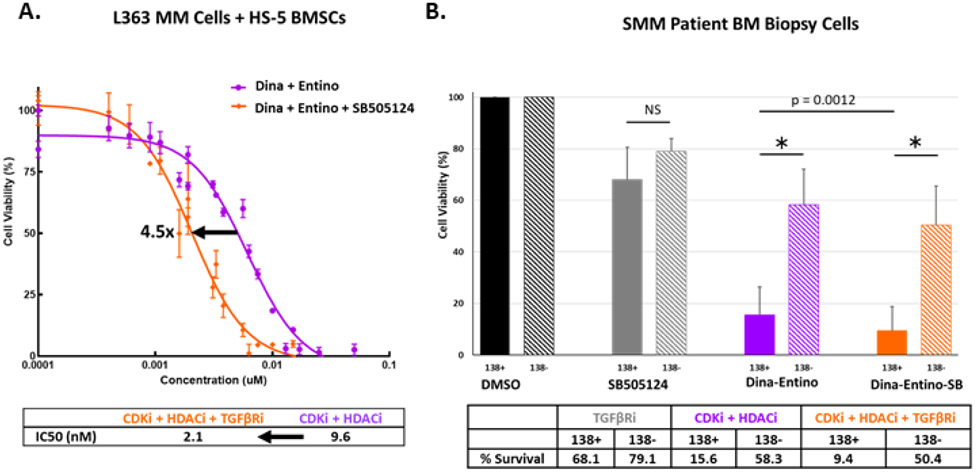
Drug resistance and disease progression are common in multiple myeloma (MM) patients, underscoring the need for new therapeutic combinations. A high-throughput drug screen in 47 MM cell lines and in silico Huber robust regression analysis of drug responses revealed 43 potentially synergistic combinations. We hypothesized that effective combinations would reduce MYC expression and enhance p16 activity. Six combinations cooperatively reduced MYC protein, frequently over-expressed in MM and also cooperatively increased p16 expression, frequently downregulated in MM. Synergistic reductions in viability were observed with top combinations in proteasome inhibitor-resistant and sensitive MM cell lines, while sparing fibroblasts. Three combinations significantly prolonged survival in a transplantable Ras-driven allograft model of advanced MM closely recapitulating high-risk/refractory myeloma in humans and reduced viability of ex vivo treated patient cells. Common genetic pathways similarly downregulated by these combinations promoted cell cycle transition, whereas pathways most upregulated were involved in TGFβ/SMAD signaling. These preclinical data identify potentially useful drug combinations for evaluation in drug-resistant MM and reveal potential mechanisms of combined drug sensitivity.

Keywords: Dinaciclib; Entinostat; MYC; Myeloma; p16.


Conflict of interest statement

Declaration of competing interest The authors declare that they have no known competing financial interests or personal relationships that could have appeared to influence the work reported in this paper.

Figures

Figure 1.
Figure 1.
Prediction workflow used to find top drug combinations inhibiting MM cell growth. IC50 = half maximal inhibitory concentration, WB = western blot, MTS = tetrazolium-based cell proliferation assay. Numbers indicated on the right denote the numbers of drugs, combinations, or cell lines investigated in each phase of the prediction workflow.
Figure 2.
Figure 2.
High-throughput drug screen reveals combinations that synergistically reduce viability of MM cells and cooperatively target MYC and p16. A-C) Dose-response curves for top 3 drug combinations in L363 MM cells. Cell viability was assessed with MTS assay 48h after treatment with escalated dose concentrations of either drug individually or in combination at a 1:1 molar ratio. Each data point represents mean of 4 wells and error bars indicate replicate standard deviation. Each table lists IC50 (in nM) values for individual drugs and combinations. Chou-Talalay computation of combination indices (CI) for treated cells are shown for 50% affected fraction 48 hours post-exposure. Synergy is interpreted as CI<1.0. D-F) Graphical depiction of dose-matrix analyses for the top drug combinations in L363 MM cells. Percent inhibition of cell growth is shown for each different combination of doses and colorized in red. Cells were treated for 48 hours with different concentrations of each drug (indicated by X- and Y-axes) singly or in combination. Arrows indicate individual drug IC50 (half-maximal inhibitory concentration) as determined by MTS dose-response assay, ovals surround optimal dose for combinations, as determined by synergy scoring. G-H) Representative WB analysis of MM cell lines resistant or sensitive to all 1920 drugs used in the screen (see Table 3). Three resistant and three sensitive cell lines were treated for 24 hours with the top 3 drug combinations at the IC50 concentration (the concentration at half-maximal activity; equal to IC50) for each line (C1 = dinaciclib (CDKi) + entinostat (HDACi), C2 = Doxorubicin (TOP2Ai) + Alisertib (AURKAi), C3 = Doxorubicin + SNX-2112 (HSP90i). Lysates of treated cells were probed for MYC, p16, total and cleaved caspase 3 (Casp3 and CC3, respectively), and β-actin.
Figure 3.
Figure 3.
Evaluation of synergy in top drug combinations. A-C) Dose-response curves, along with tables listing IC50 in nM, for L363 MM cells in monoculture and L363 MM cells cocultured with HS-5 bone marrow derived stromal cells (BMSC) treated for 48 hours with increasing concentrations of the top 3 drug combinations (A = CDKi/HDACi, B = TOP2Ai/AURKAi, C = TOP2Ai/HSP90i). Black curves represent percent viability following combination treatment, relative to DMSO-treated control, in L363 cells cultured alone, purple curves show combination dose responses for L363 cocultured with human HS-5 BMSC. D) Heat-map depicting Chou-Talalay combination index scores for the following parental MM cell lines and their drug-resistant counterparts: LP1-Parental and LP1-OpzR (resistance induced via prolonged incubation with the proteasome inhibitor (PI) oprozomib (Opz)), Dexamethasone (Dex)-sensitive MM.1.S and Dex-resistant MM.1.R cells, RPMI-8226-Parental and RPMI-8226-Dox40 (treatment-induced resistance to the topoisomerase inhibitor doxorubicin), all compared to CI scores of L363. D+E = dinaciclib (CDKi) + entinostat (HDACi), Dox + A = doxorubicin (TOP2Ai) + alisertib (AURKAi), Dox + S = doxorubicin + SNX-2112 (HSHP90i). Darker gray = more synergy.
Figure 4.
Figure 4.
Evaluating the top drug combinations in a novel allograft mouse model of MM and human myeloma cells ex vivo. A) Illustration of VQ inoculation scheme. 6–8-week-old C57BL/6J mice were sublethally irradiated then injected intracardiac with 5x10^6 Vk*MYC; NrasLSL Q61R/+; IgG1-Cre (VQ) cells harvested from bone marrow of donor mice. After 6-8 weeks, serum M-spikes, as evidenced by the γ immunoglobulin band on serum protein electrophoresis, are evident. Once M-spikes were detected in mice, treatment with the top drug combinations commenced. B-C) Photomicrographs (bar =100 μm; inset bar = 250 μm; H&E stain) of C57BL/6J mouse sternum 12 weeks post-IC injection with either saline (B, normal bone marrow) or VQ cells (C, marrow replaced by neoplastic plasma cells). D) Survival plots of C57BL/6J mice injected with 5x10^6 VQ cell IC, treated with the top drug combinations vs a previously investigated combination of rapamycin (mTORi) and entinostat (HDACi), all compared to DMSO-treated control mice. CDKi (dinaciclib, 20 mg/kg, IP, 3x/week + HDACi (entinostat, 20 mg/kg, PO 5x/week; TOP2Ai, (doxorubicin,4 mg/kg IV 1x/week) + AURKAi (alisertib, 30 mg/kg PO 5x/week); or HSP90i (SNX-2112, 20 mg/kg, PO, 3x/week), n= 5. * indicates significantly prolonged survival vs. DMSO-treated control mice (p < 0.01, Log-Rank test). E) Graphical representation of mean M-spike percentage for each treatment group of mice administered one of the top drug combinations, combined mTORi-HDACi, or DMSO control. Each data point represents mean M-spike percentage of all mice for a given time point, error bars indicate standard deviation amongst group mice. F) Viability of human CD138 positive (MM) and CD138 negative cells extracted from bone marrow of smoldering multiple myeloma patients (n=3). Cells were selected for CD138 status using magnetic-activated cell sorting (MACS). CD138 positive and negative cells were treated with the top 3 combinations of dinaciclib (10 nM) and entinostat (500 nM), doxorubicin (225 nM) and alisertib (2 μM), or doxorubicin (225 nM) and SNX-2112 (50 nM) for 48 hours. Solid bars indicate average viability for each combination in CD138 positive cells, hash-marked bars indicate the average viability for CD138 negative cells. Error bars = standard deviation. * =p <0.001; NS = no significance p > 0.05 by unpaired two-tailed Student’s t test.
Figure 5.
Figure 5.
Pathways most commonly affected by the top 3 combinations. A) Bubble plot visualization of top pathways commonly affected by the top 3 combinations (CDKi/HDACi, TOP2Ai/AURKAi, and TOP2Ai/HSP90i) using single agent IC50 concentrations of each drug. Purified RNA from each sample was analyzed using the NanoString nCounter® system. Raw counts were normalized to mRNA of five housekeeping genes (ZNF384, MRPS5, CNOT4, NUBP1, and SF3A3). Statistical significance was based on a false discovery rate of 5%. The concordant response signature includes genes significantly changed in the same direction by each combination treatment (Total=125, 49 up-regulated and 76 down-regulated genes), and that reached 2-fold change in the average fold-change profile calculated across all the combination treatments (Total=78, 38 up-regulated and 40 down-regulated genes). Fisher’s exact test was used to determine overrepresented Gene Ontology (GO) functions in the concordant response signature of 78 genes. Enriched GO terms were selected with nominal p-values less than 0.05. For each overrepresented GO term a z-score was computed based on the number of up-regulated and down-regulated genes according to the formula (up-down)/sqrt(total) proposed by Walter et al. The pathways most downregulated by all combinations include those involved in cell cycle regulation. All top combinations also commonly increased TGFβ and SMAD3 signaling pathways. B) Cell cycle distribution of PI/RNase-stained L363 cells treated for 24 hours with DMSO or IC50 concentrations of the top three combinations. D + E = dinaciclib + entinostat; Dox + A = doxorubicin + alisertib; Dox + S = doxorubicin + SNX-2112. * = p<0.05, ** = p<0.001 (unpaired Student’s t test). C) Representative WB analysis of SMAD signaling effector molecules in L363 MM cells treated for 48 hours with the top 3 drug combinations at the IC50 concentrations. Lysates of treated cells were probed for pSMAD1/5 (Ser463/465), pSMAD3 (Ser423/425), SMAD1, SMAD3, SMAD5, and β-actin.
Figure 6.
Figure 6.
Co-targeting the TGFβ pathway with combination therapy. A) Dose-response curves for L363 MM cells, co-cultured with HS-5 BMSCs for 48 hours with escalated doses of either combined CDKi/HDACi of dinaciclib and entinostat (purple curve) or combined CDKi/HDACi + TGFβRi (orange curve; dinaciclib + entinostat + SB505124) at a 1:1 or 1:1:1 molar ratio (in nM), respectively. Arrow = IC50 shift. B) Viability of human CD138 positive (MM) and CD138 negative cells extracted from bone marrow of SMM patients (n=3). Cells were selected for CD138 status using MACS. CD138 positive and negative cells were treated with the SB505124 (TGFβRi – 5 uM), dinaciclib (CDKi – 10 nM) and entinostat (HDACi – 500 nM), or CDKi + HDACi + TGFβRi for 48 hours. Solid bars indicate the average viability of CD138 positive cells and hash-marked bars represent the average viability for CD138 negative cells. Error bars = standard deviation. * = p <0.001; NS = no significance p > 0.05 by unpaired two-tailed Student’s t test. p = 0.0012 indicates p-value for significance in comparison of CD138 positive cells treated with CDKi + HDACi versus CDKi + HDACi + TGFβRi.

References

    1. Goldschmidt H, Ashcroft J, Szabo Z, Garderet L. Navigating the treatment landscape in multiple myeloma: which combinations to use and when? Ann Hematol. 2018. Nov;23(1)1–18. - PMC - PubMed
    1. Kumar SK, Rajkumar S. The multiple myelomas - current concepts in cytogenetic classification and therapy. Nat Rev Clin Oncol. 2018. Jul;15(7):409–21. - PubMed
    1. Siegel RL, Miller KD, Wagle NS, Jemal A. Cancer statistics, 2023. CA Cancer J Clin. 2023. Jan;73(1):17–48. - PubMed
    1. Castella M, Fernández de Larrea C, Martín-Antonio B. Immunotherapy: a novel era of promising treatments for multiple myeloma. Int J Mol Sci. 2018. Nov;19(11):3613. - PMC - PubMed
    1. Raje N, Berdeja J, Lin Y, Siegel D, Jagannath S, Madduri D, Liedtke M, Rosenblatt J, Maus MV, Turka A, Lam LP, Morgan RA, Friedman K, Massaro M, Wang J, Russotti G, Yang Z, Campbell T, Hege K, Petrocca F, Quigley MT, Munshi N, Kochenderfer JN. Anti-BCMA CAR T-Cell Therapy bb2121 in Relapsed or Refractory Multiple Myeloma. N Engl J Med. 2019. May 2;380(18):1726–1737. - PMC - PubMed

Publication types

Substances