. 2023 Aug;10(24):e2300812.
doi: 10.1002/advs.202300812. Epub 2023 Jun 25.

Engineered Biomimetic Fibrillar Fibronectin Matrices Regulate Cell Adhesion Initiation, Migration, and Proliferation via α5β1 Integrin and Syndecan-4 Crosstalk

Affiliations

Engineered Biomimetic Fibrillar Fibronectin Matrices Regulate Cell Adhesion Initiation, Migration, and Proliferation via α5β1 Integrin and Syndecan-4 Crosstalk

Seungkuk Ahn et al. Adv Sci (Weinh). 2023 Aug.

Abstract

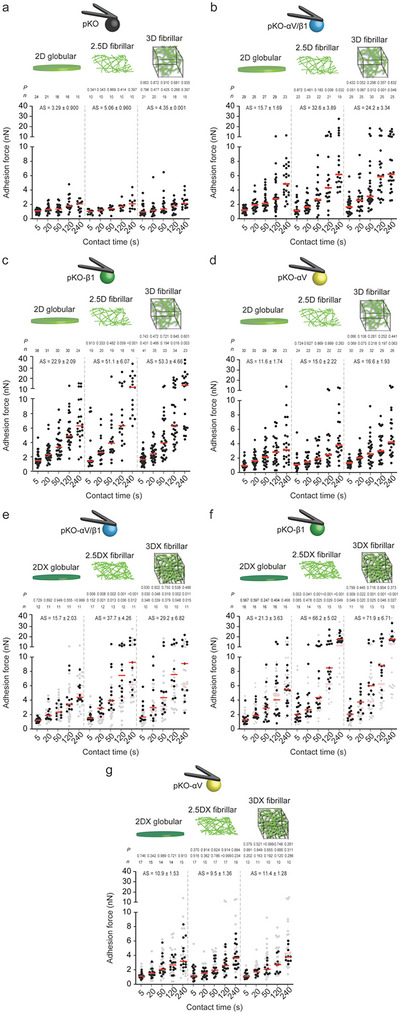
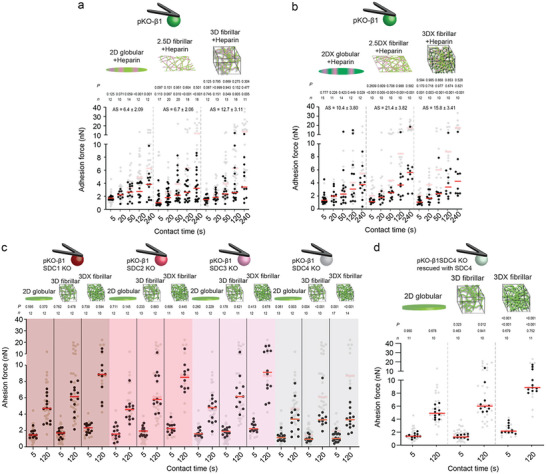
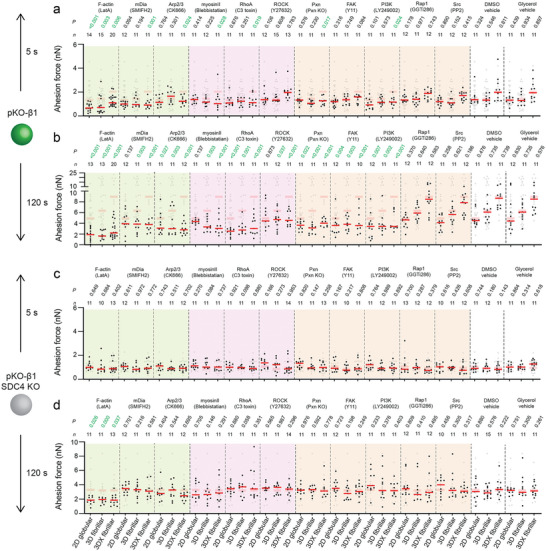
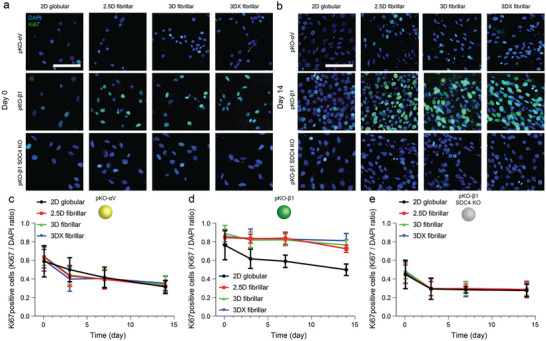
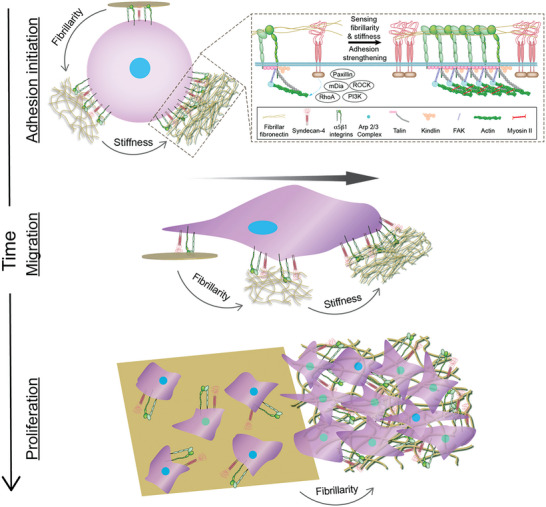
Cells regulate adhesion to the fibrillar extracellular matrix (ECM) of which fibronectin is an essential component. However, most studies characterize cell adhesion to globular fibronectin substrates at time scales long after cells polarize and migrate. To overcome this limitation, a simple and scalable method to engineer biomimetic 3D fibrillar fibronectin matrices is introduced and how they are sensed by fibroblasts from the onset of attachment is characterized. Compared to globular fibronectin substrates, fibroblasts accelerate adhesion initiation and strengthening within seconds to fibrillar fibronectin matrices via α5β1 integrin and syndecan-4. This regulation, which additionally accelerates on stiffened fibrillar matrices, involves actin polymerization, actomyosin contraction, and the cytoplasmic proteins paxillin, focal adhesion kinase, and phosphoinositide 3-kinase. Furthermore, this immediate sensing and adhesion of fibroblast to fibrillar fibronectin guides migration speed, persistency, and proliferation range from hours to weeks. The findings highlight that fibrillar fibronectin matrices, compared to widely-used globular fibronectin, trigger short- and long-term cell decisions very differently and urge the use of such matrices to better understand in vivo interactions of cells and ECMs. The engineered fibronectin matrices, which can be printed onto non-biological surfaces without loss of function, open avenues for various cell biological, tissue engineering and medical applications.

Keywords: 3D fibrillar fibronectin; adhesion initiation; extracellular matrix; integrin; spatiotemporal cell dynamics; syndecan.


Conflict of interest statement

The authors declare no conflict of interest.

Figures

Figure 1
Figure 1
Engineering 2.5D and 3D fibrillar fibronectin (FN) matrices. a) Schematic illustration of engineering 3D fibrillar FN matrices and 2.5D fibrillar FN matrices. First, a microporous grid (500 × 500 µm2 square pores, 200 µm thickness and a size of ≈6 × 6 mm2) made from an ABS‐like resin is 3D printed. The grid is placed in an Eppendorf tube filled with full‐length FN in PBS. The tube is then rotated (25 rpm) at 30 °C for 2 h to apply hydrodynamic shear force between the microgrid, FN solution, and air. After rotation, the grid embedded with a 3D fibrillar FN matrix can be removed from the Eppendorf tube and used. Contacting printing 3D fibrillar FN matrices onto glass covers the inorganic substrate with 2.5D fibrillar FN matrices. b) Representative fluorescence images of 2D globular FN substrates, 2.5D fibrillar FN matrices, and 3D fibrillar FN matrices. Fluorescence images show full‐length FN (green), unfolded FN (FN IST‐9, red), and both images merged. Dashed boxes in 2D globular FN substrates indicate the bleached area to distinguish fluorescent signal from background. Scale bars, 20 µm. c) AFM topography of 2D globular FN substrates scratched in the middle square area (purple dashed square). The height profile (red line) is generated along the red line in the topography. Scale bar, 5 µm. d) XZ projection confocal images of fibrillar FN matrices (green, full‐length FN antibody). Scale bar, 10 µm. e) Thickness analysis of globular FN substrates and fibrillar FN matrices. The mean thickness is 6.50 ± 0.31 nm for 2D globular FN substrates, 23.82 ± 4.93 µm for 2.5D fibrillar FN matrices, and 94.12 ± 9.59 µm for 3D fibrillar FN matrices. Dots represent the number of samples analyzed. Red bars indicate the mean and orange bars the standard error of the mean (s.e.). f) 3D reconstruction of confocal images showing a large‐scale coverage of fibrillar FN matrices across the 3D microporous grid. g) Engineered 3D fibrillar FN matrices are insoluble in DOC. Engineered 3D fibrillar FN matrices were treated with deoxycholate (DOC) solution (1% w/v) in PBS for a week. Confocal images of fluorescently stained (full‐length FN antibody, green) FN matrices were recorded before and 1 week after DOC treatment. Scale bars, 50 µm. h) Fluorescence image of fibrillar FN matrices (FN IST‐9, red) deposited by fibroblasts in vitro. Scale bar, 50 µm. i) Representative scanning electron microscopy (SEM) images of 2D globular FN substrates, 2.5D fibrillar FN matrices, and 3D fibrillar matrices. Scale bars, 1 µm.
Figure 2
Figure 2
Fibroblasts employ α5β1 integrin to differentiate between globular FN substrates, fibrillar FN matrices, and stiffened fibrillar FN matrices to strengthen adhesion faster. a–d) Adhesion forces of pan‐integrin‐null (pKO) fibroblasts expressing no FN‐binding integrins (a), pKO fibroblasts expressing α5β1 and αVβ3 integrins (pKO‐αV/β1) (b), pKO fibroblasts expressing α5β1 integrin (pKO‐β1) (c) or pKO fibroblasts expressing αVβ3 integrin (pKO‐αV) to 2D globular FN substrates, 2.5D fibrillar FN matrices, and 3D fibrillar FN matrices at given contact times (d). Dots represent adhesion forces of individual fibroblasts and red bars the median. n indicates the number of fibroblasts tested. Lower p values compare 2.5D fibrillar or 3D fibrillar FN matrices with 2D globular FN substrates. Upper p values compare 2.5D fibrillar with 3D fibrillar FN matrices. e–g), Adhesion forces of pKO‐αV/β1 (e), pKO‐β1 (f), or pKO‐αV (g) fibroblasts to PFA‐crosslinked 2D (2DX) globular FN substrates, PFA‐crosslinked 2.5D (2.5DX) fibrillar FN matrices, and PFA‐crosslinked 3D (3DX) fibrillar FN matrices at given contact times. Data representation as in (a–d). For reference adhesion forces of fibroblasts to respective non‐crosslinked FN substrates or matrices are given in gray. Bottom p values compare given adhesion forces with reference data. Middle p values compare 2.5DX fibrillar or 3DX fibrillar FN matrices with 2DX globular FN substrates. Upper p values compare 2.5DX fibrillar with 3DX fibrillar FN matrices. P values were calculated using two‐tailed Mann–Whitney test. AS indicates the slope of a linear regression and s.e. of the adhesion strengthening rate (pN s−1). n indicates the number of individual fibroblasts tested.
Figure 3
Figure 3
Syndecan‐4 crosstalks with α5β1 integrin to sense the fibrillarity and mechanical stiffness of FN. a,b) Adhesion forces of pKO‐β1 fibroblasts to heparin‐treated 2D globular FN substrates, 2.5D fibrillar FN matrices, and 3D fibrillar FN matrices a) without and b) with crosslinking. Reference adhesion forces of pKO‐β1 fibroblasts to non‐treated FN substrates or matrices are given in gray. Bottom p values compare given and reference data. Middle p values compare 2.5D fibrillar or 3D fibrillar FN matrices with 2D globular FN substrates. Top p values compare 2.5D fibrillar and 3D fibrillar FN matrices. AS indicates the slope of a linear regression and s.e. of adhesion strengthening rate (pN s−1). c) Adhesion forces of pKO‐β1 fibroblasts depleted from syndecan‐1 (SDC1 KO), syndecan‐2 (SDC2 KO), syndecan‐3 (SDC3 KO), or syndecan‐4 (SDC4 KO) to 2D globular, 3D fibrillar, and crosslinked 3D fibrillar (3DX) FN substrates. Adhesion forces of pKO‐β1 fibroblasts to respective FN substrates are given in gray as reference. p values compare given and reference data. d) Adhesion forces of pKO‐β1 SDC4 KO fibroblasts rescued with syndecan‐4 to 2D globular, 3D fibrillar, and crosslinked 3D fibrillar (3DX) FN substrates. Adhesion forces of pKO‐β1 fibroblasts to respective FN substrates are given in gray as reference. Bottom p values compare given and reference data. Middle p values compare 2.5D fibrillar or 3D fibrillar FN matrices with 2D globular FN substrates. Top p values compare 2.5D fibrillar and 3D fibrillar FN matrices. Dots represent adhesion forces of individual fibroblasts and red bars the median. n indicates the number of fibroblasts tested. p values were calculated using two‐tailed Mann–Whitney test.
Figure 4
Figure 4
α5β1 integrin and syndecan‐4 crosstalk requires F‐actin polymerization, myosin II‐mediated contractility, and FAK signaling to strengthen adhesion in response to FN fibrillarity and stiffness. a–d) Adhesion forces of pKO‐β1 (a,b) or pKO‐β1 (c,d) SDC4 KO fibroblasts to 2D globular FN substrates, 3D fibrillar FN matrices, and crosslinked 3D (3DX) fibrillar FN matrices at 5 s (a,c) and 120 s (b,d) contact times in the presence of perturbations for F‐actin polymerization (1 µm LatA), mDia (20 µm SMIFH2), Arp2/3 (200 µm CK666), myosin II (20 µm blebbistatin), RhoA (2 µm C3 toxin), ROCK (10 µm Y27632), FAK (10 µm Y11), PI3K (10 µm LY249002), Rap1 (10 µm GGTi286), or Src (20 µm PP2). The effect of paxillin was tested using paxillin knock‐out (Pxn KO) fibroblasts. Dimethyl sulfoxide (DMSO) or glycerol (50% v/v) were tested as vehicle controls. Dots represent adhesion forces of individual fibroblasts and red bars the median. n indicates the number of fibroblasts tested. Adhesion forces of non‐crosslinked pKO‐β1 (a,b) or pKO‐β1 SDC4 KO (c,d) fibroblasts in the respective condition are given in gray for reference. p values compare given with reference data.
Figure 5
Figure 5
Fibroblasts regulate migration in response to FN fibrillarity via α5β1 integrin and syndecan‐4. a,d,g) Timelapse images of pKO‐αV fibroblasts expressing paxillin‐GFP (a), pKO‐β1 fibroblasts expressing paxillin‐GFP (d) and pKO‐β1 SDC4 KO (g) fibroblasts labeled with a live cell membrane staining CellTracker dye seeded on given FN substrates and fibrillar matrices. Scale bar, 50 µm. b,e,h) Persistence of fibroblasts as calculated by the slope of log–log plots of the mean square displacement versus the log time (Figure S11, Supporting Information). c,f,i) Migration speed of fibroblasts calculated from fluorescence images. Dots represent persistence and migration speed of fibroblasts on 2D FN substrates and different fibrillar FN matrices. Red bars indicate the median. In (b,c), top row p values compare 3D and 3DX fibrillar FN matrices and bottom, middle row p values compare 3D or 3DX fibrillar FN matrices with 2.5D fibrillar FN matrices, and bottom row p values compare 2D globular FN substrate to fibrillar FN matrices. In (e,f,) top p values compare 3D and 3DX fibrillar FN matrices, second row p values compare 3D or 3DX fibrillar FN matrices with 2.5D fibrillar FN matrices, third row p values compare 2D globular FN substrate to fibrillar FN matrices and bottom row p values compare persistence and cell speed of pKO‐β1 fibroblasts with those of pKO‐αV fibroblasts. h,i) Top row p values compare 3D and 3DX fibrillar FN matrices, second row p values compare 3D or 3DX fibrillar FN matrices with 2.5D fibrillar FN matrices, third row p values compare 2D globular FN substrate to fibrillar FN matrices and bottom row p values compare persistence and cell speed of pKO‐β1 SDC4 KO fibroblasts with pKO‐β1 fibroblasts. n indicates the number of FN substrates tested. p values were calculated using two‐tailed Mann–Whitney t‐tests.
Figure 6
Figure 6
On fibrillar FN matrices fibroblasts maintain high proliferation via α5β1 integrin and sydecan‐4. a,b) Representative fluorescence images of fibroblasts on day 0 and 14. Blue and green represent DAPI and Ki67 staining, respectively. Scale bar, 50 µm. c–e) Ki67 positive (proliferative) fibroblasts as calculated by the ratio of Ki67 positive fibroblasts divided by DAPI stained pKO‐αV (c), pKO‐β1 (d), pKO‐β1 SDC4 KO (e) fibroblasts. n = 10 (two different regions of interest from five different samples per each condition). Symbols and error bars indicate the mean and standard deviation, respectively. Statistical analysis of proliferation data is shown in Figure S12, Supporting Information.
Figure 7
Figure 7
α5β1 integrin and syndecan‐4 sense the fibrillarity and mechanical stiffness of FN matrices and crosstalk to establish and regulate cell adhesion, migration, and proliferation. In fibroblasts α5β1 integrin and syndecan‐4 use multiple pathways to sense the fibrillarity and stiffness of FN. First, α5β1 integrin and syndecan‐4 bind to fibrillar FN and initiate cell adhesion. Within seconds, fibroblasts activate signaling pathways, which include mDia, Arp2/3, RhoA, paxillin, and PI3K, to strengthen adhesion to stiffer fibrillar FN by potentially polymerizing actin and myosin II‐mediated contraction. As adhesion matures, ROCK and FAK, in addition to the above‐mentioned signaling molecules, activate to further increase cell adhesion to both softer and stiffer fibrillar FN. Fibroblasts adhering to fibrillar FN matrices accelerate migration speed and enhance proliferation via α5β1 integrin and syndecan‐4. Although fibroblasts instantly sense fibrillar FN matrices via α5β1 integrin and syndecan‐4, both cell surface receptors are required to enhance migration speed ad proliferation for the time course of weeks. Upon stiffening of the fibrillar FN matrices the cell migration and proliferation further increase.

References

    1. a) Cukierman E., Pankov R., Stevens D. R., Yamada K. M., Science 2001, 294, 1708; - PubMed
    2. b) Hynes R. O., Science 2009, 326, 1216; - PMC - PubMed
    3. c) Frantz C., Stewart K. M., Weaver V. M., J. Cell Sci. 2010, 123, 4195. - PMC - PubMed
    1. Pankov R., Yamada K. M., J. Cell Sci. 2002, 115, 3861. - PubMed
    1. Schwarzbauer J. E., Sechler J. L., Curr. Opin. Cell Biol. 1999, 11, 622. - PubMed
    1. Bonnans C., Chou J., Werb Z., Nat. Rev. Mol. Cell Biol. 2014, 15, 786. - PMC - PubMed
    1. a) Humphries J. D., Byron A., Humphries M. J., J. Cell Sci. 2006, 119, 3901; - PMC - PubMed
    2. b) Hynes R. O., Cell 2002, 110, 673. - PubMed

Publication types

LinkOut - more resources