. 2023 Jul;21(3):615-630.
doi: 10.1007/s12021-023-09632-8. Epub 2023 Jun 26.

Localization and Registration of 2D Histological Mouse Brain Images in 3D Atlas Space

Affiliations

Localization and Registration of 2D Histological Mouse Brain Images in 3D Atlas Space

Maryam Sadeghi et al. Neuroinformatics. 2023 Jul.

Abstract

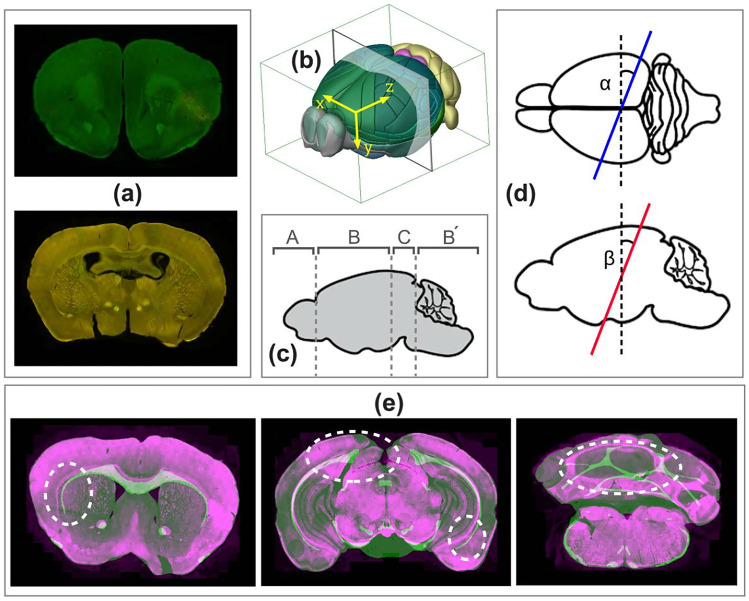
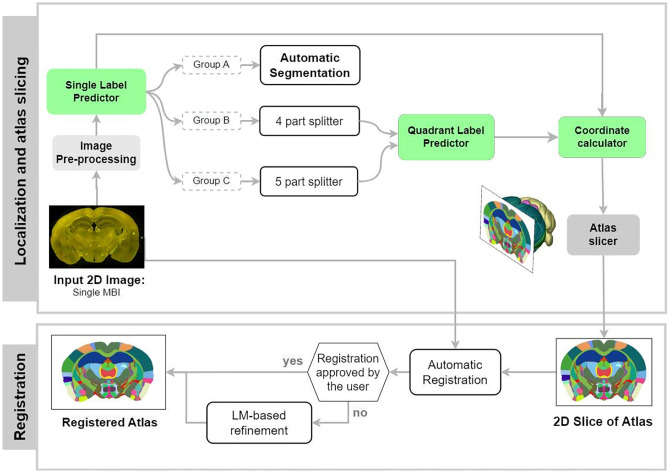
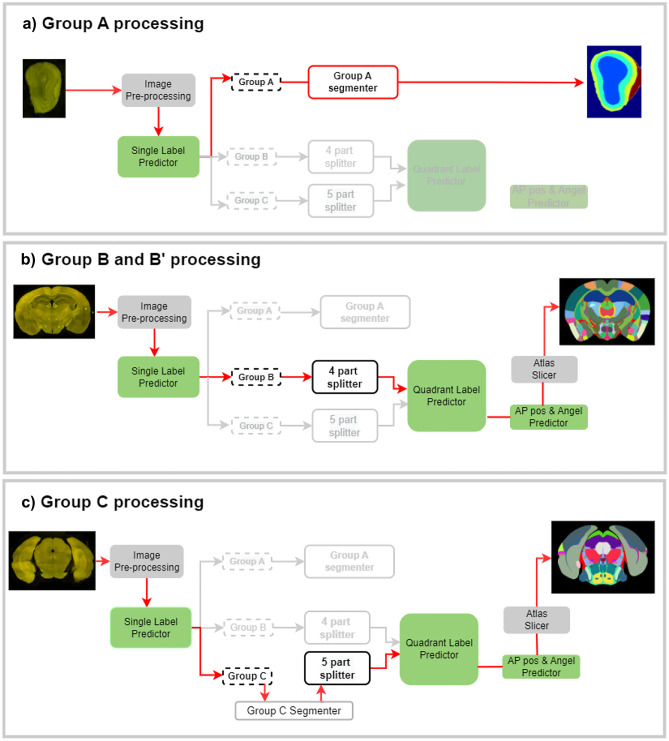
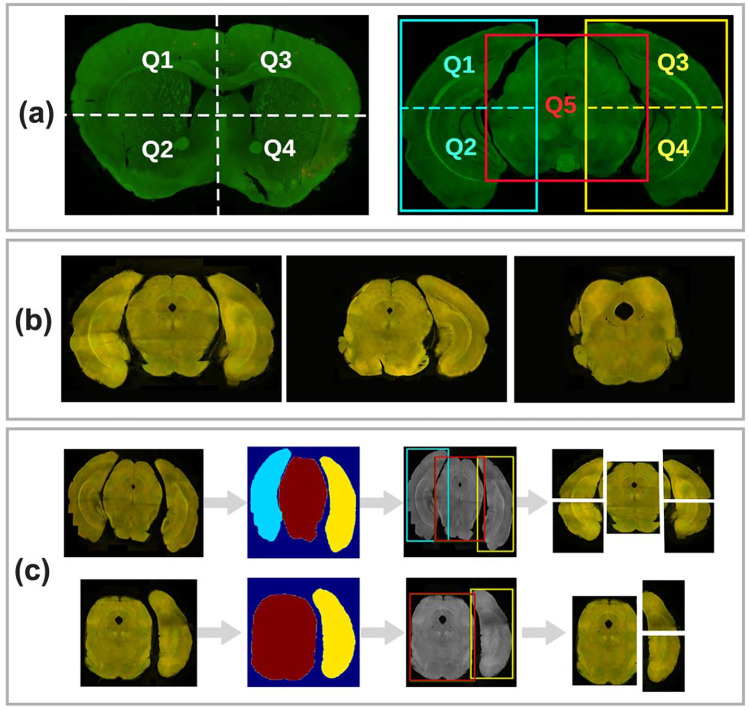
To accurately explore the anatomical organization of neural circuits in the brain, it is crucial to map the experimental brain data onto a standardized system of coordinates. Studying 2D histological mouse brain slices remains the standard procedure in many laboratories. Mapping these 2D brain slices is challenging; due to deformations, artifacts, and tilted angles introduced during the standard preparation and slicing process. In addition, analysis of experimental mouse brain slices can be highly dependent on the level of expertise of the human operator. Here we propose a computational tool for Accurate Mouse Brain Image Analysis (AMBIA), to map 2D mouse brain slices on the 3D brain model with minimal human intervention. AMBIA has a modular design that comprises a localization module and a registration module. The localization module is a deep learning-based pipeline that localizes a single 2D slice in the 3D Allen Brain Atlas and generates a corresponding atlas plane. The registration module is built upon the Ardent python package that performs deformable 2D registration between the brain slice to its corresponding atlas. By comparing AMBIA's performance in localization and registration to human ratings, we demonstrate that it performs at a human expert level. AMBIA provides an intuitive and highly efficient way for accurate registration of experimental 2D mouse brain images to 3D digital mouse brain atlas. Our tool provides a graphical user interface and it is designed to be used by researchers with minimal programming knowledge.

Keywords: 2D in 3D localization; Deep learning; Image registration; Mouse Brain Mapping.


Figures

Fig. 1
Fig. 1
a Examples of histological MBIs sliced at non-standard angles. b Demonstration of the axes in the 3D mouse brain space: x-axis = left-to-right, y-axis = dorsal-to-ventral and z-axis = anterior-to-posterior, and the origin of the coordinate system. c Categorization of the MBIs based on the position along the z-axis d Definition of the mediolateral angle (α) and the dorsoventral angle (β) in the horizontal and sagittal views, respectively. e Examples of an MBI (purple) superimposed on the registered atlas (green) using Ardent registration showing mismatch of the internal structures (dashed white markings)
Fig. 2
Fig. 2
Diagram showing key steps in the workflow of AMBIA’s localization and registration modules. The localization module calculates the AP position d and slicing angles α, β of the input histological MBI, based on the single label value and the quadrant/quintant label values. It consecutively extracts a 2D atlas by virtually slicing the 3D atlas with the calculated plane coordinates [α, β, d]. The registration module then registers the 2D atlas to the MBI using an automatic deformable registration followed by optional manual landmark (LM)-based refinement by the user
Fig. 3
Fig. 3
a Examples of dataset used for training the localization module, categorized based on the position of MBIs along the AP axis into groups A, B, C and B’ images b Examples of MBI used for testing the registration module, categorized based on artifact levels into level 1, 2 and 3
Fig. 4
Fig. 4
Processing workflow of the localization module for different MBI groups. a Group A images are processed via an automatic segmentation method. The group A segmentation model segments brain regions without the need for an atlas. b Group B and B’ images are split into 4 quadrants and then fed into the QL predictor. c Group C images are split into 5 quintants using the help of the group C segmentation algorithm, and then fed into the QL predictor
Fig. 5
Fig. 5
a Quadrant splitting and numbering system for group B, B’ (left) and C (right) images, b Examples of group C images, which are prone to detachment and losing the left or right cerebrum during processing. c Group C segmentation model annotates the regions to help with identifying missing regions, as well as boundaries for cropping five quintants. The images are resized to dimensions of 256x256 pixels and input into the segmentation model, which detects the regions and their respective bounding boxes. Subsequently, the images and bounding boxes are resized back to their original size and aspect ratios
Fig. 6
Fig. 6
Workflow of AMBIA’s registration module. The module inputs the 2D MBI and 2D atlas image. The atlas image is converted into a simplified representation where fiber tracts are recolored to gray and the rest of the regions are converted to green to create a good contrast similar to visible anatomical structures in an MBI. Ardent registration is performed on the images. The user has the option to refine the registration by choosing landmarks through the GUI
Fig. 7
Fig. 7
Examples of four anatomical structures out of 30 structures chosen to assess the performance of the registration module. For each brain structure highlighted region on the Allen coronal atlas plane, the segmentation outlines as a result of the registration of the three raters (dim colored lines) the consensus outline for the same structure (bold colored line) determined by the majority vote, are shown
Fig. 8
Fig. 8
a Qualitative and visual evaluation of the performance of the localization module. First row) Histological MBIs from the test set. Second row) the atlas is sliced based on the coordinates and angles predicted by our pipeline. Third row) the atlas is extracted from standard 2D coronal atlas planes without considering the section angles. The white markings highlight the areas where a tilted atlas section has considerable structural difference to the reference coronal atlas plane. b MAE of the SL predictor compared with the four raters, which is statistically non-significant to raters 3 and 4. c Group Accuracy comparison between four raters and the SL predictor across different artifact groups. The dashed line represents the average group accuracy for all artifact levels. d The average standard deviation of the four raters evaluated in different AP positions. e MAE of the SL predictor compared with the four raters, which is statistically non-significant to raters 2, 3 and 4. f Accuracy 2SD comparison between four raters and the QL predictor across different artifact groups. The dashed line represents the average group accuracy for all artifact levels. g Average standard deviation of the four raters evaluated in different artifact levels
Fig. 9
Fig. 9
Performance of the group A segmentation model on six test images (first row), expert annotation (second row) compared to the segmentation model performance (third row). Due to limited anatomical structures in group A MBIs, we decided to use segmentation for this group of images. The segmentation model segments five anatomical regions MOBgr, MOBopl, MOBgl, AOB, fibertracts
Fig. 10
Fig. 10
Multi-level assessment of the performance of the AMBIA registration module. a Boxplots of dice scores for the automatic (green) and semi-automatic (white) registration methods compared to the ground truth for level 5 brain regions. b shows a similar comparison for level 4 and level 3 brain regions. c Comparison of manual annotations by three raters for three different test brains. d The average (thick line) and range of number of landmarks (shaded area) selected by the four raters for different MBI along the AP axis for the manual and semi-automatic methods. e Average dice score for the semi-automatic and automatic registration along the AP axis
Fig. 11
Fig. 11
Qualitative evaluation of the registration module. The images show the original MBI, the automatically registered image, and the corrected and refined registration obtained using landmark-based refinement. The MBI (purple) is superimposed on the registered atlas image (green). The figure demonstrates the ability of the registration module to identify and correct misalignment in MBI, as well as the utility of user input in improving the accuracy of the registration. Dashed white markings are used to highlight some regions to show the advantage of manual refinement in the inner structures

References

    1. Abdelmoula WM, Carreira RJ, Shyti R, Balluff B, van Zeijl RJ, Tolner EA, Lelieveldt BF, van den Maagdenberg AM, McDonnell LA, Dijkstra J. Automatic registration of mass spectrometry imaging data sets to the Allen brain Atlas. Analytical Chemistry. 2014;86(8):3947–3954. doi: 10.1021/ac500148a. - DOI - PubMed
    1. Agarwal, N., Xu, X., & Gopi, M. (2017). Automatic detection of histological artifacts in mouse brain slice images. In Medical Computer Vision and Bayesian and Graphical Models for Biomedical Imaging: MICCAI 2016 International Workshops, MCV and BAMBI, Athens, Greece, October 21, 2016, Revised Selected Papers 8 (pp. 105–115). Springer.
    1. Allen Institute. Allen Mouse Brain Atlas. Retrieved March 2020, from: http://mouse.brain-map.org/
    1. Allen Institute. Informatics Archive of the Allen Institute. Retrieved January 2021, from: http://download.alleninstitute.org/informatics-archive/current-release/m...
    1. Bai J, Trinh TLH, Chuang K-H, Qiu A. Atlas-based automatic mouse brain image segmentation revisited: Model complexity vs. image registration. Magnetic Resonance Imaging. 2012;30(6):789–798. doi: 10.1016/j.mri.2012.02.010. - DOI - PubMed

Publication types

LinkOut - more resources