. 2024 Jan;57(1):e13524.
doi: 10.1111/cpr.13524. Epub 2023 Jun 25.

MRLC controls apoptotic cell death and functions to regulate epidermal development during planarian regeneration and homeostasis

Affiliations

MRLC controls apoptotic cell death and functions to regulate epidermal development during planarian regeneration and homeostasis

Yujia Sun et al. Cell Prolif. 2024 Jan.

Abstract

Adult stem cells (ASCs) are pluripotent cells with the capacity to self-renew and constantly replace lost cells due to physiological turnover or injury. Understanding the molecular mechanisms of the precise coordination of stem cell proliferation and proper cell fate decision is important to regeneration and organismal homeostasis. The planarian epidermis provides a highly tractable model to study ASC complex dynamic due to the distinct spatiotemporal differentiation stages during lineage development. Here, we identified the myosin regulatory light chain (MRLC) homologue in the Dugesia japonica transcriptome. We found high expression levels of MRLC in wound region during regeneration and also expressed in late epidermal progenitors as an essential regulator of the lineage from neoblasts to mature epidermal cells. We investigated the function of MRLC using in situ hybridization, real-time polymerase chain reaction and double fluorescent and uncovered the potential mechanism. Knockdown of MRLC leads to a remarkable increase in cell death, causes severe abnormalities during regeneration and homeostasis and eventually leads to animal death. The global decrease in epidermal cell in MRLC RNAi animals induces accelerated epidermal proliferation and differentiation. Additionally, we find that MRLC is co-expressed with cdc42 and acts cooperatively to control the epidermal lineage development by affecting cell death. Our results uncover an important role of MRLC, as an inhibitor of apoptosis, involves in epidermal development.


Conflict of interest statement

The authors declare no competing financial interests.

Figures
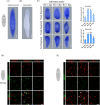
FIGURE 1
FIGURE 1
Expression pattern of MRLC during planarian regeneration. (A) WISH with antisense MRLC probe in uninjured animals (n ≥ 10). The ubiquitous expression patterns were observed. (B) WISH with sense MRLC probe in intact planarian showed the absence of hybridization signal. (C) Temporal pattern of MRLC expression during regeneration. Wild‐type animals were cut transversely into three pieces before and after the pharynx, and MRLC expression was analysed using Whole‐mount in situ hybridization. Strong expression of MRLC is mainly in wound region at 1, 3 and 7 days following wounding. Quantification of MRLC expression levels in the anterior and posterior end in regenerants from head and tail fragments were measured through qPCR. The white arrows point to higher expression in the wound region. Each stain had ≥10 worms assayed. qRT‐PCR data obtained from biologically and technically triplicated. *p < 0.05; **p < 0.01. (D–E) Double fluorescent in situ hybridization of MRLC combined with markers of different stages of epidermal development in regenerating and normal animals. MRLC expression in late epidermal progenitors. Double‐positive cells are denoted with white arrows. The red box in the cartoon depicts the region imaged. Each stain had ≥10 worms assayed. Scale bars: 200 μm in (A–C). 50 μm in (D–E).
FIGURE 2
FIGURE 2
MRLC is required for planarian regeneration and tissue homeostasis. (A) qRT‐PCR to measure MRLC transcript levels after RNAi. The MRLC transcript levels were reduced at 2 days after the last injection. The experiments were biologically and technically triplicated. At least 30 animals were assayed. Error bars represent standard errors of the SD;*p < 0.05. (B) Regeneration phenotypes of heads, trunk and tail fragments after treatment with control dsRNA or MRLC dsRNA (n = 20). As compared with control (RNAi) worms, MRLC (RNAi) regeneration is severely deficient. White arrows point to the defects in epidermis. Scale bars: 200 μm. (C) Survival curves for control and MRLC (RNAi) animals during regeneration (n = 20). (D) Immunostaining with anti‐synapsin antibody in regenerating fragments 7 days after amputation (n = 8). White boxes indicate the defects in the central nervous system. Scale bars: 200 μm. (E, F) Intact phenotypes for control and MRLC RNAi animals during normal tissue turnover (n = 20). The uninjured experimental worms generated severe abnormalities, characterized by darkening of epidermis. The worms completely lost their heads by day 11 and eventually lyse. Survival curves for control and MRLC (RNAi) animals are on the right. Scale bars: 300 μm.
FIGURE 3
FIGURE 3
MRLC is required for cell proliferation and the proper differentiation of epidermal progeny cell. (A) Animals were stained at 7 days after last injecting, using the marker H3ser10p, which marks dividing cells during the G2/M transition of the cell cycle. Quantification of H3P‐positive cells in control and MRLC (RNAi) intact animals on the right (n = 8). Scale bars: 200 μm. (B–D) Examination of stem cell and epidermal progenitor population at 7 days post‐RNAi in intact worms. Whole‐mount in situ hybridization (WISH) of lineage markers for stem cells piwi‐1, early progeny prog‐1 and late progeny AGAT‐1 (n ≥ 10). Scale bars: 200 μm. (E, F) Analysis of later progeny marker vimentin and the mature epidermal cell‐specific marker LaminB by WISH during epidermal differentiation (n ≥ 10). (B–F) Quantification of the level of expression of piwi‐1, prog‐1, AGAT‐1, vimentin and LaminB by qRT‐PCR. n = 30 worms with biological triplicates. *p < 0.05, **p < 0.01; Scale bars: 200 μm. The error bars indicate SD. (G) Examination of the epidermal marker LaminB by WISH in regenerating head, trunk and tail fragments in RNAi worms (n ≥ 10). Animals were transversely dissected into three pieces before and after the pharynx at last injecting and fixed at 7 days post‐amputation. At least eight biological replicates were used. Scale bars: 200 μm. (G‐F) The white arrows and boxes indicate the loss of the mature epidermal cell population. (H) whole‐mount immunofluorescence for phosphorylated histone H3 (H3ser10p) in MRLC RNAi regenerating worms 48 h post‐amputation (n = 8). The number of PhosphoH3+ cells in the regenerating blastema of MRLC RNAi animals was increased compared with control animals. The red box in cartoon depicts the region imaged. The White dotted line indicates the wound boundary. Scale bars: 200 μm. (I) Analysis of early progeny, late progeny and later progeny markers by fluorescent in situ hybridization in the regenerating blastemas of RNAi worms at 48 h (n ≥ 8). White dashed lines outline the animals. Scale bars: 200 μm. (J) Epidermal populations are assayed by FISH for prog‐1, AGAT‐1, vimentin and DAPI at 5dpa (n ≥ 8). Scale bars: 50 μm.
FIGURE 4
FIGURE 4
MRLC (RNAi) animals display a marked increase in epidermal cells without affecting the regeneration of muscle, nervous system and gut. (A–C) Analysis of muscle marker and anatomy markers by WISH and qPCR in control and MRLC RNAi intact animals fixed at day 7 after the last injecting (n ≥ 10). Scale bars: 200 μm. (D) Immunostaining with anti‐synapsin, which visualize the central nervous in regenerating head and tail fragments 3 days after amputation (n ≥ 8). Scale bars: 200 μm. (E–J) FISH for BrdU and different cell (collagen, hnf4 and AGAT‐1) in control and MRLC knockdown worms. The worms were soaked with Brdu at 5 days after amputations, fixed animals after 24 h. The histogram depicts the percentage of colocalized cell in control and MRLC RNAi worms (F, H, J) (n = 8). The red box in the left cartoon depicts the region imaged. Double‐positive cells are marked with white arrowheads. **p < 0.01. Scale bars: 50 μm.
FIGURE 5
FIGURE 5
MRLC (RNAi) alters apoptotic cell death pattern in planarian regeneration and tissue homeostasis. (A) TUNEL staining measuring apoptosis in control (RNAi) and MRLC (RNAi) intact animals at day 7 post‐RNAi (n ≥ 8). (B) Quantification of TUNEL‐positive cells over the surface area in (A). (C) qRT‐PCR analysis quantifying caspase‐2, caspase‐7, bak and Bcl‐2 expression at 2 days after the last injecting. n = 30 worms with biological triplicate. *p < 0.05, **p < 0.01; The error bars indicate SD. (D) Who‐mount TUNEL staining showing apoptotic cells in the wound region (4 hR) and in pre‐existing regions (3dR) post‐amputation in the control (RNAi) and MRLC (RNAi) worms. (E, F) Quantification of TUNEL‐positive cells over the surface area in (D) showing excessive apoptotic cell death in the experimental group. At least 10 biological replicates were used per time point. Error bars represent standard errors of the mean; *p < 0.05; Scale bars: 300 μm.
FIGURE 6
FIGURE 6
MRLC and cdc42 synergize to control epidermal development. (A–D) Single and double‐RNAi as indicated to examine interactions between MRLC and cdc42. The total concentrations of dsRNA were normalized with the control dsRNA. Double inhibition of MRLC and cdc42 led to pronounced phenotypic defects and accelerated worm lysis. Survival curves for control and cdc42 (RNAi), MRLC (RNAi) and cdc42/MRLC (RNAi) animals (n = 20 at each RNAi condition). Scale bars: 300 μm. (E) Double FISH, cdc42 (red) and MRLC (green) in wild animals (n = 10). Red boxes represent the region imaged. White arrowheads highlight double‐positive cells. Scale bars: 50 μm. (F–I) Representative WISH images of RNAi animals with a corresponding qRT‐PCR for neoblast (piwi‐1), early progeny (prog‐1), late progeny (AGAT‐1) and mature epidermal cell (LaminB). Each stain had ≥10 worms assayed. qRT‐PCR data obtained from biologically and technically triplicated. *p < 0.05, **p < 0.01; Scale bars: 200 μm. The error bars indicate SD. (J) Cell death in uninjured animals was assayed by TUNEL staining at day 5 post‐RNAi (n = 10). Animals were treated with control, MRLC and cdc42 dsRNA by injection. Scale bars: 300 μm. (K) Quantification of TUNEL‐positive cells over the surface area in (J). *p < 0.05, **p < 0.01. (L) Who‐mount TUNEL staining showing apoptotic cells in the wound region (4 hR) and in pre‐existing regions (3dR) post‐amputation in the single or double genes inhibition worms (n = 10). simultaneous MRLC and cdc42 RNAi dramatically increased the number of TUNEL‐positive cells. Scale bars: 300 μm. (M, N) Quantification of TUNEL‐positive cells over the surface area in (L). At least eight biological replicates were used per time point. Error bars represent standard errors of the mean; Each asterisk or double asterisk indicates statistically significant differences between the experiment group and control group. *p < 0.05; **p < 0.01; Scale bars: 300 μm.

Similar articles

Cited by

References

    1. Xie W, Zhou J. Regulation of mitotic spindle orientation during epidermal stratification. J Cell Physiol. 2017;232:1634‐1639. - PubMed
    1. Hombach S, Kretz M. The non‐coding skin: exploring the roles of long non‐coding RNAs in epidermal homeostasis and disease. BioEssays. 2013;35:1093‐1100. - PubMed
    1. Muroyama A, Lechler T. Polarity and stratification of the epidermis. Semin Cell Dev Biol. 2012;23:890‐896. - PMC - PubMed
    1. Lopez‐Pajares V, Yan K, Zarnegar BJ, Jameson KL, Khavari PA. Genetic pathways in disorders of epidermal differentiation. Trends Genet. 2013;29:31‐40. - PMC - PubMed
    1. Zhu SJ, Pearson BJ. Smed‐myb‐1 specifies early temporal identity during planarian epidermal differentiation. Cell Rep. 2018;25:38‐46.e33. - PubMed

Substances